| Param | Original file | Final file |
|---|---|---|
| Filename | modeM0/AS1A13_080T06_9000005954_44155cztM0_level2.fits | modeM0/AS1A13_080T06_9000005954_44155cztM0_level2_quad_clean.evt |
| Size (bytes) | 337,311,360 | 66,257,280 |
| Size | 321.7 MB | 63.2 MB |
| Events in quadrant A | 3,748,089 | 441,547 |
| Events in quadrant B | 3,205,473 | 444,058 |
| Events in quadrant C | 1,974,681 | 447,558 |
| Events in quadrant D | 3,252,935 | 396,083 |
| Mode SS | |||
|---|---|---|---|
| Quadrant | BADHDUFLAG | Total packets | Discarded packets |
| A | 0 | 82 | 0 |
| B | 0 | 82 | 0 |
| C | 0 | 82 | 0 |
| D | 0 | 82 | 0 |
| Mode M0 | |||
|---|---|---|---|
| Quadrant | BADHDUFLAG | Total packets | Discarded packets |
| A | 0 | 14146 | 1 |
| B | 0 | 12253 | 1 |
| C | 0 | 8526 | 1 |
| D | 0 | 12385 | 1 |
| Mode M9 | |||
|---|---|---|---|
| Quadrant | BADHDUFLAG | Total packets | Discarded packets |
| A | 0 | 12 | 0 |
| B | 0 | 12 | 0 |
| C | 0 | 12 | 0 |
| D | 0 | 12 | 0 |
| Quadrant | Total seconds | Saturated seconds | Saturation percentage |
|---|---|---|---|
| A | 3917 | 253 | 6.459025% |
| B | 3917 | 404 | 10.314016% |
| C | 3917 | 30 | 0.765892% |
| D | 3917 | 179 | 4.569824% |
Noise dominated data is calculated using 1-second bins in cleaned event files. If a bin has >2000 counts, and if more than 50% of those come from <1% of pixels, then it is considered to be noise-dominated and hence unusable.
| Quadrant | # 1 sec bins | Bins with >0 counts | Bins with >2000 counts | High rate bins dominated by noise | Noise dominated (total time) | Noise dominated (detector-on time) | Marked lightcurve |
|---|---|---|---|---|---|---|---|
| A | 5167 | 3918 | 165 | 165 | 3.19% | 4.21% | 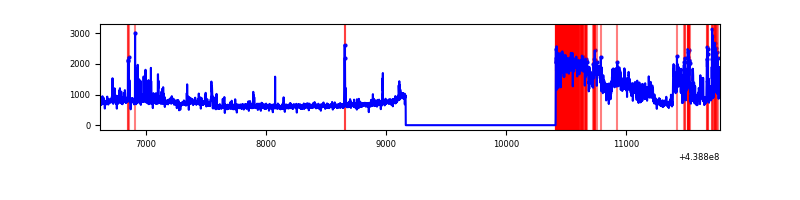 |
| B | 5167 | 3918 | 220 | 220 | 4.26% | 5.62% | 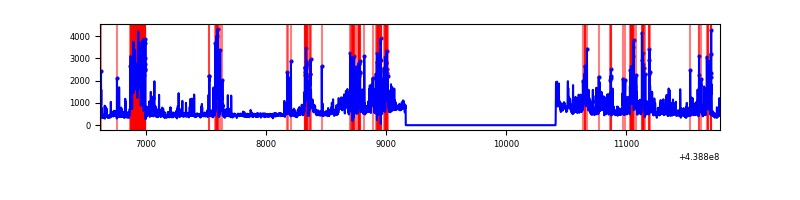 |
| C | 5167 | 3918 | 13 | 13 | 0.25% | 0.33% | 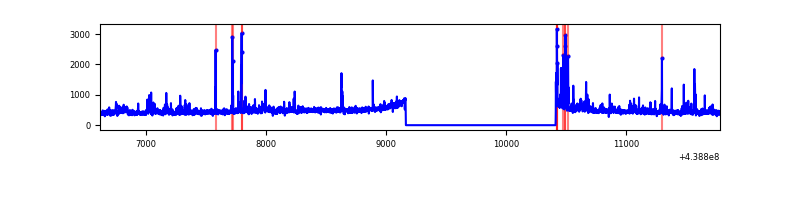 |
| D | 5167 | 3918 | 119 | 119 | 2.30% | 3.04% | 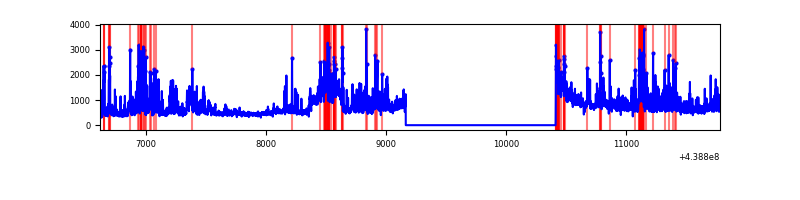 |
Top three noisy pixels from each quadrant. If the there are fewer than three noisy pixels in the level2.evt file, extra rows are filled as -1
| Pixel properties | Quadrant properties | ||||||
|---|---|---|---|---|---|---|---|
| Quadrant | DetID | PixID | Counts | Sigma | Mean | Median | Sigma |
| A | 10 | 83 | 893759 | 9647.28 | 447 | 438 | 92.6 |
| A | 15 | 223 | 740482 | 7991.99 | 447 | 438 | 92.6 |
| A | 14 | 237 | 88308 | 948.94 | 447 | 438 | 92.6 |
| B | 5 | 255 | 445417 | 5226.2 | 439 | 427 | 85.1 |
| B | 5 | 172 | 228386 | 2677.27 | 439 | 427 | 85.1 |
| B | 5 | 235 | 191345 | 2242.24 | 439 | 427 | 85.1 |
| C | 14 | 254 | 86328 | 827.06 | 443 | 447 | 103.8 |
| C | 3 | 233 | 53623 | 512.1 | 443 | 447 | 103.8 |
| C | 15 | 208 | 50593 | 482.92 | 443 | 447 | 103.8 |
| D | 13 | 187 | 387526 | 3453.99 | 434 | 418 | 112.1 |
| D | 1 | 52 | 298368 | 2658.48 | 434 | 418 | 112.1 |
| D | 13 | 171 | 150643 | 1340.39 | 434 | 418 | 112.1 |
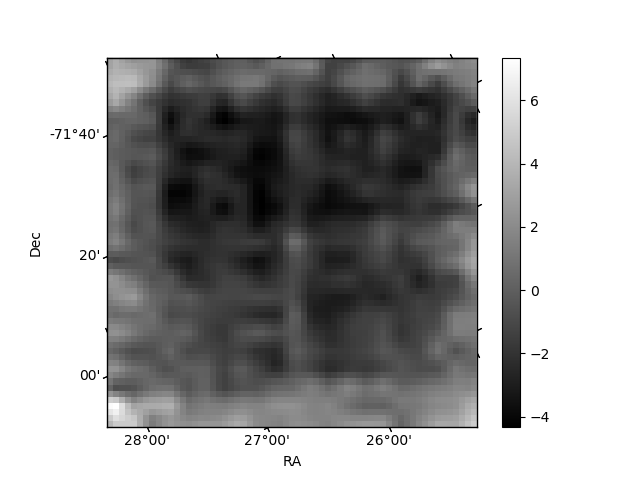
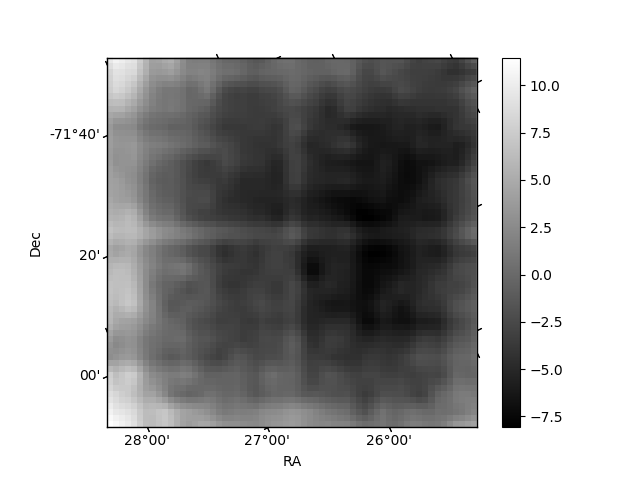
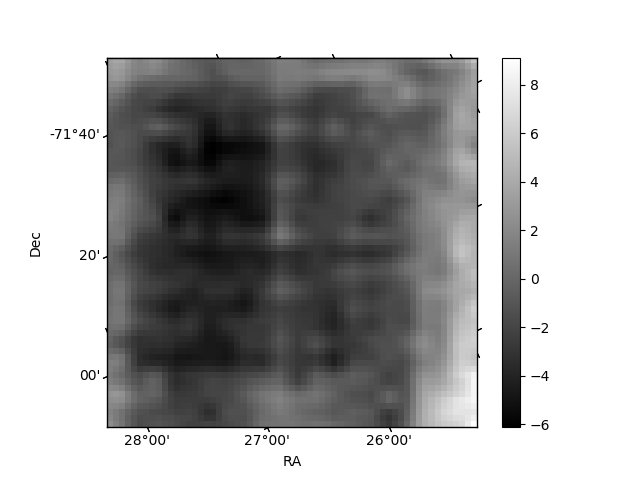
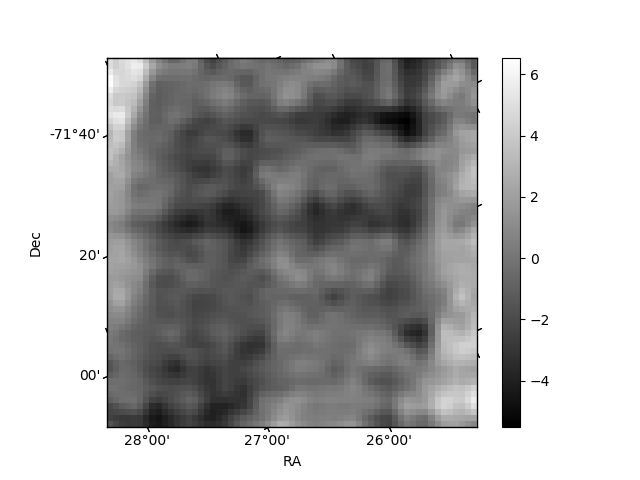
Histogram calculated using DETX and DETY for each event in the final _common_clean file
| Quadrant A | 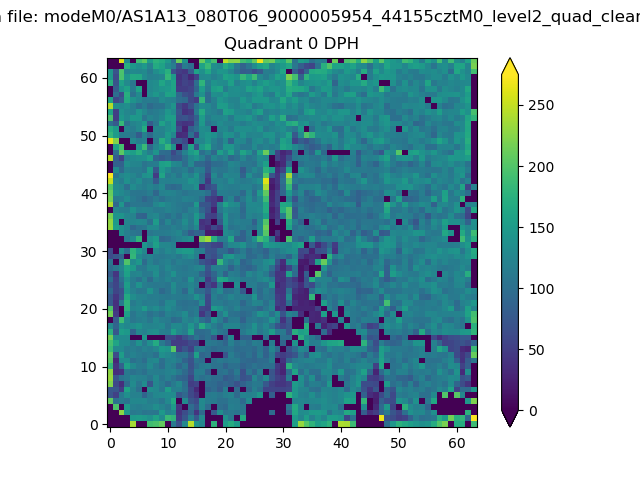 |
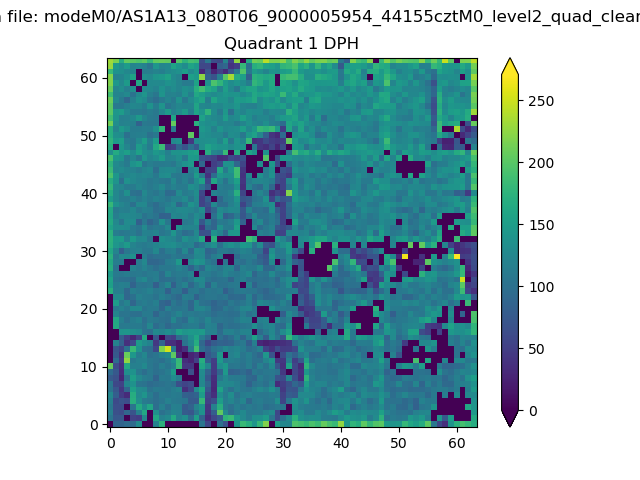 |
Quadrant B |
|---|---|---|---|
| Quadrant D |  |
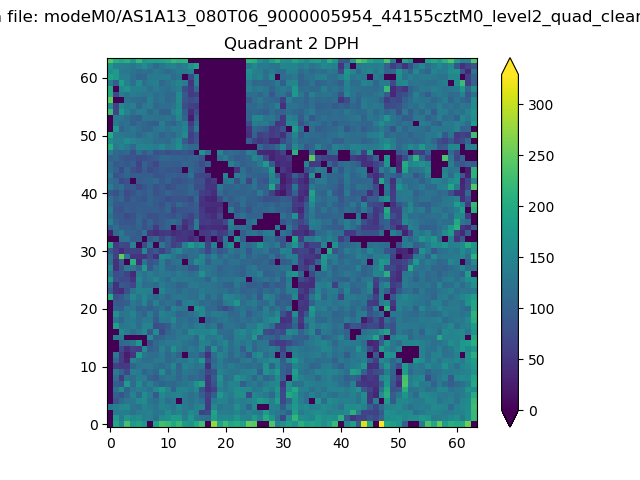 |
Quadrant C |
| Plot type | Count rate plots | Images |
|---|---|---|
| Comparison with Poisson distribution Blue bars denote a histogram of data divided into 1 sec bins. Red curve is a Poisson curve with rate = median count rate of data. |
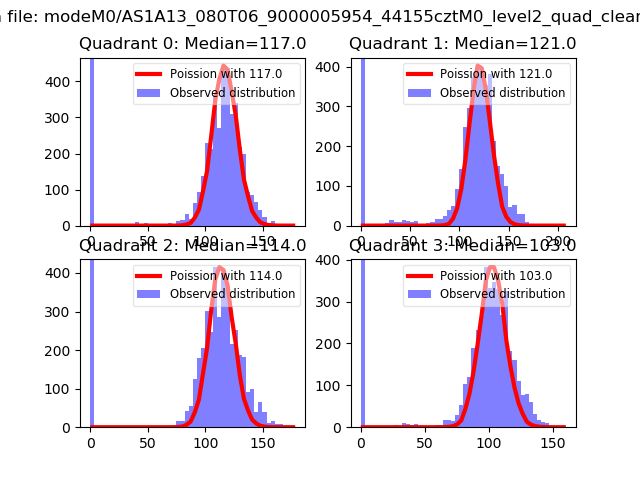 |
 |
| Quadrant-wise count rates Data is divided into 100 sec bins |
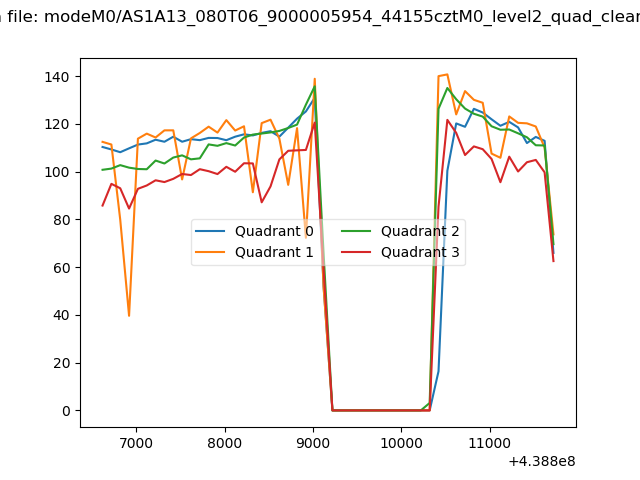 |
|
| Module-wise count rates for Quadrant A Data is divided into 100 sec bins |
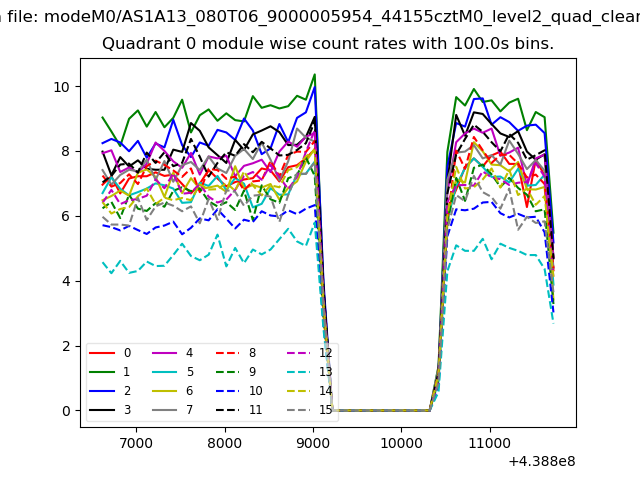 |
 |
| Module-wise count rates for Quadrant B Data is divided into 100 sec bins |
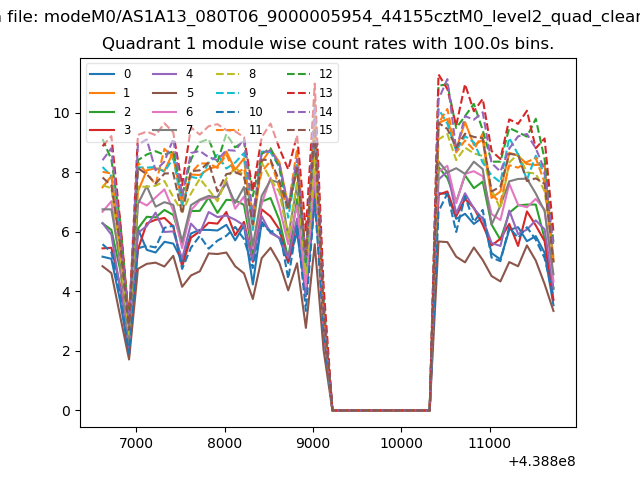 |
 |
| Module-wise count rates for Quadrant C Data is divided into 100 sec bins |
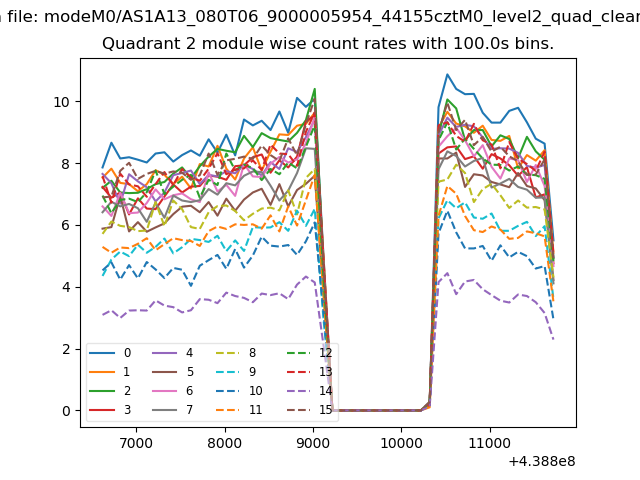 |
 |
| Module-wise count rates for Quadrant D Data is divided into 100 sec bins |
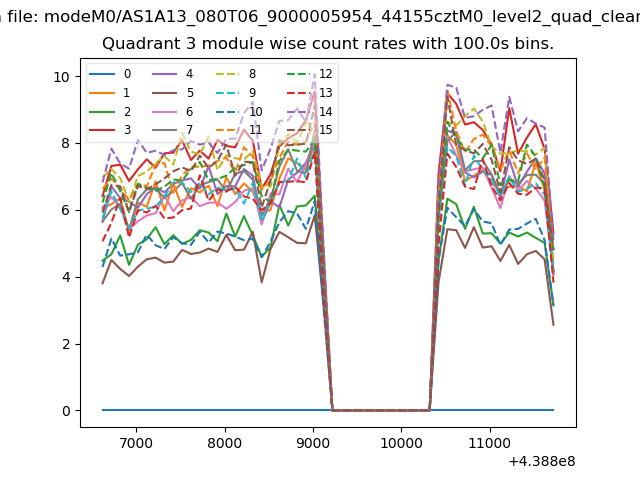 |
 |
| Parameter | Plot |
|---|---|
| CZT HV Monitor | 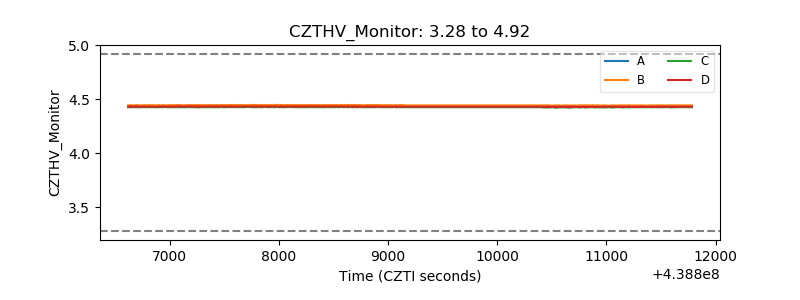 |
| D_VDD | 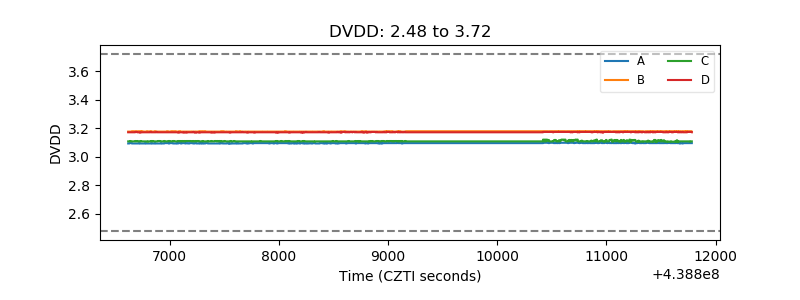 |
| Temperature 1 | 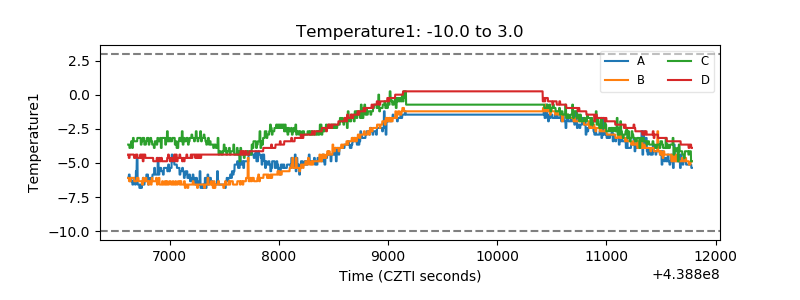 |
| Veto HV Monitor | 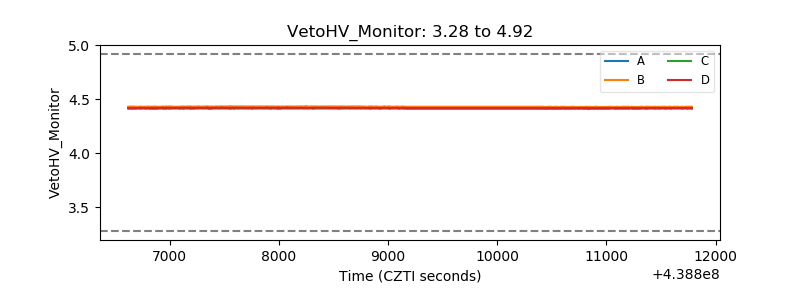 |
| Veto LLD | 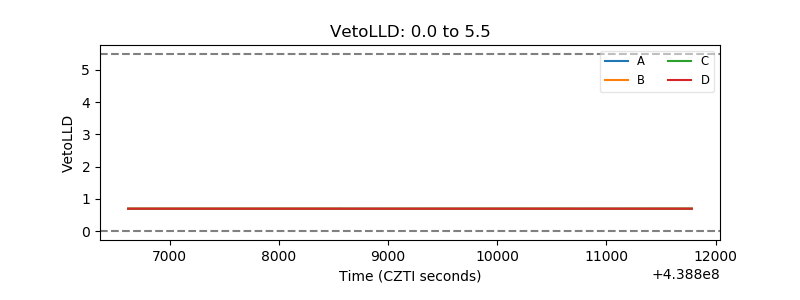 |
| Alpha Counter | 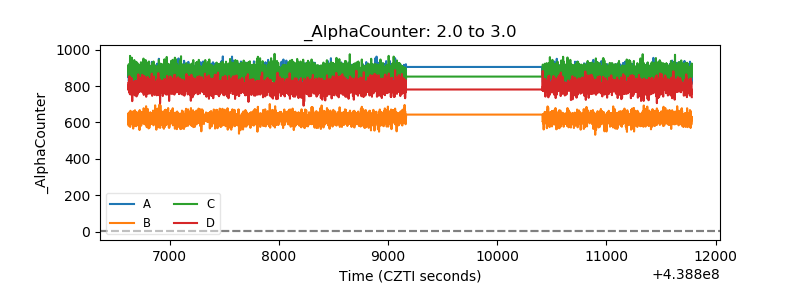 |
| _CPM_Rate | 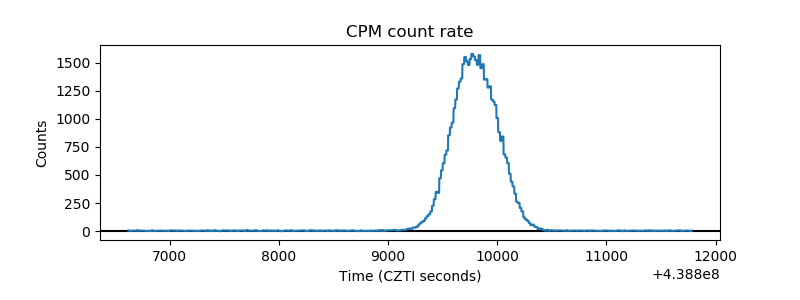 |
| CZT Counter | 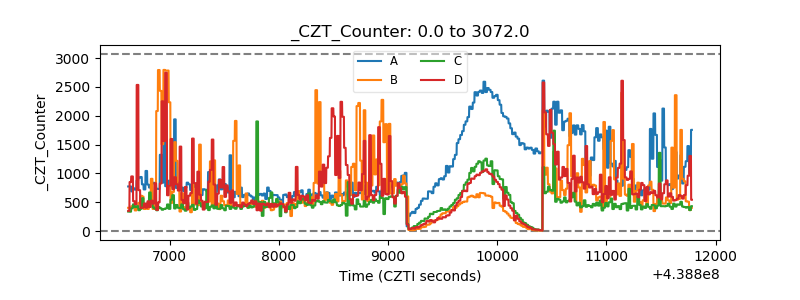 |
| +2.5 Volts monitor | 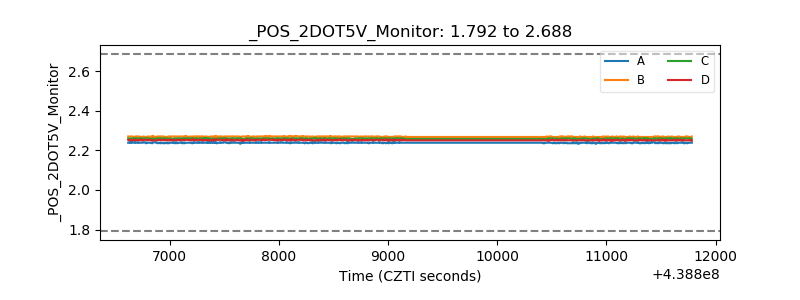 |
| +5 Volts monitor | 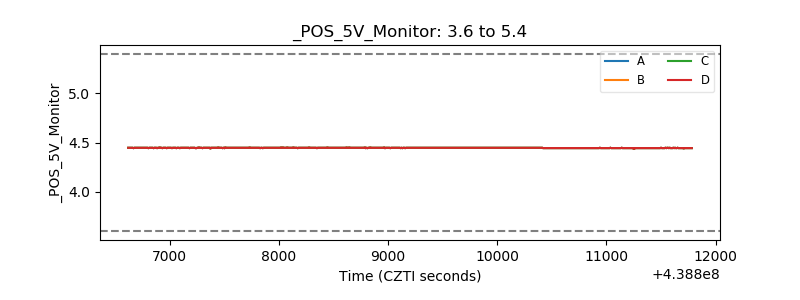 |
| _ROLL_ROT | 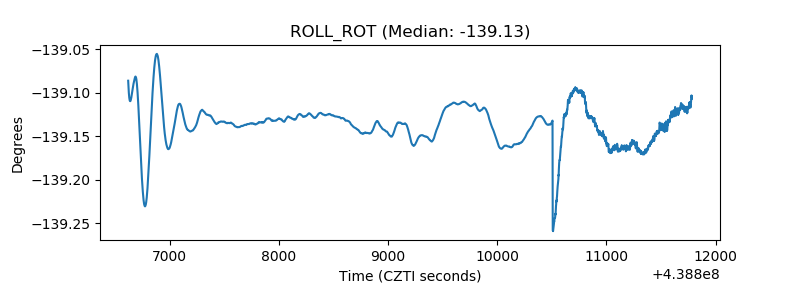 |
| _Roll_DEC | 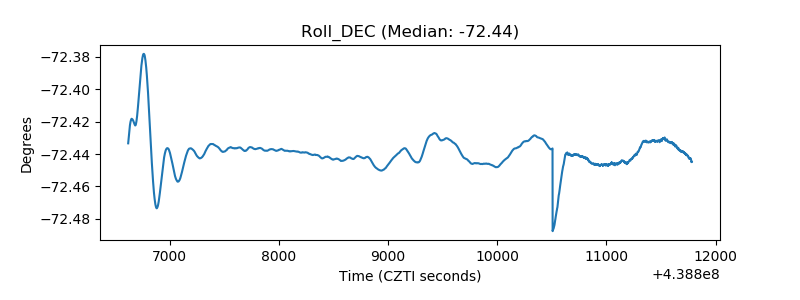 |
| _Roll_RA |  |
| Veto Counter | 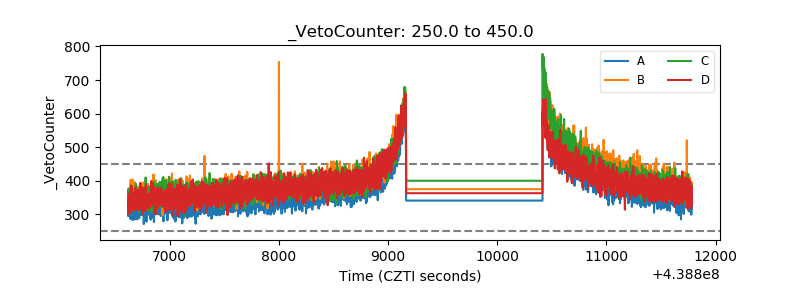 |