| Param | Original file | Final file |
|---|---|---|
| Filename | modeM0/AS1A13_080T06_9000005954_44157cztM0_level2.fits | modeM0/AS1A13_080T06_9000005954_44157cztM0_level2_quad_clean.evt |
| Size (bytes) | 519,618,240 | 104,140,800 |
| Size | 495.5 MB | 99.3 MB |
| Events in quadrant A | 5,835,496 | 687,748 |
| Events in quadrant B | 4,220,661 | 732,412 |
| Events in quadrant C | 3,194,405 | 680,640 |
| Events in quadrant D | 5,480,099 | 599,146 |
| Mode SS | |||
|---|---|---|---|
| Quadrant | BADHDUFLAG | Total packets | Discarded packets |
| A | 0 | 132 | 0 |
| B | 0 | 132 | 0 |
| C | 0 | 132 | 0 |
| D | 0 | 132 | 0 |
| Mode M0 | |||
|---|---|---|---|
| Quadrant | BADHDUFLAG | Total packets | Discarded packets |
| A | 0 | 21891 | 2 |
| B | 0 | 17035 | 2 |
| C | 0 | 14368 | 2 |
| D | 0 | 20734 | 2 |
| Mode M9 | |||
|---|---|---|---|
| Quadrant | BADHDUFLAG | Total packets | Discarded packets |
| A | 0 | 18 | 0 |
| B | 0 | 19 | 0 |
| C | 0 | 19 | 0 |
| D | 0 | 19 | 0 |
| Quadrant | Total seconds | Saturated seconds | Saturation percentage |
|---|---|---|---|
| A | 6498 | 425 | 6.540474% |
| B | 6498 | 247 | 3.801170% |
| C | 6497 | 218 | 3.355395% |
| D | 6497 | 491 | 7.557334% |
Noise dominated data is calculated using 1-second bins in cleaned event files. If a bin has >2000 counts, and if more than 50% of those come from <1% of pixels, then it is considered to be noise-dominated and hence unusable.
| Quadrant | # 1 sec bins | Bins with >0 counts | Bins with >2000 counts | High rate bins dominated by noise | Noise dominated (total time) | Noise dominated (detector-on time) | Marked lightcurve |
|---|---|---|---|---|---|---|---|
| A | 7563 | 6499 | 166 | 166 | 2.19% | 2.55% | 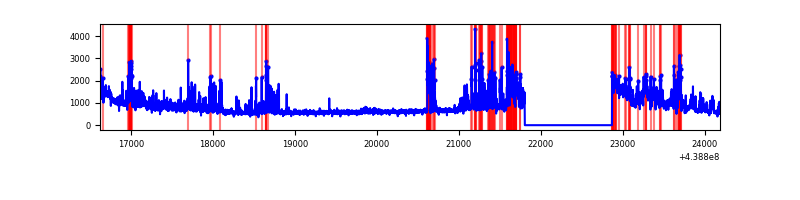 |
| B | 7563 | 6499 | 149 | 149 | 1.97% | 2.29% | 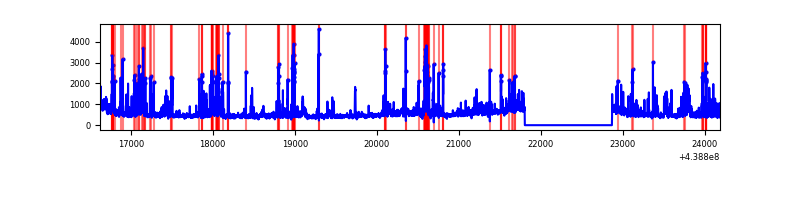 |
| C | 7562 | 6498 | 53 | 53 | 0.70% | 0.82% | 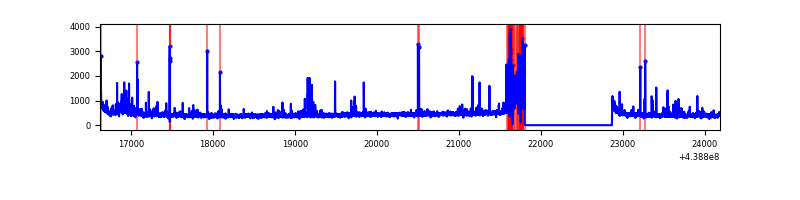 |
| D | 7562 | 6498 | 397 | 397 | 5.25% | 6.11% | 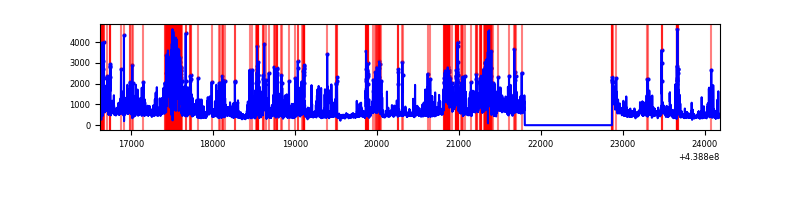 |
Top three noisy pixels from each quadrant. If the there are fewer than three noisy pixels in the level2.evt file, extra rows are filled as -1
| Pixel properties | Quadrant properties | ||||||
|---|---|---|---|---|---|---|---|
| Quadrant | DetID | PixID | Counts | Sigma | Mean | Median | Sigma |
| A | 10 | 83 | 1555143 | 10626.86 | 697 | 684 | 146.3 |
| A | 15 | 223 | 766383 | 5234.6 | 697 | 684 | 146.3 |
| A | 14 | 238 | 425824 | 2906.42 | 697 | 684 | 146.3 |
| B | 5 | 172 | 337291 | 2465.85 | 710 | 690 | 136.5 |
| B | 5 | 235 | 321923 | 2353.27 | 710 | 690 | 136.5 |
| B | 0 | 200 | 300537 | 2196.6 | 710 | 690 | 136.5 |
| C | 15 | 158 | 289439 | 1832.83 | 676 | 681 | 157.5 |
| C | 14 | 254 | 138252 | 873.2 | 676 | 681 | 157.5 |
| C | 5 | 4 | 55058 | 345.15 | 676 | 681 | 157.5 |
| D | 12 | 233 | 583170 | 3434.17 | 669 | 648 | 169.6 |
| D | 1 | 52 | 516228 | 3039.53 | 669 | 648 | 169.6 |
| D | 1 | 47 | 440455 | 2592.82 | 669 | 648 | 169.6 |
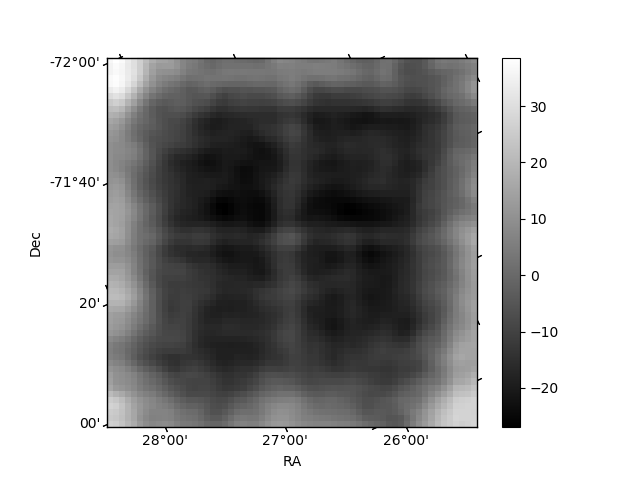
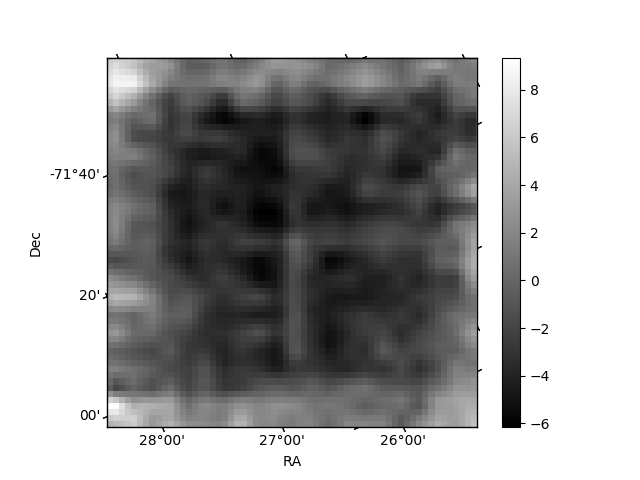
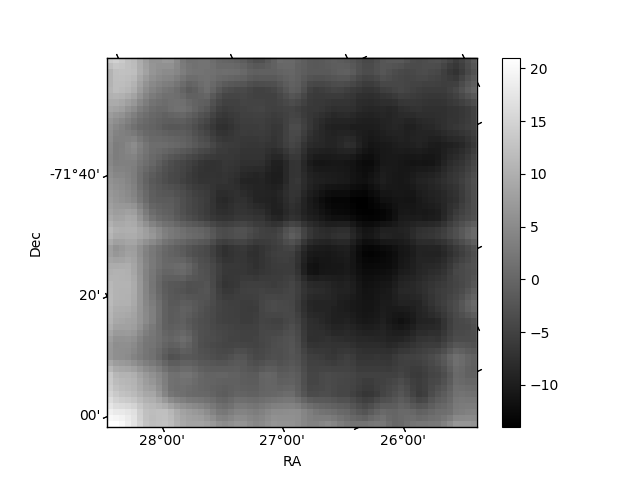
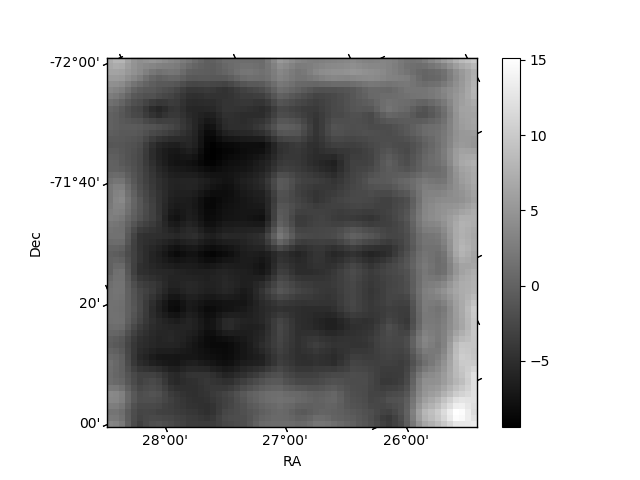
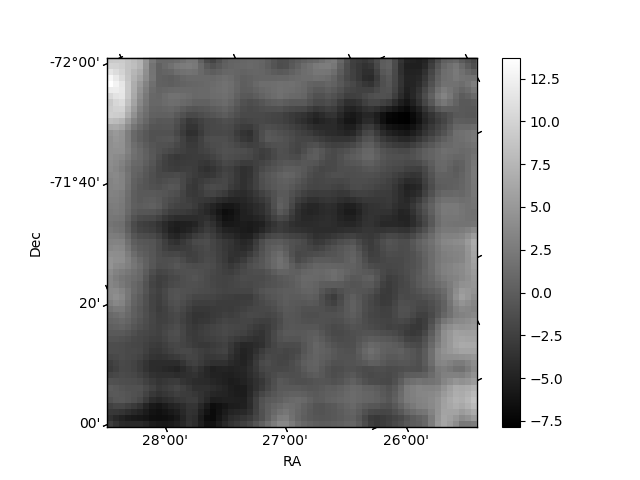
Histogram calculated using DETX and DETY for each event in the final _common_clean file
| Quadrant A | 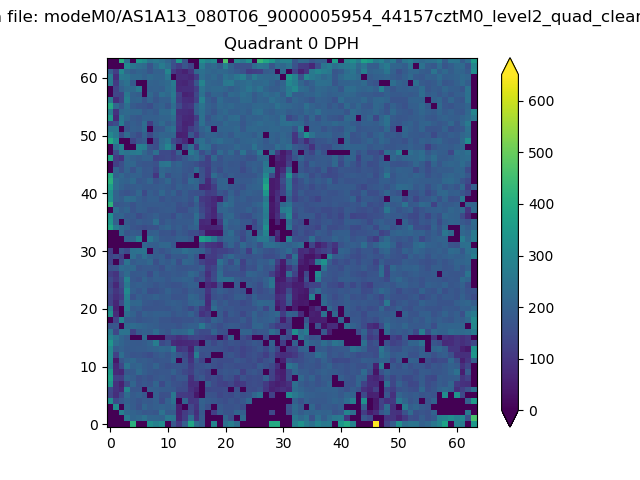 |
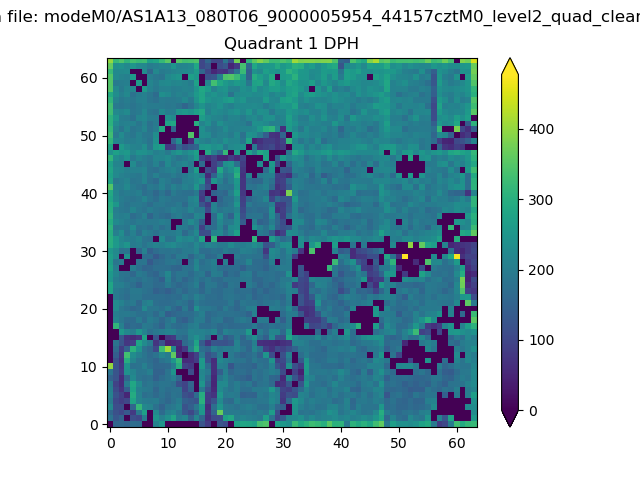 |
Quadrant B |
|---|---|---|---|
| Quadrant D |  |
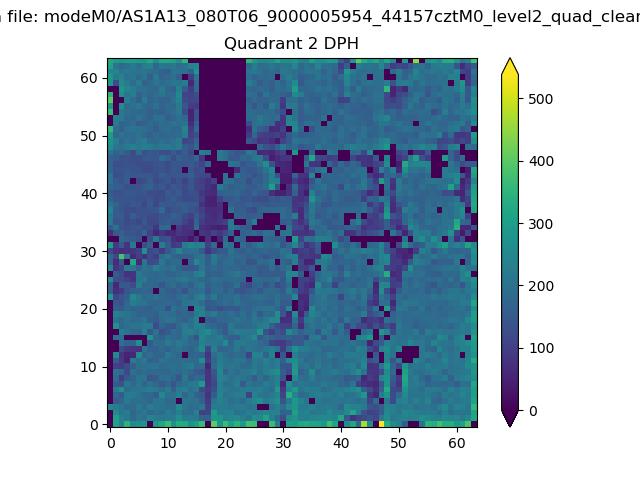 |
Quadrant C |
| Plot type | Count rate plots | Images |
|---|---|---|
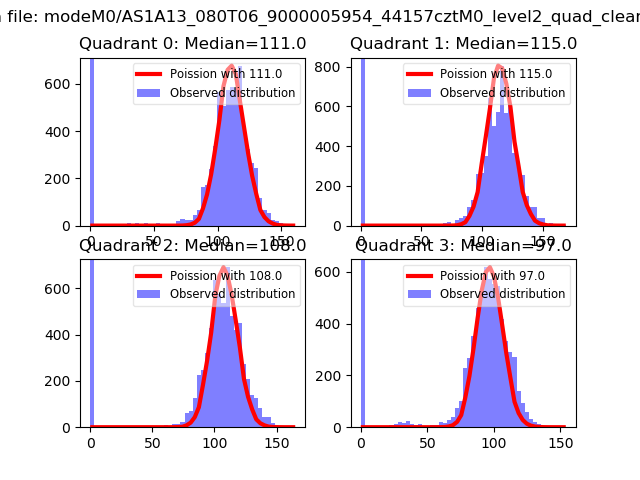
| Comparison with Poisson distribution Blue bars denote a histogram of data divided into 1 sec bins. Red curve is a Poisson curve with rate = median count rate of data. |
 |
 |
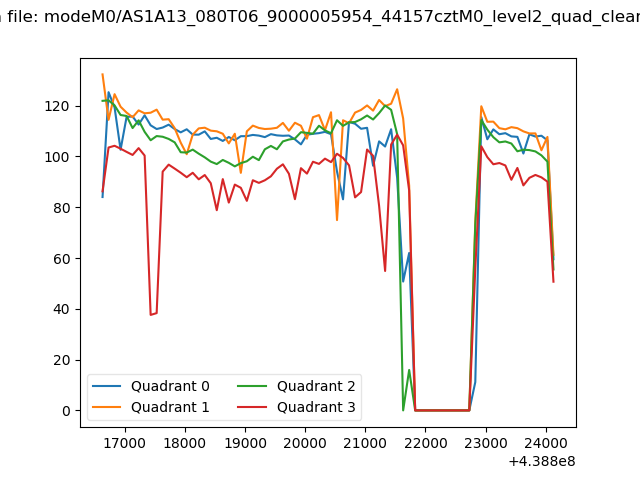
| Quadrant-wise count rates Data is divided into 100 sec bins |
 |
|
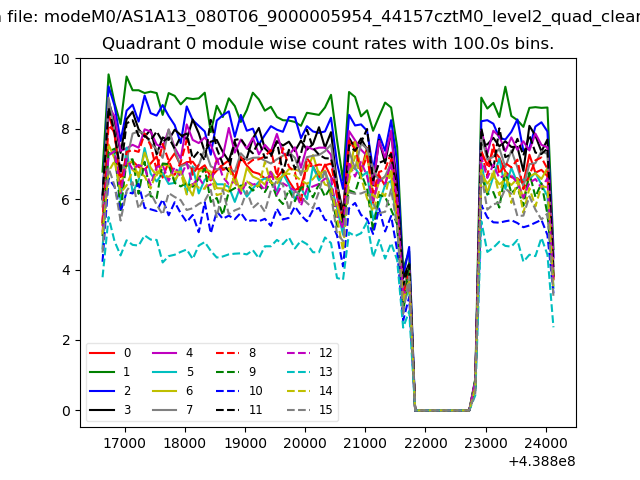
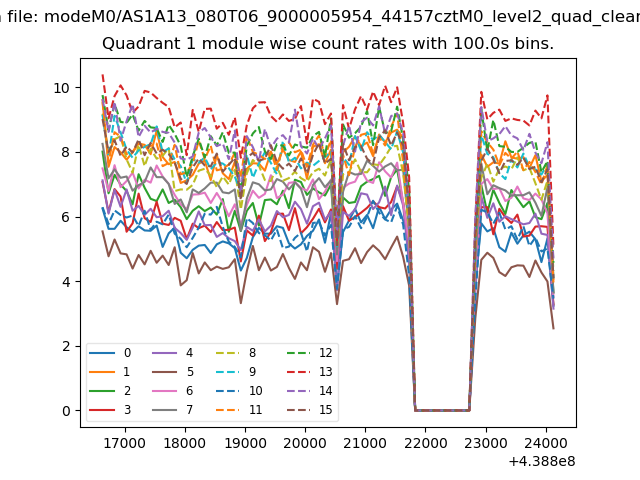
| Module-wise count rates for Quadrant A Data is divided into 100 sec bins |
 |
 |
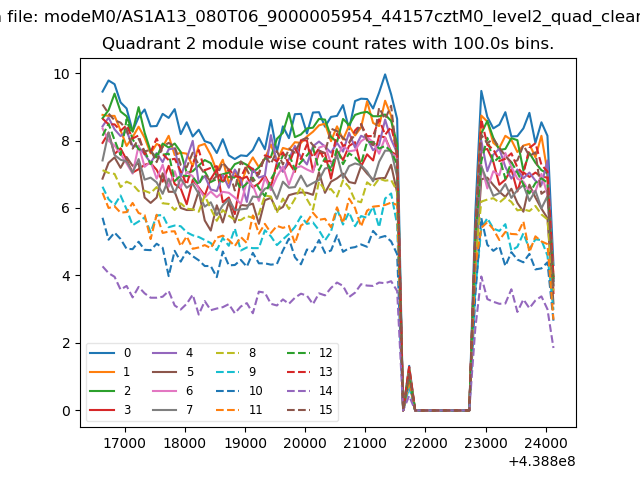
| Module-wise count rates for Quadrant B Data is divided into 100 sec bins |
 |
 |
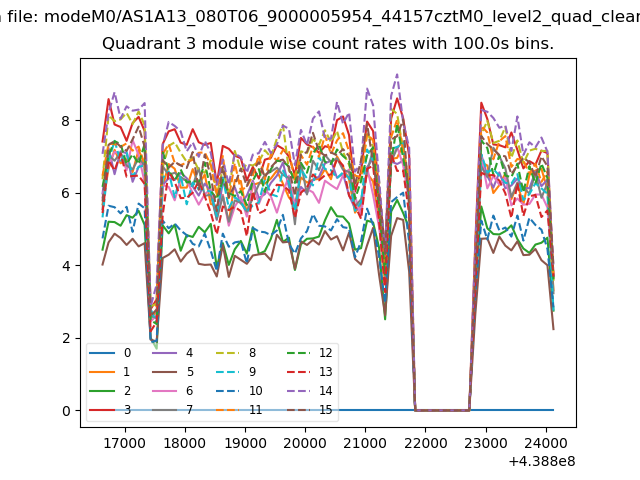
| Module-wise count rates for Quadrant C Data is divided into 100 sec bins |
 |
 |
| Module-wise count rates for Quadrant D Data is divided into 100 sec bins |
 |
 |
| Parameter | Plot |
|---|---|
| CZT HV Monitor | 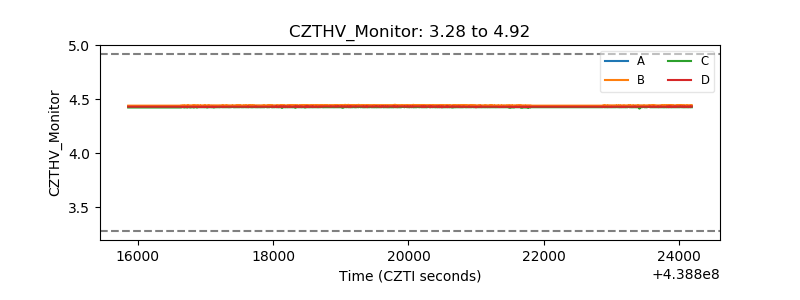 |
| D_VDD | 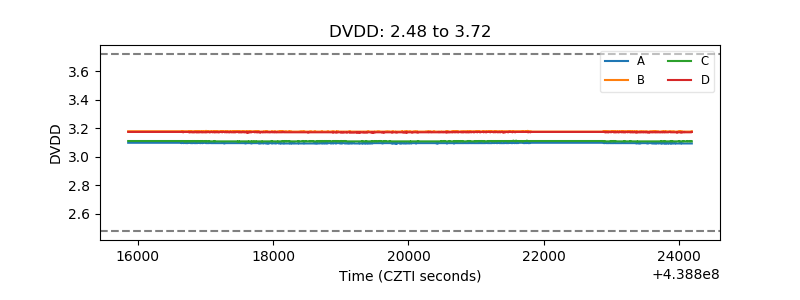 |
| Temperature 1 | 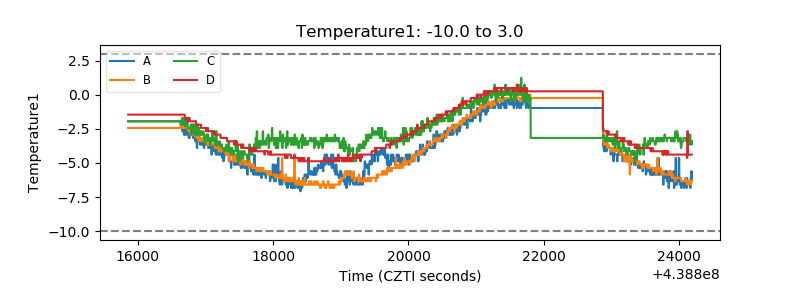 |
| Veto HV Monitor | 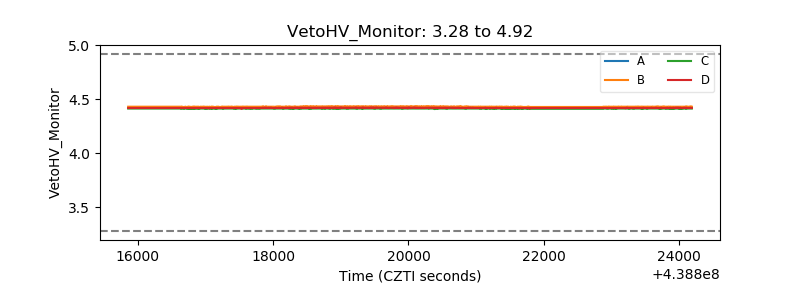 |
| Veto LLD | 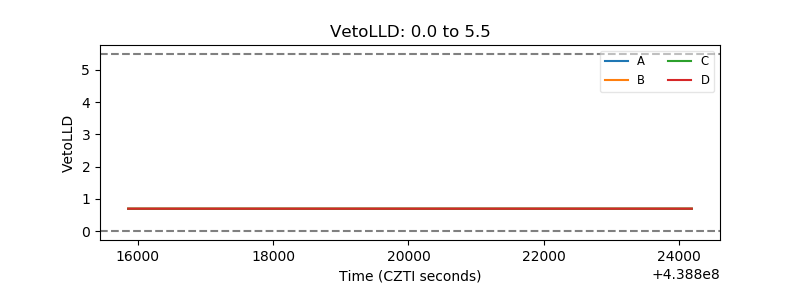 |
| Alpha Counter | 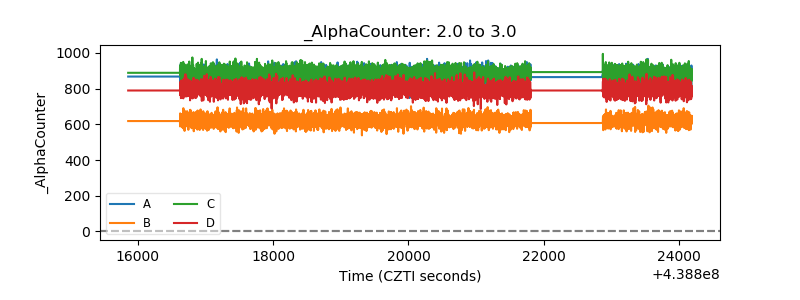 |
| _CPM_Rate | 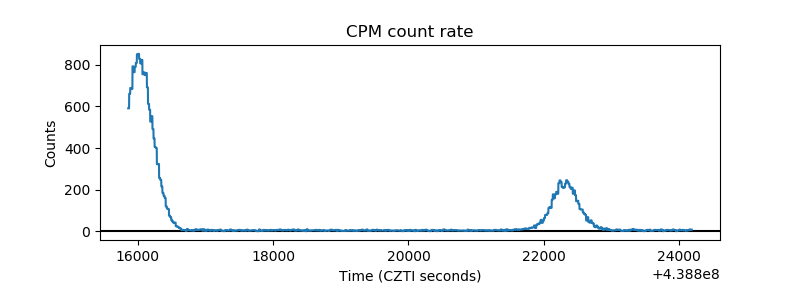 |
| CZT Counter | 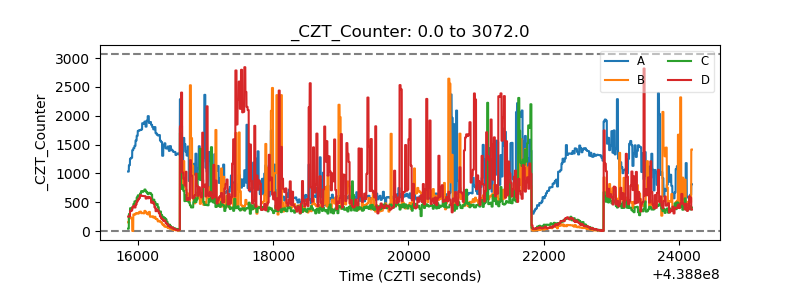 |
| +2.5 Volts monitor | 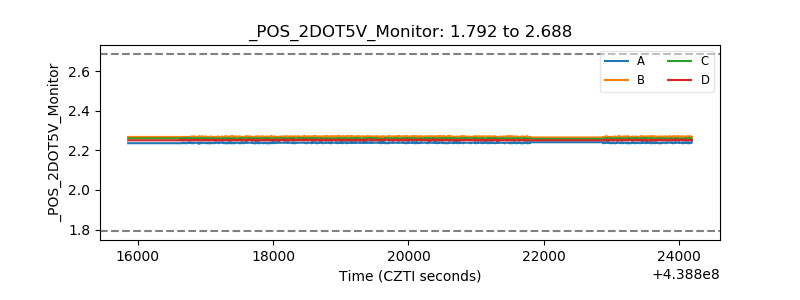 |
| +5 Volts monitor | 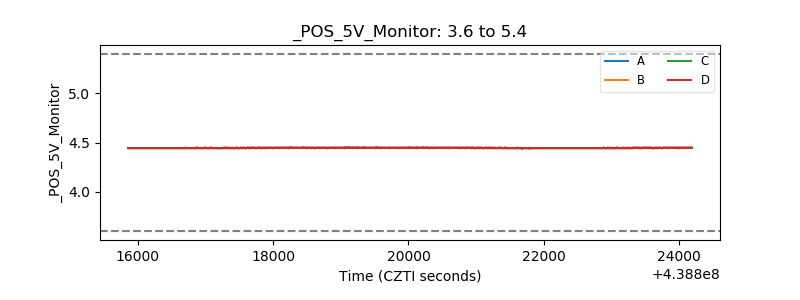 |
| _ROLL_ROT | 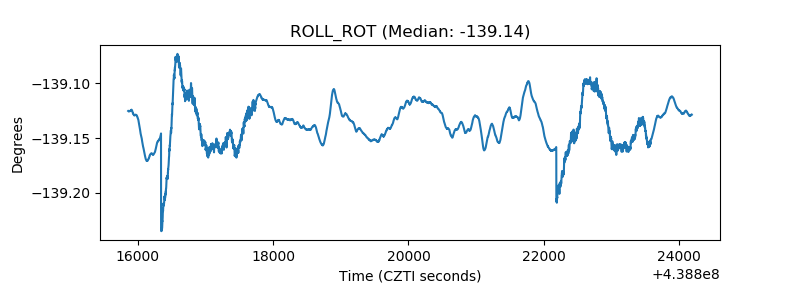 |
| _Roll_DEC | 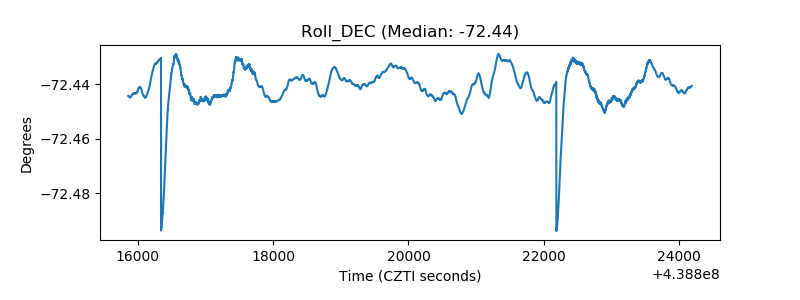 |
| _Roll_RA | 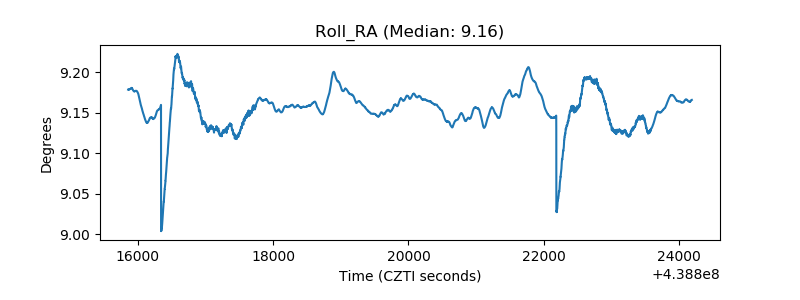 |
| Veto Counter | 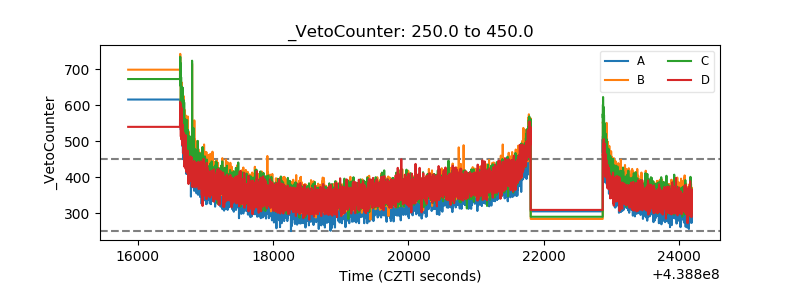 |