| Param | Original file | Final file |
|---|---|---|
| Filename | modeM0/AS1A13_080T06_9000005954_44160cztM0_level2.fits | modeM0/AS1A13_080T06_9000005954_44160cztM0_level2_quad_clean.evt |
| Size (bytes) | 668,301,120 | 111,378,240 |
| Size | 637.3 MB | 106.2 MB |
| Events in quadrant A | 9,317,924 | 645,985 |
| Events in quadrant B | 5,458,022 | 781,940 |
| Events in quadrant C | 4,253,537 | 738,682 |
| Events in quadrant D | 5,123,436 | 679,687 |
| Mode SS | |||
|---|---|---|---|
| Quadrant | BADHDUFLAG | Total packets | Discarded packets |
| A | 0 | 152 | 0 |
| B | 0 | 152 | 0 |
| C | 0 | 152 | 0 |
| D | 0 | 152 | 0 |
| Mode M0 | |||
|---|---|---|---|
| Quadrant | BADHDUFLAG | Total packets | Discarded packets |
| A | 0 | 33231 | 0 |
| B | 0 | 21401 | 0 |
| C | 0 | 18291 | 0 |
| D | 0 | 20372 | 0 |
| Quadrant | Total seconds | Saturated seconds | Saturation percentage |
|---|---|---|---|
| A | 7552 | 1629 | 21.570445% |
| B | 7552 | 480 | 6.355932% |
| C | 7552 | 368 | 4.872881% |
| D | 7552 | 322 | 4.263771% |
Noise dominated data is calculated using 1-second bins in cleaned event files. If a bin has >2000 counts, and if more than 50% of those come from <1% of pixels, then it is considered to be noise-dominated and hence unusable.
| Quadrant | # 1 sec bins | Bins with >0 counts | Bins with >2000 counts | High rate bins dominated by noise | Noise dominated (total time) | Noise dominated (detector-on time) | Marked lightcurve |
|---|---|---|---|---|---|---|---|
| A | 7552 | 7552 | 1079 | 1079 | 14.29% | 14.29% | 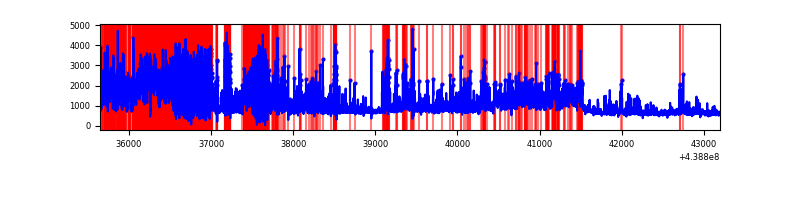 |
| B | 7552 | 7552 | 306 | 306 | 4.05% | 4.05% | 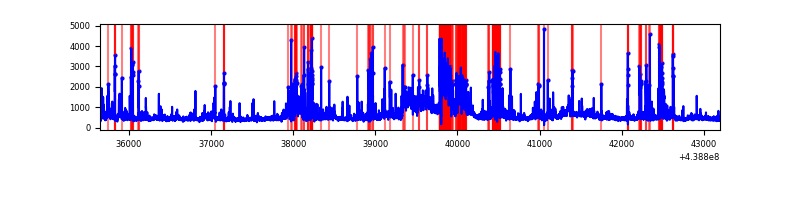 |
| C | 7552 | 7552 | 260 | 260 | 3.44% | 3.44% | 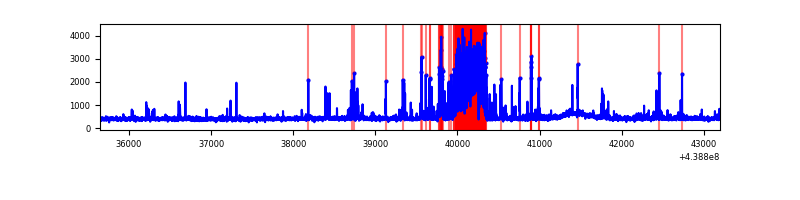 |
| D | 7552 | 7552 | 267 | 267 | 3.54% | 3.54% | 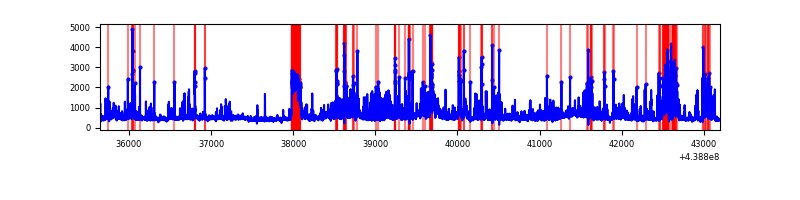 |
Top three noisy pixels from each quadrant. If the there are fewer than three noisy pixels in the level2.evt file, extra rows are filled as -1
| Pixel properties | Quadrant properties | ||||||
|---|---|---|---|---|---|---|---|
| Quadrant | DetID | PixID | Counts | Sigma | Mean | Median | Sigma |
| A | 15 | 223 | 4924119 | 31457.05 | 740 | 723 | 156.5 |
| A | 10 | 83 | 1342847 | 8575.23 | 740 | 723 | 156.5 |
| A | 13 | 248 | 82358 | 521.59 | 740 | 723 | 156.5 |
| B | 15 | 219 | 724018 | 4687.39 | 797 | 772 | 154.3 |
| B | 0 | 219 | 495073 | 3203.59 | 797 | 772 | 154.3 |
| B | 5 | 172 | 399471 | 2583.99 | 797 | 772 | 154.3 |
| C | 15 | 158 | 978661 | 5325.0 | 782 | 785 | 183.6 |
| C | 14 | 254 | 175730 | 952.66 | 782 | 785 | 183.6 |
| C | 4 | 254 | 13789 | 70.81 | 782 | 785 | 183.6 |
| D | 4 | 235 | 425984 | 2158.71 | 782 | 756 | 197.0 |
| D | 13 | 171 | 329836 | 1670.61 | 782 | 756 | 197.0 |
| D | 1 | 47 | 152408 | 769.88 | 782 | 756 | 197.0 |
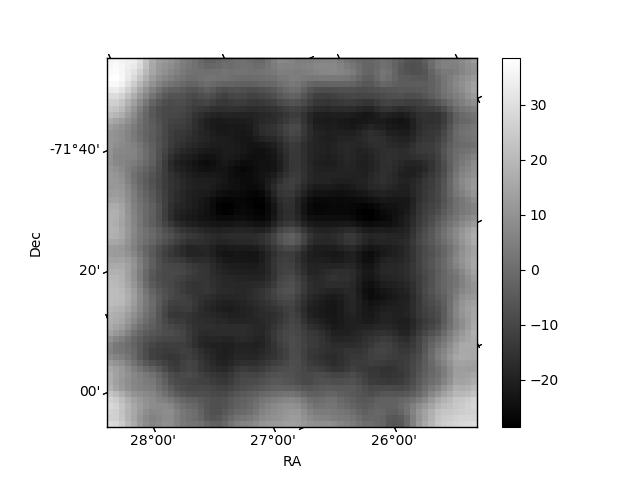
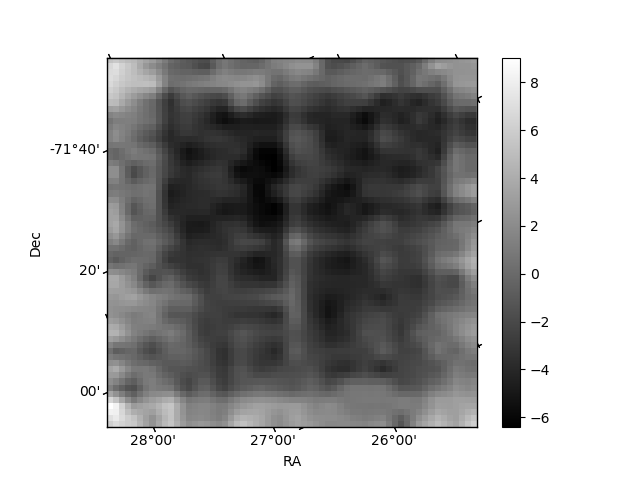
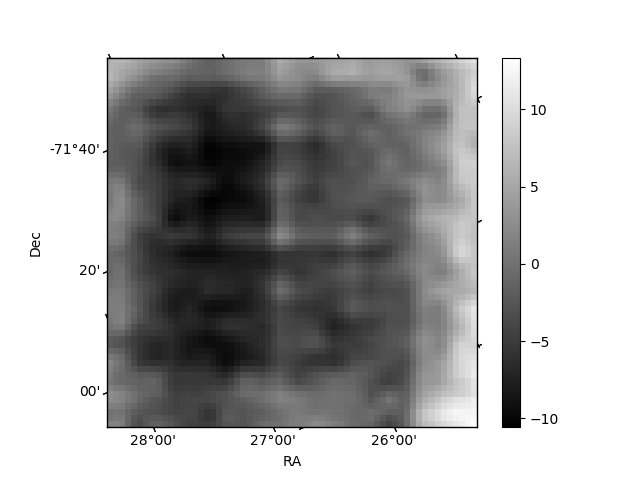
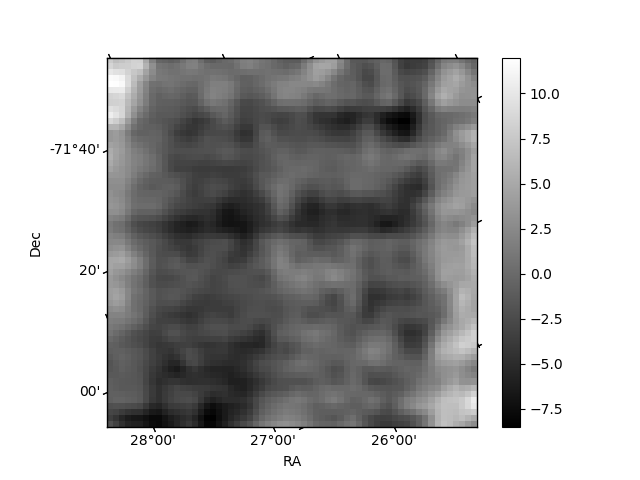
Histogram calculated using DETX and DETY for each event in the final _common_clean file
| Quadrant A | 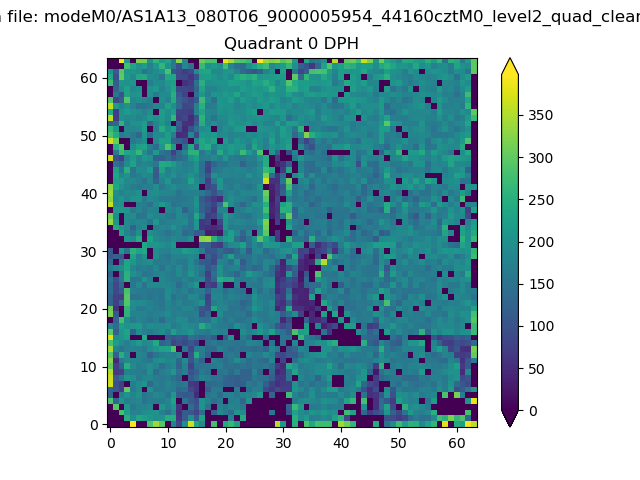 |
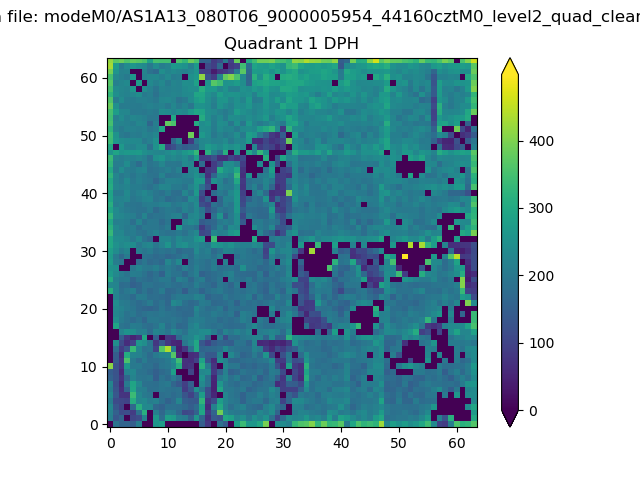 |
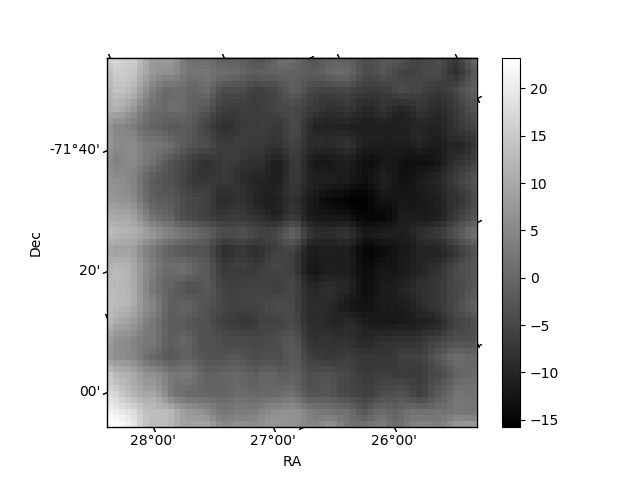
Quadrant B |
|---|---|---|---|
| Quadrant D | 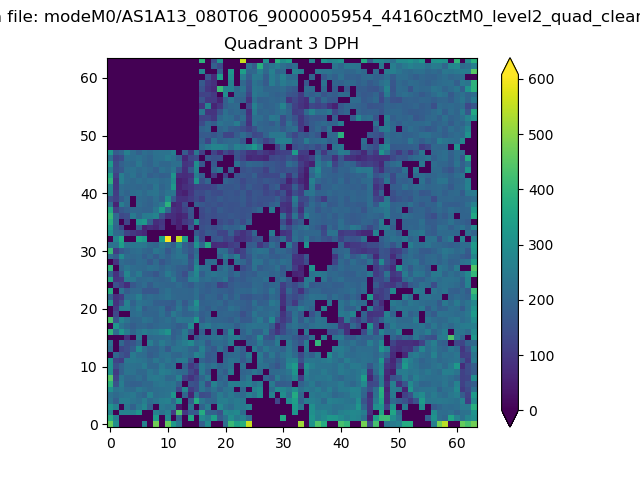 |
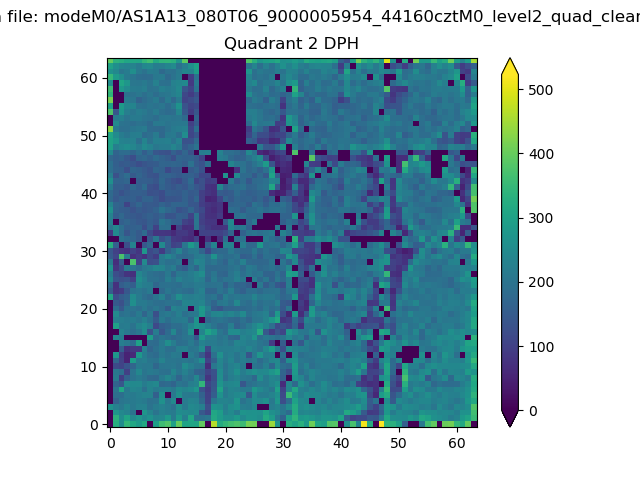 |
Quadrant C |
| Plot type | Count rate plots | Images |
|---|---|---|
| Comparison with Poisson distribution Blue bars denote a histogram of data divided into 1 sec bins. Red curve is a Poisson curve with rate = median count rate of data. |
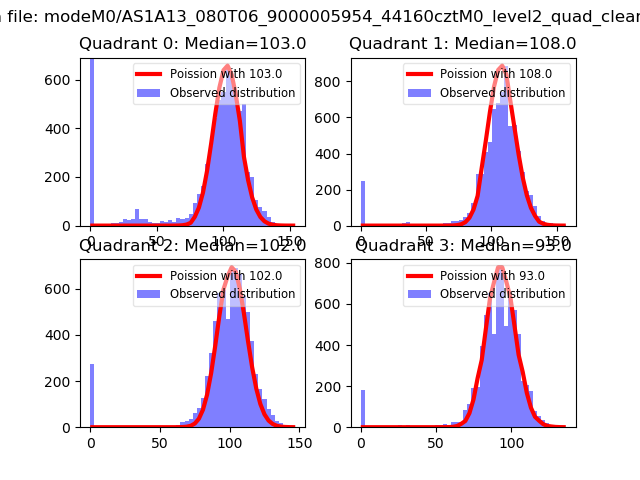 |
 |
| Quadrant-wise count rates Data is divided into 100 sec bins |
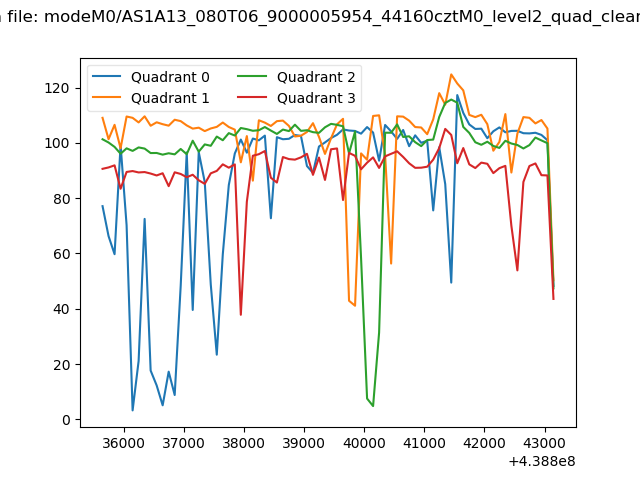 |
|
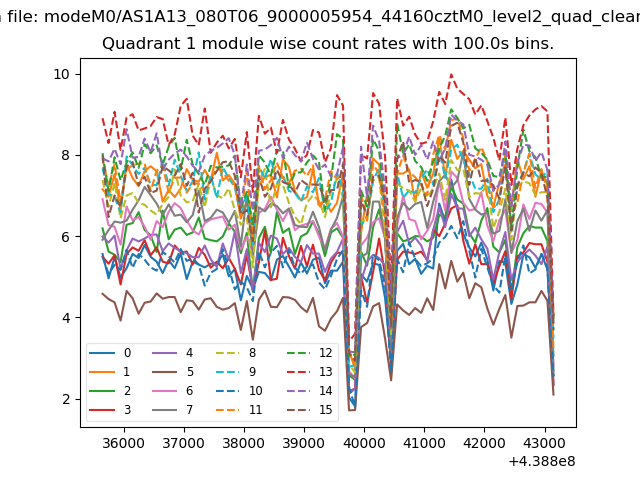
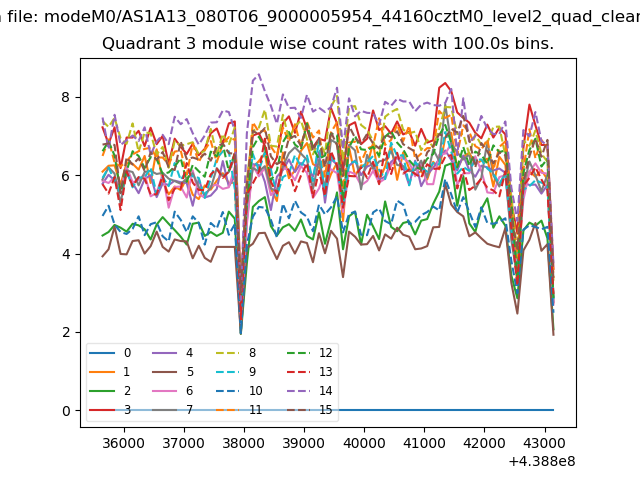
| Module-wise count rates for Quadrant A Data is divided into 100 sec bins |
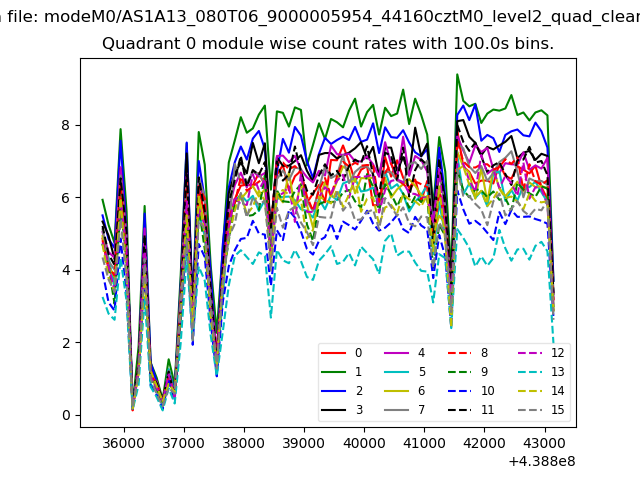 |
 |
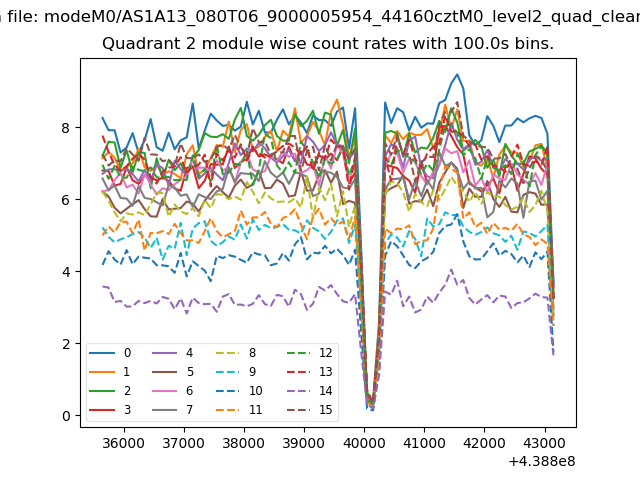
| Module-wise count rates for Quadrant B Data is divided into 100 sec bins |
 |
 |
| Module-wise count rates for Quadrant C Data is divided into 100 sec bins |
 |
 |
| Module-wise count rates for Quadrant D Data is divided into 100 sec bins |
 |
 |
| Parameter | Plot |
|---|---|
| CZT HV Monitor | 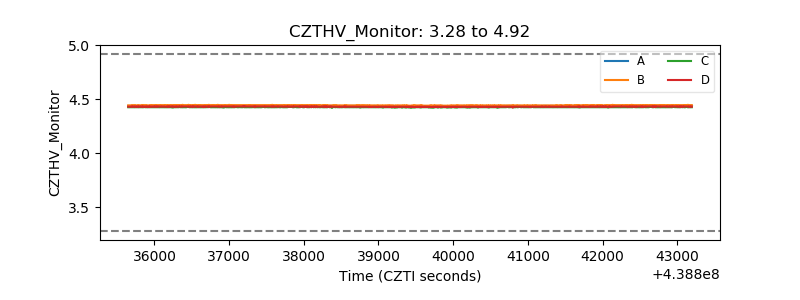 |
| D_VDD | 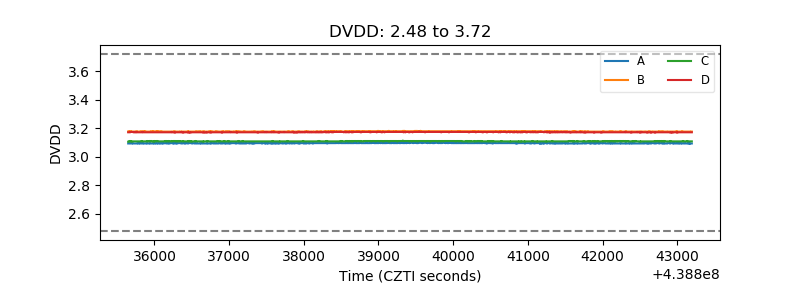 |
| Temperature 1 | 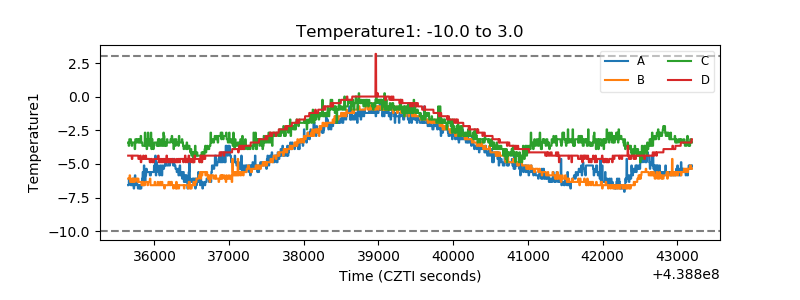 |
| Veto HV Monitor | 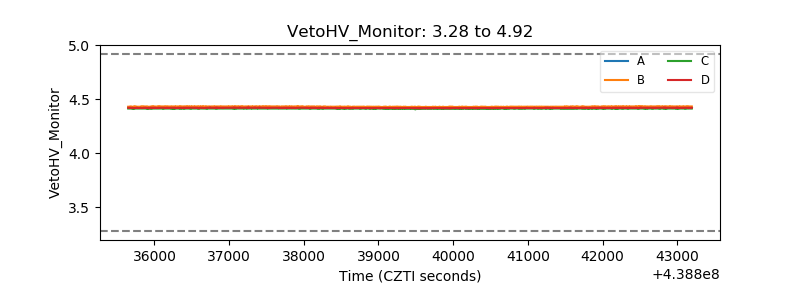 |
| Veto LLD | 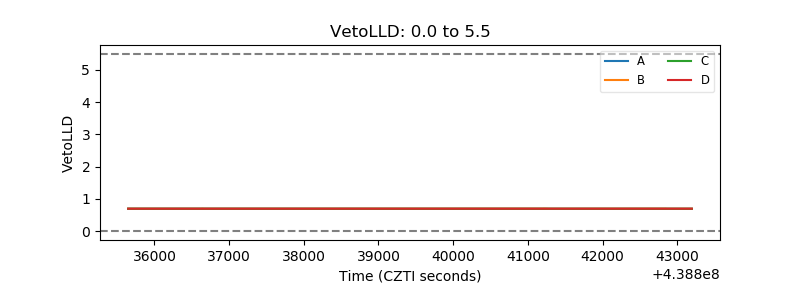 |
| Alpha Counter | 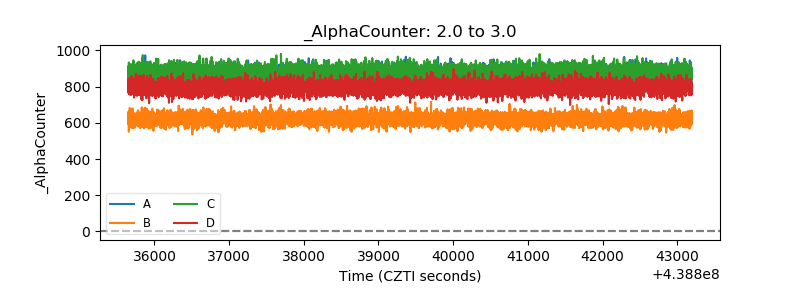 |
| _CPM_Rate | 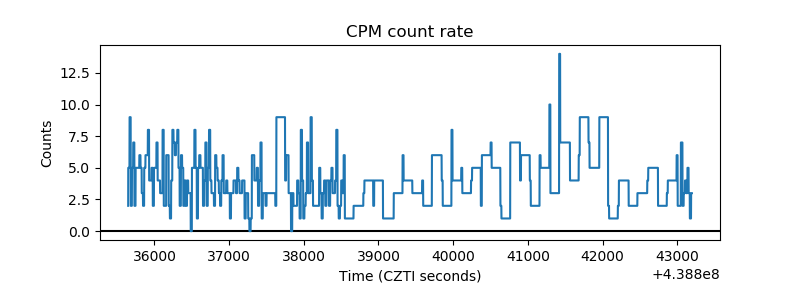 |
| CZT Counter | 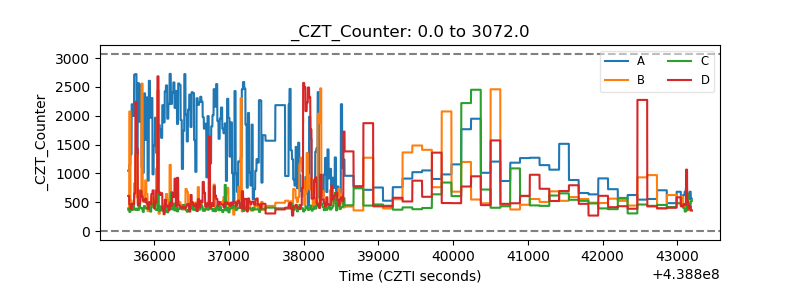 |
| +2.5 Volts monitor | 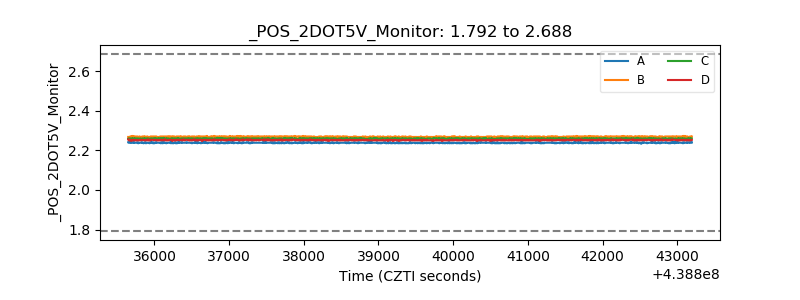 |
| +5 Volts monitor | 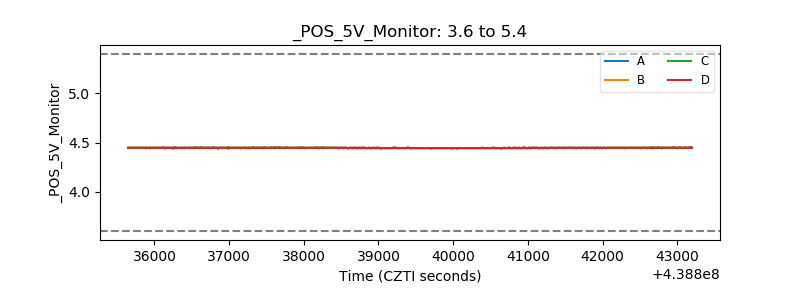 |
| _ROLL_ROT | 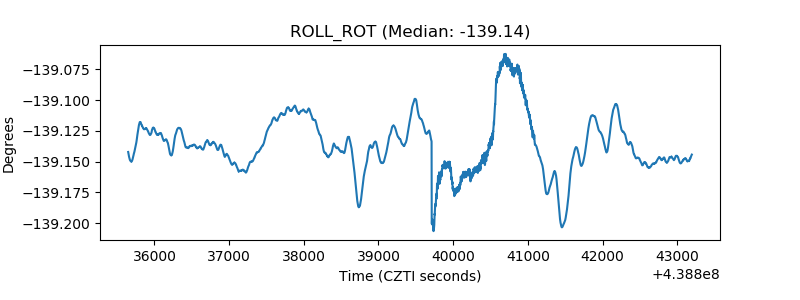 |
| _Roll_DEC | 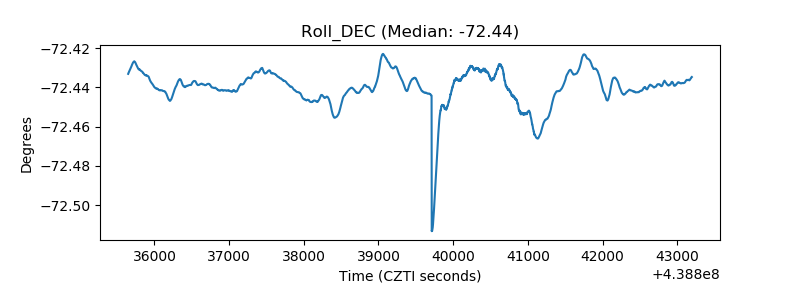 |
| _Roll_RA | 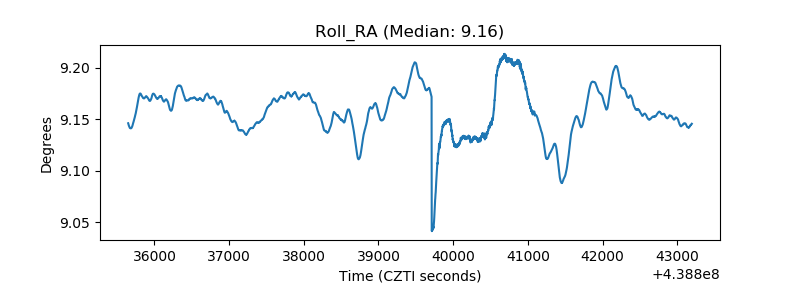 |
| Veto Counter | 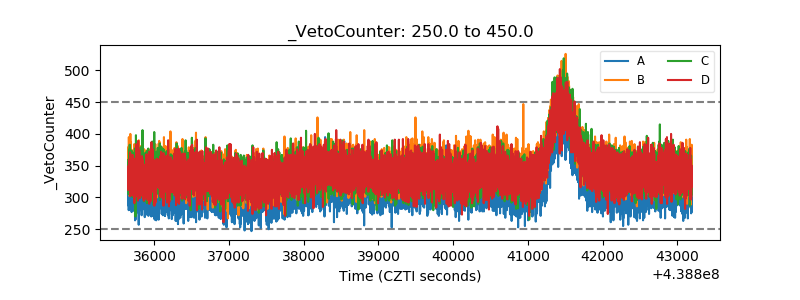 |