| Param | Original file | Final file |
|---|---|---|
| Filename | modeM0/AS1A13_080T06_9000005954_44163cztM0_level2.fits | modeM0/AS1A13_080T06_9000005954_44163cztM0_level2_quad_clean.evt |
| Size (bytes) | 816,431,040 | 145,779,840 |
| Size | 778.6 MB | 139.0 MB |
| Events in quadrant A | 11,609,375 | 850,008 |
| Events in quadrant B | 6,497,278 | 1,007,922 |
| Events in quadrant C | 4,729,716 | 997,857 |
| Events in quadrant D | 6,622,077 | 874,564 |
| Mode SS | |||
|---|---|---|---|
| Quadrant | BADHDUFLAG | Total packets | Discarded packets |
| A | 0 | 198 | 0 |
| B | 0 | 198 | 0 |
| C | 0 | 198 | 0 |
| D | 0 | 198 | 0 |
| Mode M0 | |||
|---|---|---|---|
| Quadrant | BADHDUFLAG | Total packets | Discarded packets |
| A | 0 | 41756 | 1 |
| B | 0 | 25925 | 1 |
| C | 0 | 21551 | 1 |
| D | 0 | 26518 | 2 |
| Mode M9 | |||
|---|---|---|---|
| Quadrant | BADHDUFLAG | Total packets | Discarded packets |
| A | 0 | 3 | 0 |
| B | 0 | 3 | 0 |
| C | 0 | 3 | 0 |
| D | 0 | 3 | 0 |
| Quadrant | Total seconds | Saturated seconds | Saturation percentage |
|---|---|---|---|
| A | 9856 | 1934 | 19.622565% |
| B | 9857 | 487 | 4.940651% |
| C | 9857 | 214 | 2.171046% |
| D | 9856 | 599 | 6.077516% |
Noise dominated data is calculated using 1-second bins in cleaned event files. If a bin has >2000 counts, and if more than 50% of those come from <1% of pixels, then it is considered to be noise-dominated and hence unusable.
| Quadrant | # 1 sec bins | Bins with >0 counts | Bins with >2000 counts | High rate bins dominated by noise | Noise dominated (total time) | Noise dominated (detector-on time) | Marked lightcurve |
|---|---|---|---|---|---|---|---|
| A | 10136 | 9857 | 1522 | 1522 | 15.02% | 15.44% | 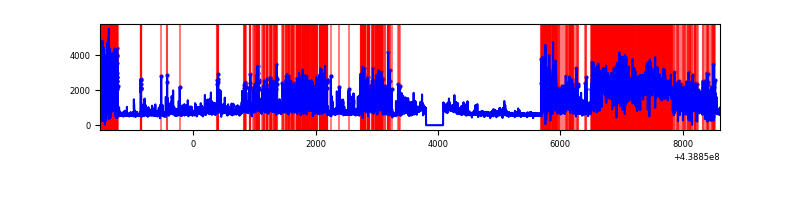 |
| B | 10137 | 9858 | 197 | 197 | 1.94% | 2.00% | 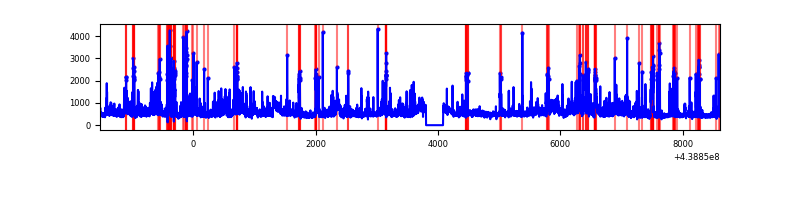 |
| C | 10137 | 9858 | 95 | 95 | 0.94% | 0.96% | 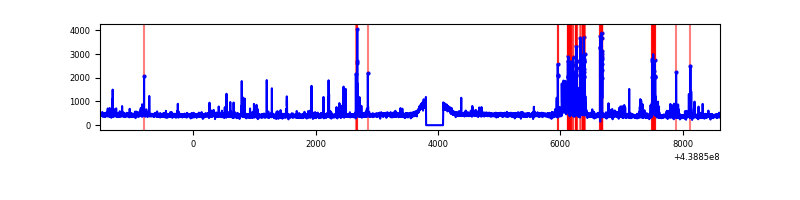 |
| D | 10136 | 9857 | 406 | 406 | 4.01% | 4.12% | 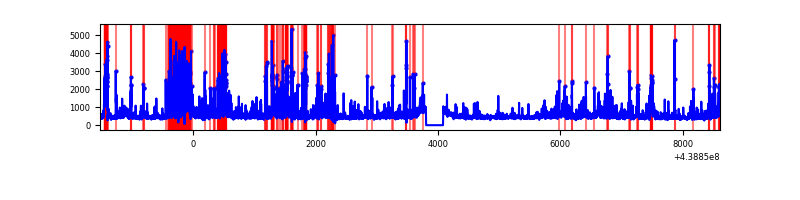 |
Top three noisy pixels from each quadrant. If the there are fewer than three noisy pixels in the level2.evt file, extra rows are filled as -1
| Pixel properties | Quadrant properties | ||||||
|---|---|---|---|---|---|---|---|
| Quadrant | DetID | PixID | Counts | Sigma | Mean | Median | Sigma |
| A | 15 | 223 | 5699334 | 27565.59 | 997 | 976 | 206.7 |
| A | 10 | 83 | 1912791 | 9248.33 | 997 | 976 | 206.7 |
| A | 7 | 3 | 64137 | 305.54 | 997 | 976 | 206.7 |
| B | 5 | 172 | 390853 | 1922.66 | 1046 | 1011 | 202.8 |
| B | 15 | 219 | 384159 | 1889.64 | 1046 | 1011 | 202.8 |
| B | 5 | 235 | 380631 | 1872.24 | 1046 | 1011 | 202.8 |
| C | 14 | 254 | 592591 | 2455.98 | 1035 | 1042 | 240.9 |
| C | 15 | 157 | 21587 | 85.3 | 1035 | 1042 | 240.9 |
| C | 14 | 96 | 19387 | 76.16 | 1035 | 1042 | 240.9 |
| D | 13 | 249 | 678950 | 2629.46 | 1017 | 982 | 257.8 |
| D | 4 | 235 | 307045 | 1187.05 | 1017 | 982 | 257.8 |
| D | 12 | 233 | 238784 | 922.3 | 1017 | 982 | 257.8 |
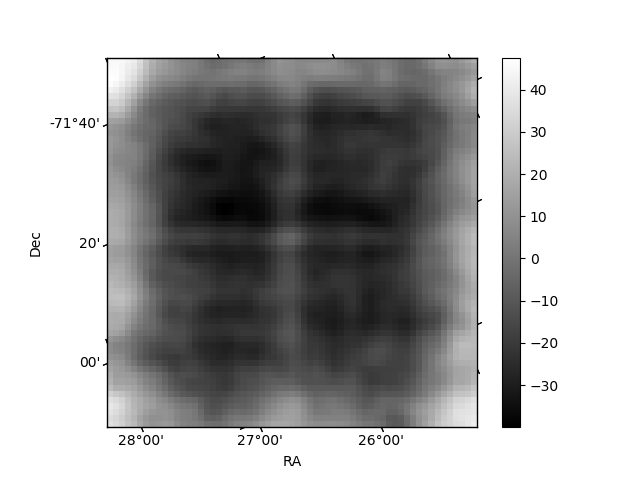
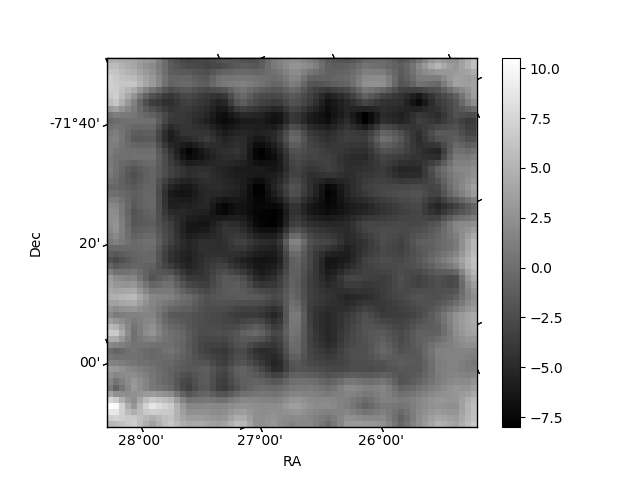
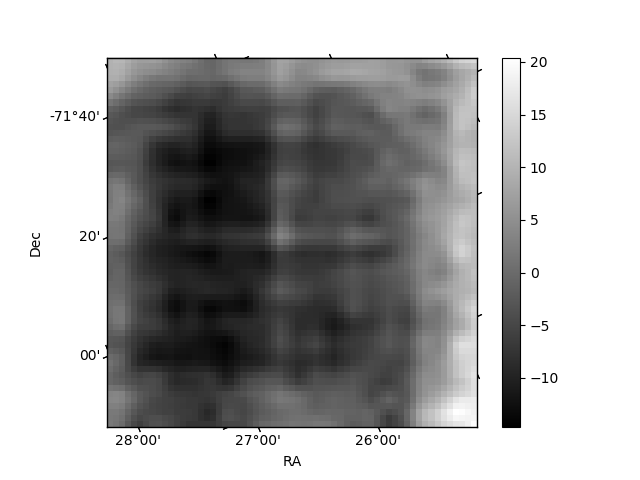
Histogram calculated using DETX and DETY for each event in the final _common_clean file
| Quadrant A | 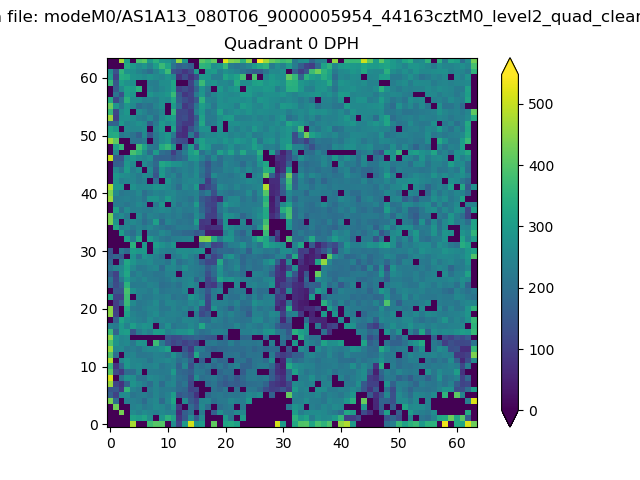 |
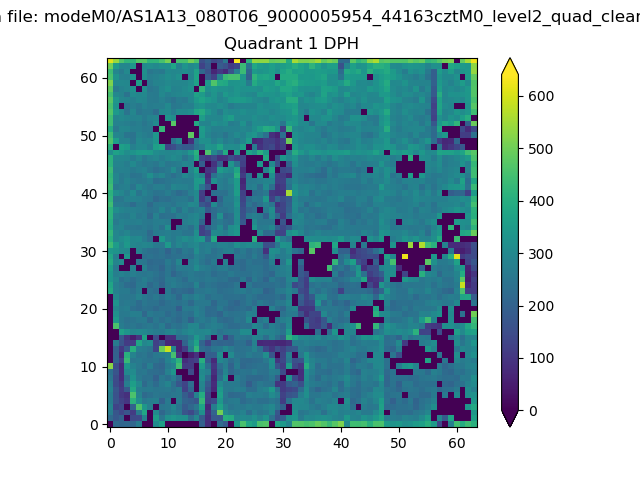 |
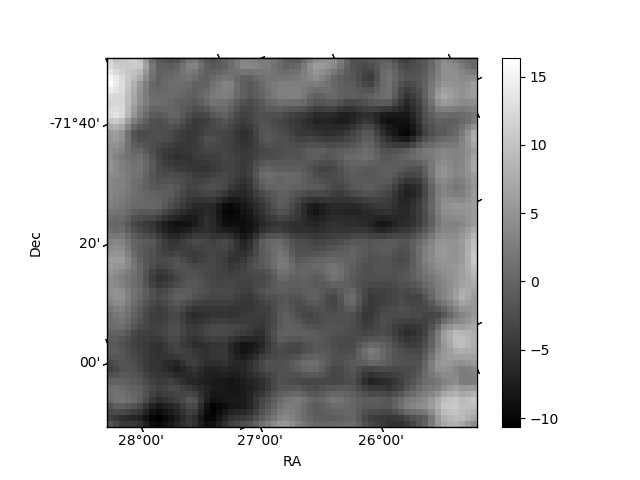
Quadrant B |
|---|---|---|---|
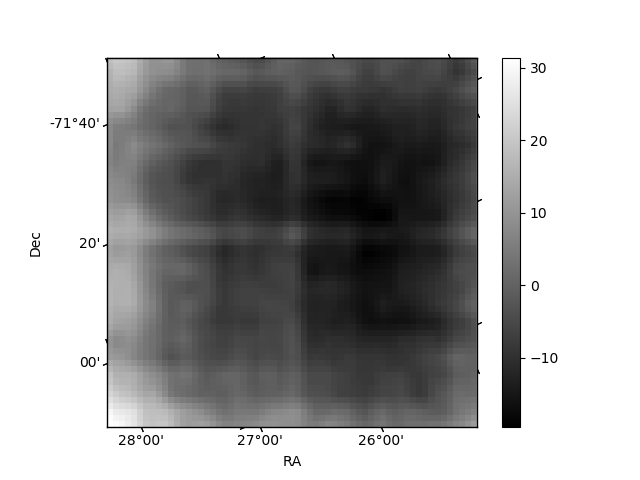
| Quadrant D | 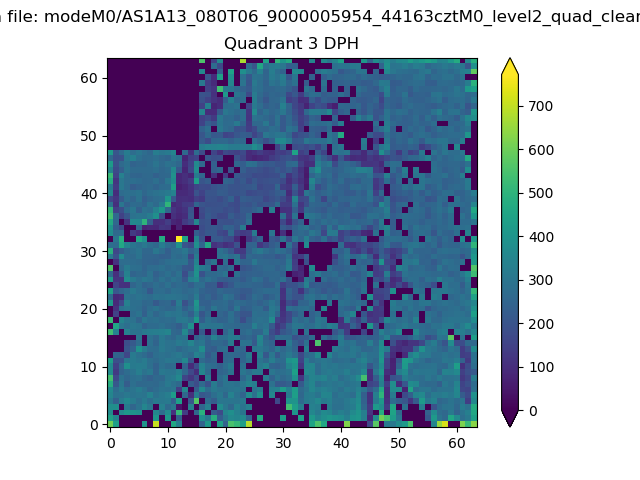 |
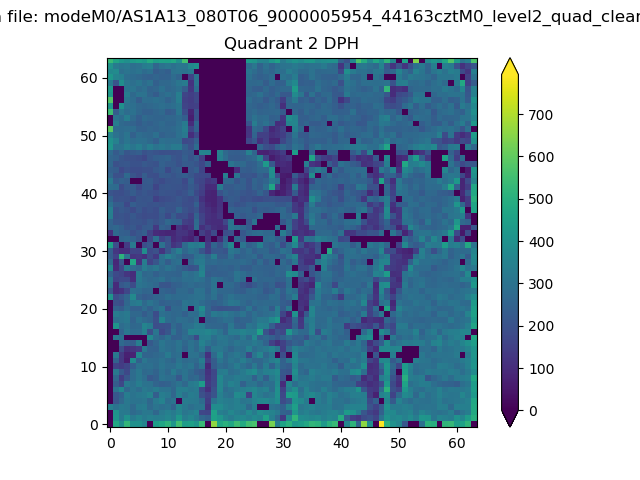 |
Quadrant C |
| Plot type | Count rate plots | Images |
|---|---|---|
| Comparison with Poisson distribution Blue bars denote a histogram of data divided into 1 sec bins. Red curve is a Poisson curve with rate = median count rate of data. |
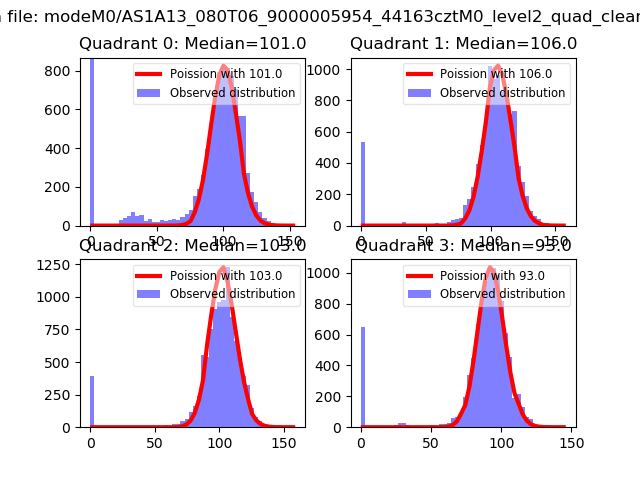 |
 |
| Quadrant-wise count rates Data is divided into 100 sec bins |
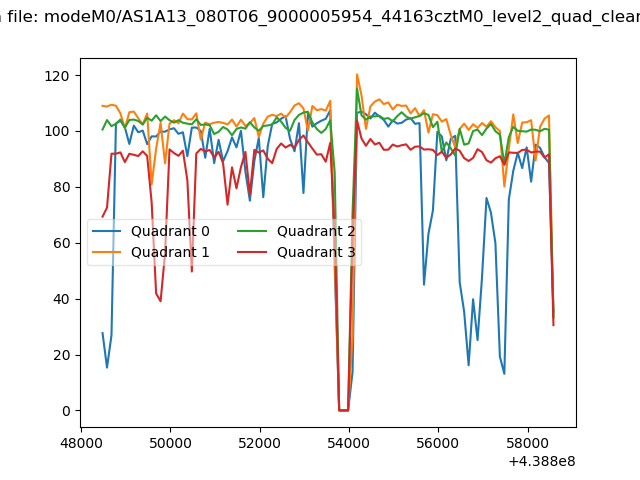 |
|
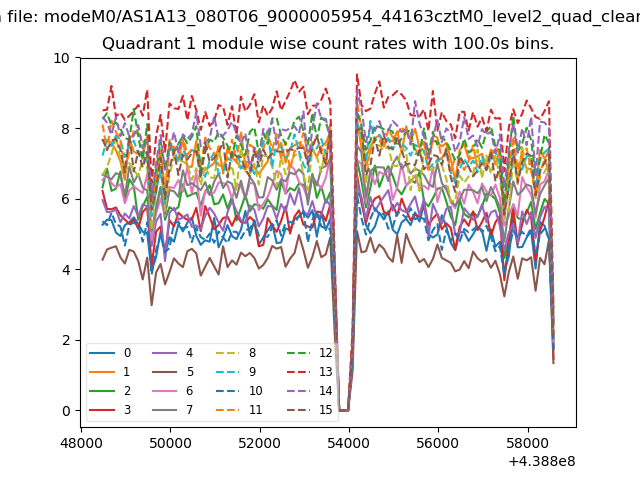
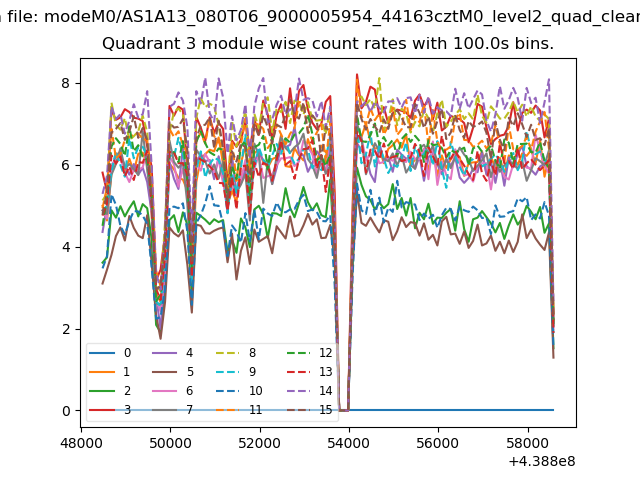
| Module-wise count rates for Quadrant A Data is divided into 100 sec bins |
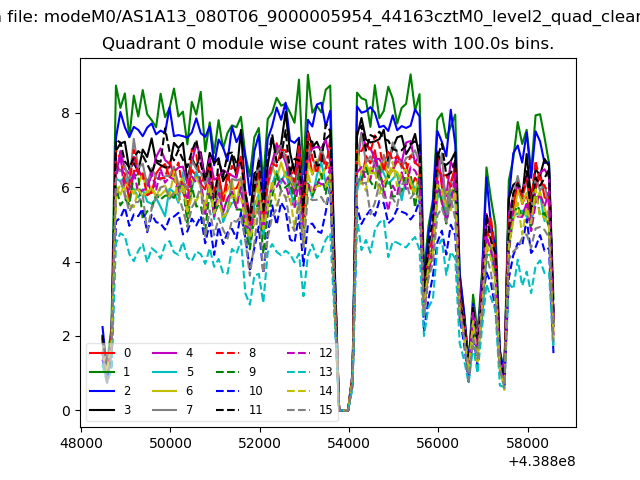 |
 |
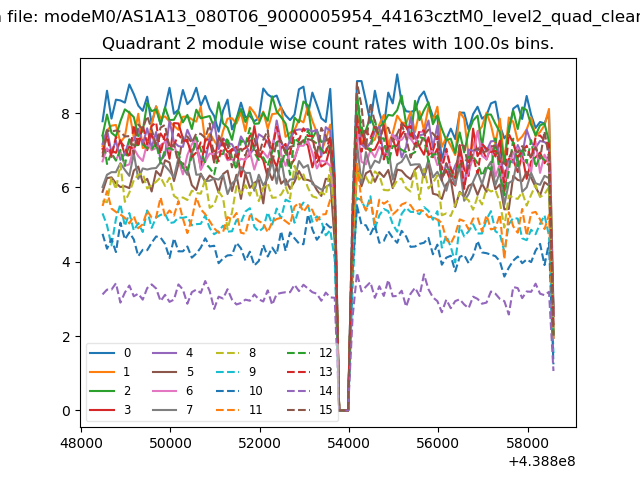
| Module-wise count rates for Quadrant B Data is divided into 100 sec bins |
 |
 |
| Module-wise count rates for Quadrant C Data is divided into 100 sec bins |
 |
 |
| Module-wise count rates for Quadrant D Data is divided into 100 sec bins |
 |
 |
| Parameter | Plot |
|---|---|
| CZT HV Monitor | 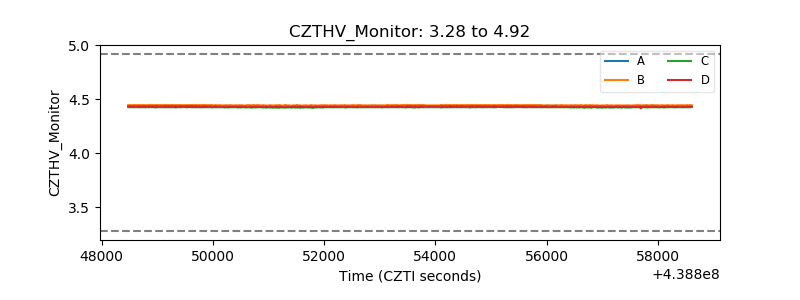 |
| D_VDD | 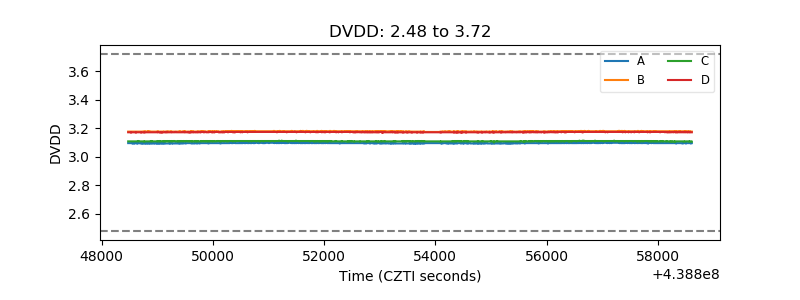 |
| Temperature 1 | 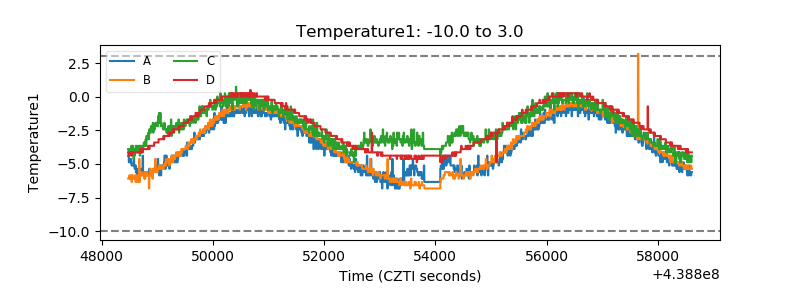 |
| Veto HV Monitor | 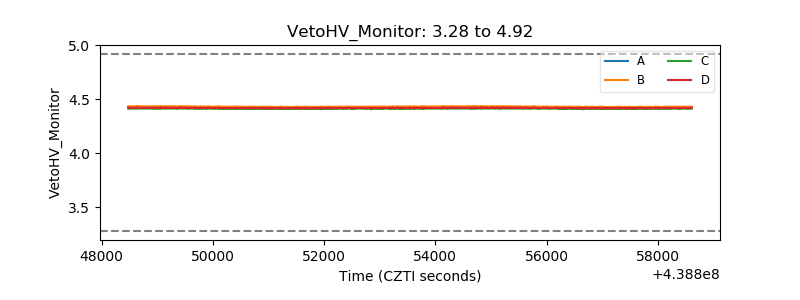 |
| Veto LLD | 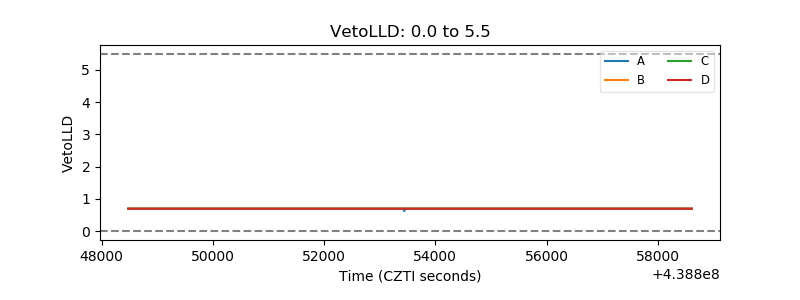 |
| Alpha Counter |  |
| _CPM_Rate | 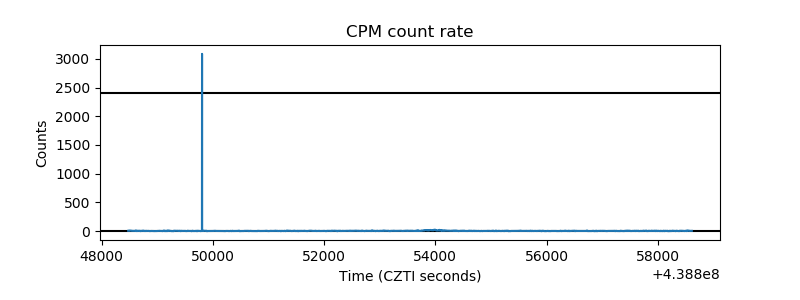 |
| CZT Counter | 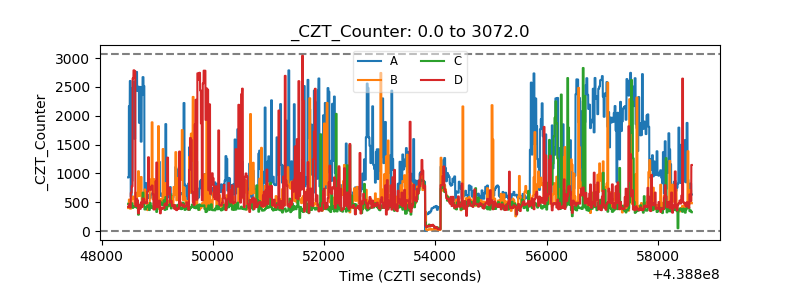 |
| +2.5 Volts monitor | 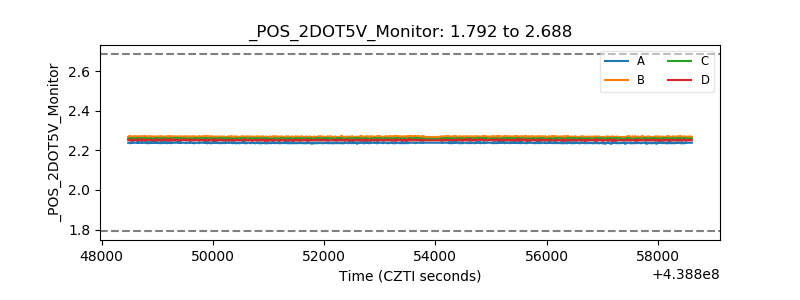 |
| +5 Volts monitor | 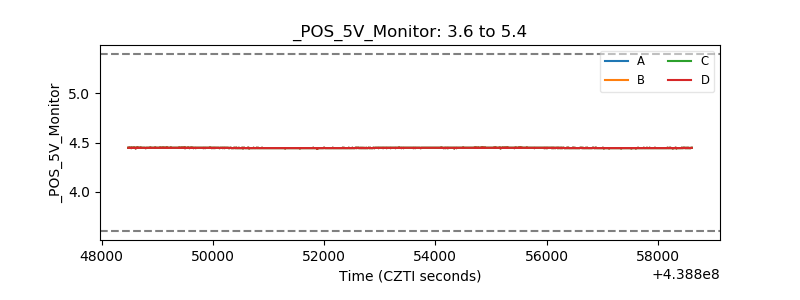 |
| _ROLL_ROT | 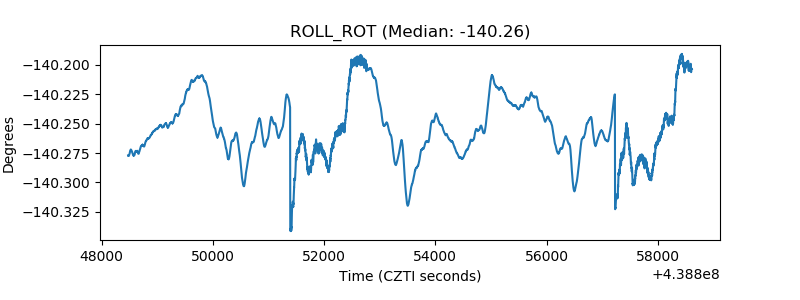 |
| _Roll_DEC | 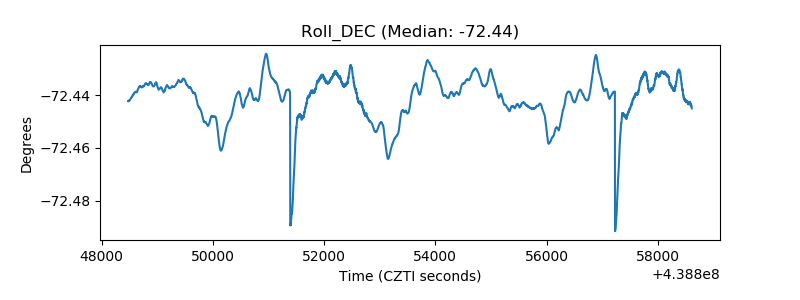 |
| _Roll_RA | 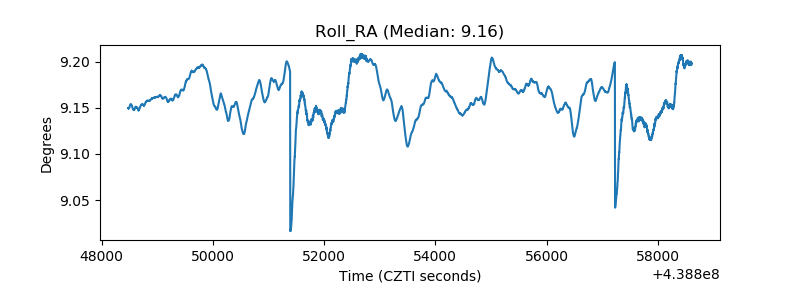 |
| Veto Counter | 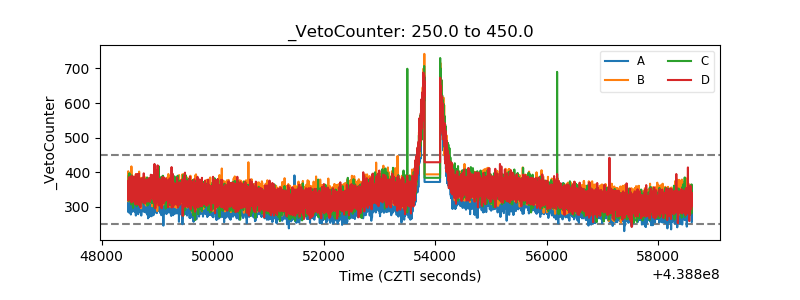 |