| Param | Original file | Final file |
|---|---|---|
| Filename | modeM0/AS1A13_079T01_9000005956_44164cztM0_level2.fits | modeM0/AS1A13_079T01_9000005956_44164cztM0_level2_quad_clean.evt |
| Size (bytes) | 250,974,720 | 42,865,920 |
| Size | 239.3 MB | 40.9 MB |
| Events in quadrant A | 4,036,307 | 207,965 |
| Events in quadrant B | 1,683,333 | 310,807 |
| Events in quadrant C | 1,396,624 | 303,952 |
| Events in quadrant D | 1,948,759 | 270,064 |
| Mode M9 | |||
|---|---|---|---|
| Quadrant | BADHDUFLAG | Total packets | Discarded packets |
| A | 0 | 15 | 5 |
| B | 0 | 10 | 0 |
| C | 0 | 10 | 0 |
| D | 0 | 15 | 5 |
| Mode M0 | |||
|---|---|---|---|
| Quadrant | BADHDUFLAG | Total packets | Discarded packets |
| A | 0 | 15995 | 1957 |
| B | 0 | 7818 | 940 |
| C | 0 | 6845 | 576 |
| D | 0 | 8732 | 1003 |
| Mode SS | |||
|---|---|---|---|
| Quadrant | BADHDUFLAG | Total packets | Discarded packets |
| A | 0 | 67 | 3 |
| B | 0 | 74 | 10 |
| C | 0 | 70 | 5 |
| D | 0 | 70 | 10 |
| Quadrant | Total seconds | Saturated seconds | Saturation percentage |
|---|---|---|---|
| A | 2823 | 990 | 35.069075% |
| B | 2878 | 105 | 3.648367% |
| C | 2909 | 74 | 2.543829% |
| D | 2869 | 157 | 5.472290% |
Noise dominated data is calculated using 1-second bins in cleaned event files. If a bin has >2000 counts, and if more than 50% of those come from <1% of pixels, then it is considered to be noise-dominated and hence unusable.
| Quadrant | # 1 sec bins | Bins with >0 counts | Bins with >2000 counts | High rate bins dominated by noise | Noise dominated (total time) | Noise dominated (detector-on time) | Marked lightcurve |
|---|---|---|---|---|---|---|---|
| A | 5365 | 2924 | 610 | 610 | 11.37% | 20.86% | 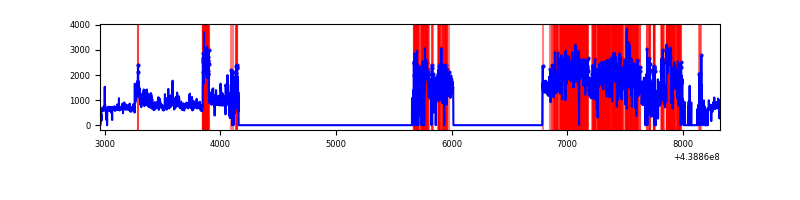 |
| B | 5355 | 2951 | 6 | 6 | 0.11% | 0.20% | 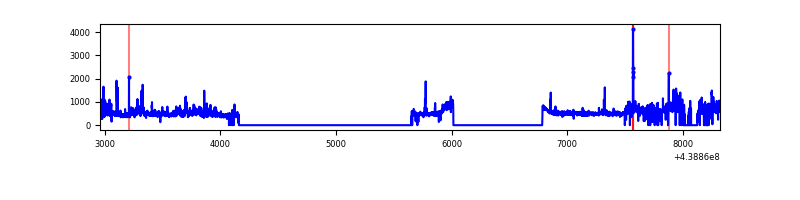 |
| C | 5362 | 2982 | 12 | 12 | 0.22% | 0.40% | 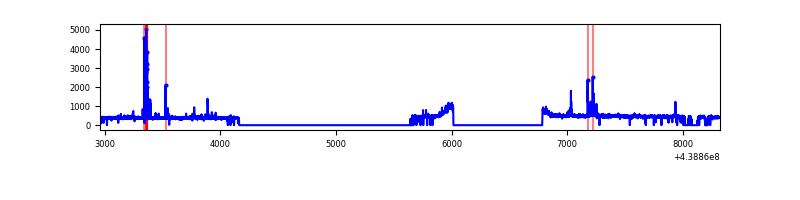 |
| D | 5363 | 2944 | 63 | 63 | 1.17% | 2.14% | 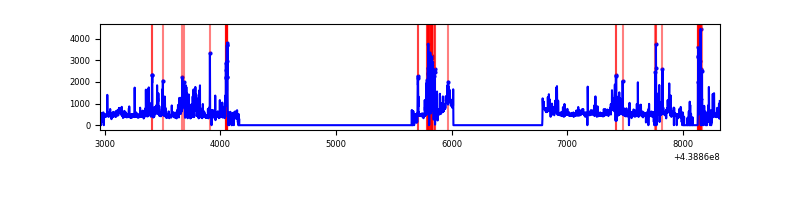 |
Top three noisy pixels from each quadrant. If the there are fewer than three noisy pixels in the level2.evt file, extra rows are filled as -1
| Pixel properties | Quadrant properties | ||||||
|---|---|---|---|---|---|---|---|
| Quadrant | DetID | PixID | Counts | Sigma | Mean | Median | Sigma |
| A | 15 | 223 | 2320642 | 37187.28 | 291 | 284 | 62.4 |
| A | 10 | 83 | 547498 | 8769.94 | 291 | 284 | 62.4 |
| A | 7 | 3 | 19607 | 309.68 | 291 | 284 | 62.4 |
| B | 0 | 219 | 184706 | 2694.48 | 331 | 321 | 68.4 |
| B | 0 | 230 | 133875 | 1951.67 | 331 | 321 | 68.4 |
| B | 5 | 255 | 18139 | 260.38 | 331 | 321 | 68.4 |
| C | 14 | 254 | 102676 | 1286.77 | 330 | 332 | 79.5 |
| C | 8 | 13 | 3733 | 42.76 | 330 | 332 | 79.5 |
| C | 13 | 61 | 2065 | 21.79 | 330 | 332 | 79.5 |
| D | 13 | 249 | 193490 | 2317.59 | 323 | 312 | 83.4 |
| D | 12 | 16 | 162058 | 1940.5 | 323 | 312 | 83.4 |
| D | 1 | 47 | 69396 | 828.81 | 323 | 312 | 83.4 |
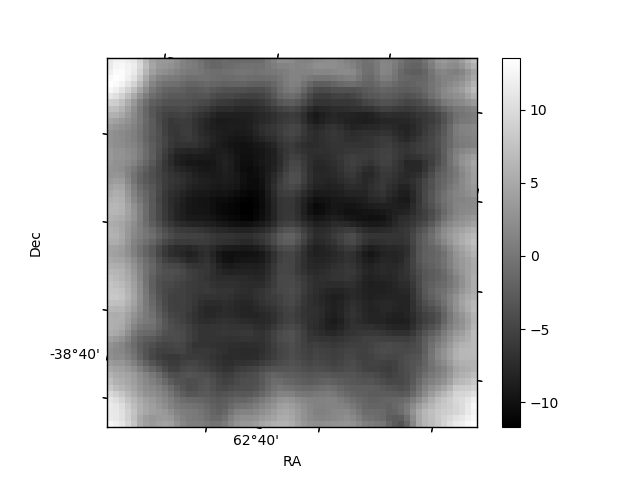
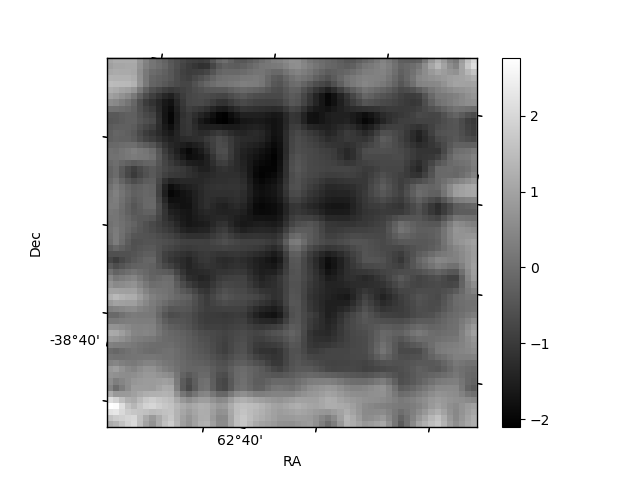
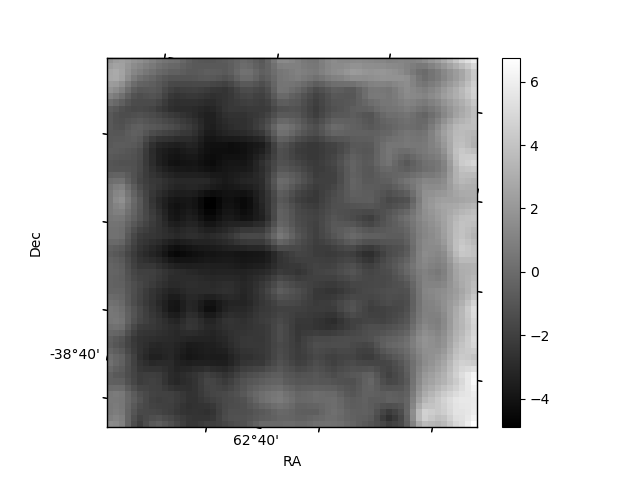
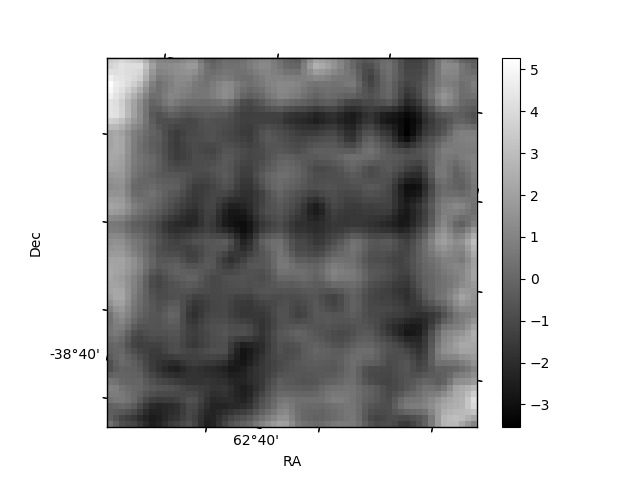
Histogram calculated using DETX and DETY for each event in the final _common_clean file
| Quadrant A | 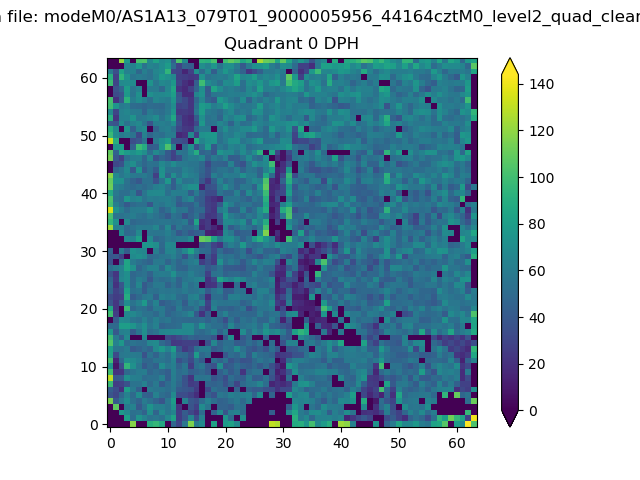 |
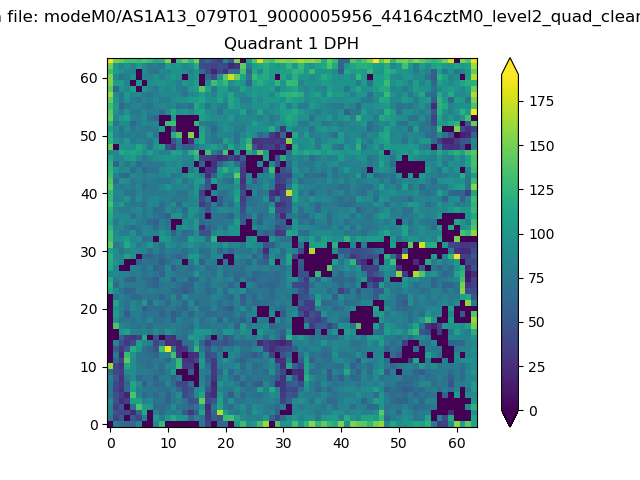 |
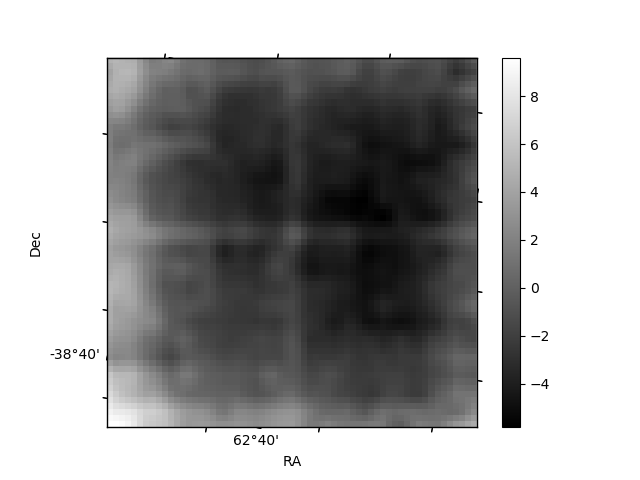
Quadrant B |
|---|---|---|---|
| Quadrant D | 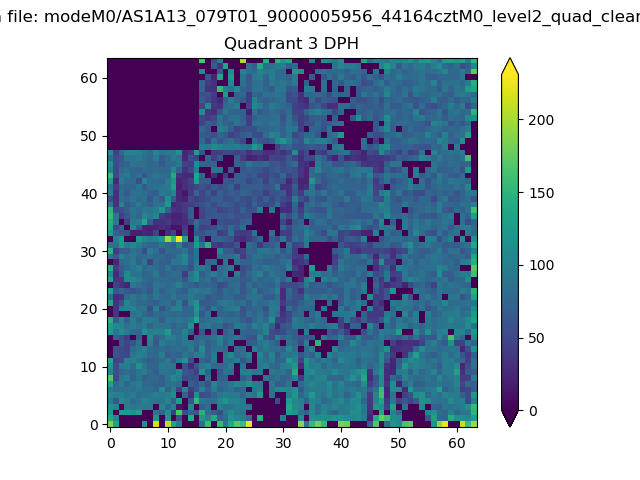 |
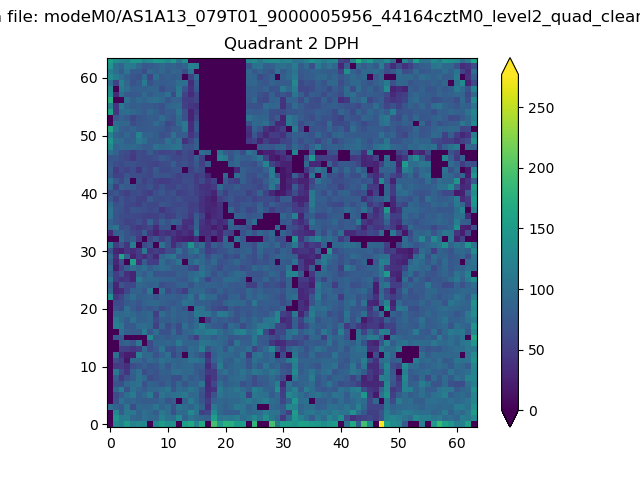 |
Quadrant C |
| Plot type | Count rate plots | Images |
|---|---|---|
| Comparison with Poisson distribution Blue bars denote a histogram of data divided into 1 sec bins. Red curve is a Poisson curve with rate = median count rate of data. |
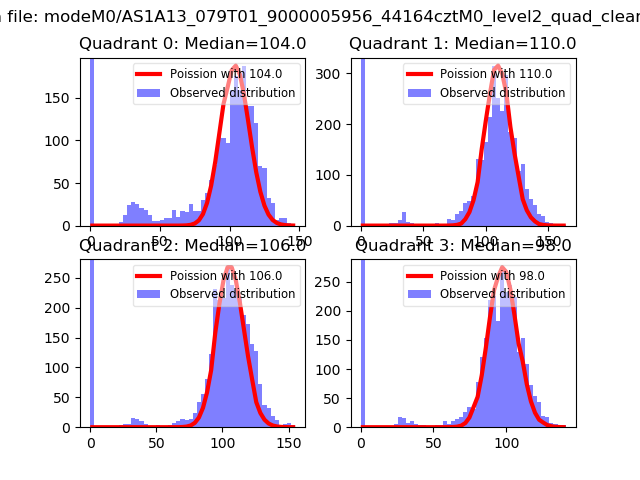 |
 |
| Quadrant-wise count rates Data is divided into 100 sec bins |
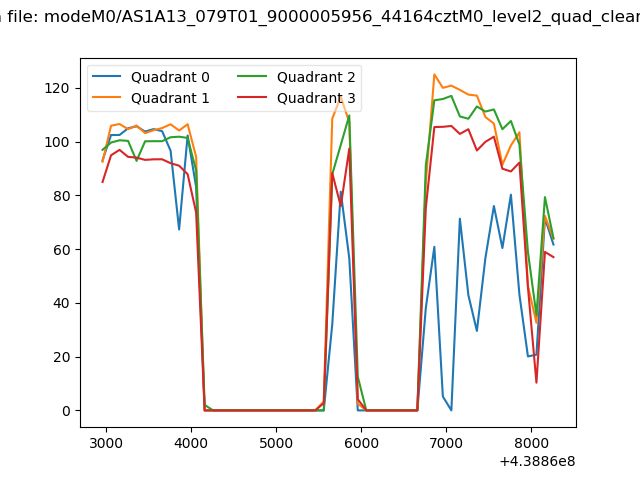 |
|
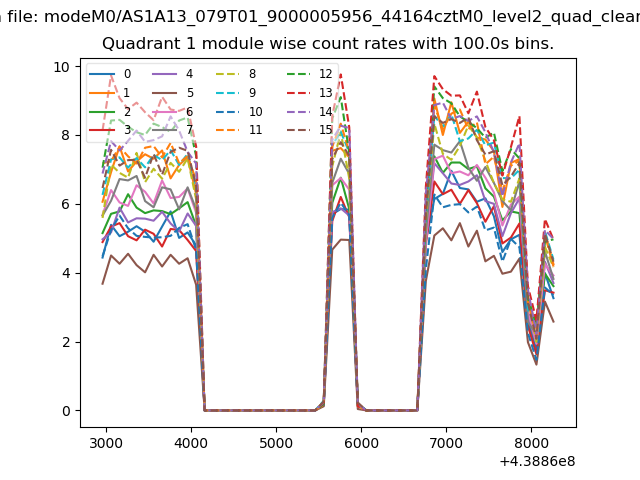
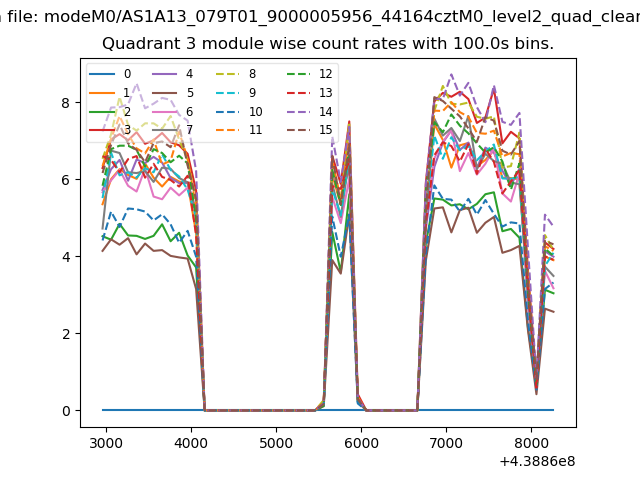
| Module-wise count rates for Quadrant A Data is divided into 100 sec bins |
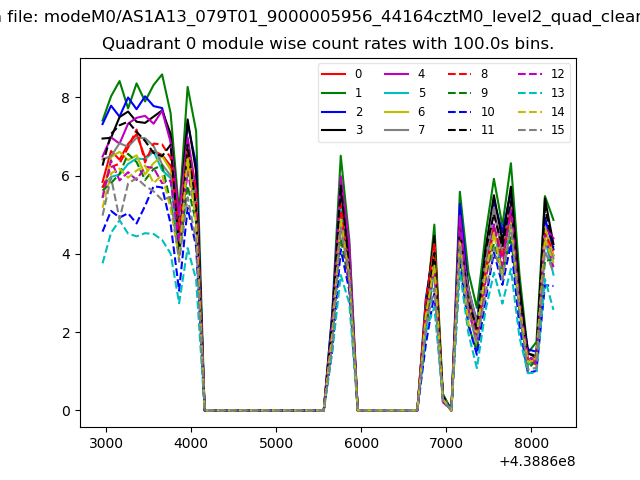 |
 |
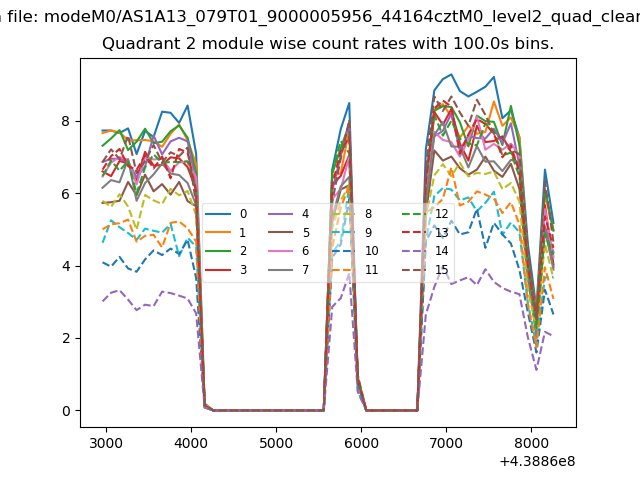
| Module-wise count rates for Quadrant B Data is divided into 100 sec bins |
 |
 |
| Module-wise count rates for Quadrant C Data is divided into 100 sec bins |
 |
 |
| Module-wise count rates for Quadrant D Data is divided into 100 sec bins |
 |
 |
| Parameter | Plot |
|---|---|
| CZT HV Monitor | 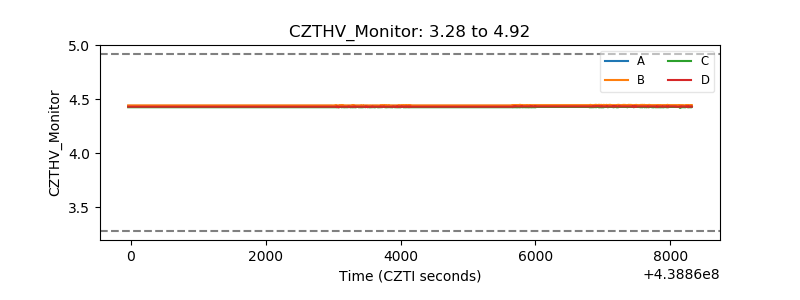 |
| D_VDD | 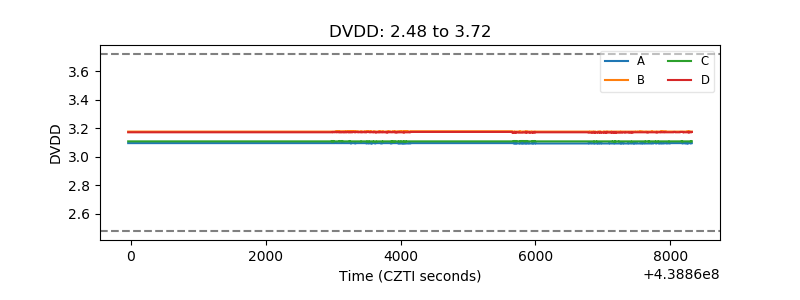 |
| Temperature 1 | 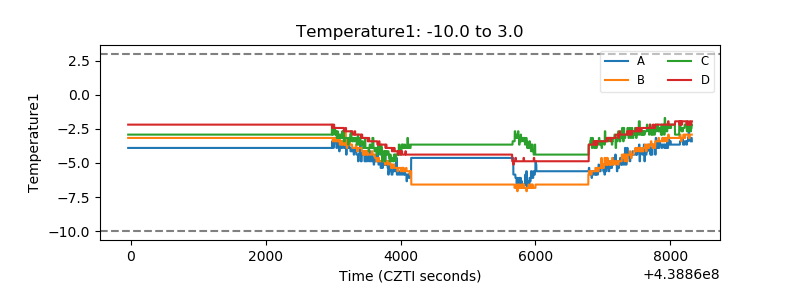 |
| Veto HV Monitor | 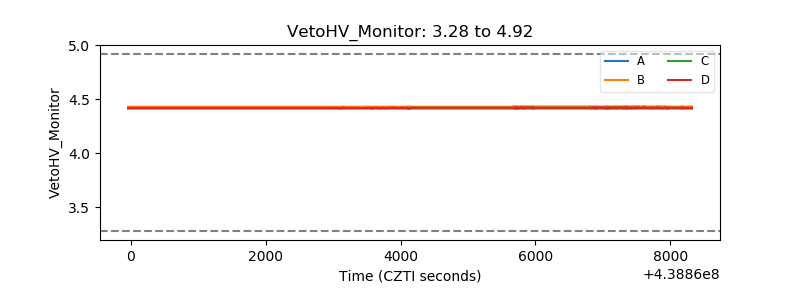 |
| Veto LLD | 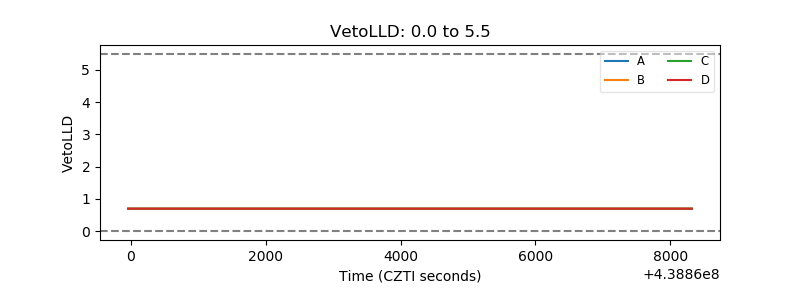 |
| Alpha Counter | 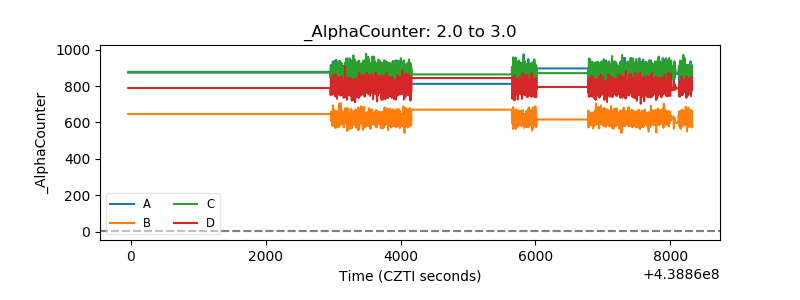 |
| _CPM_Rate | 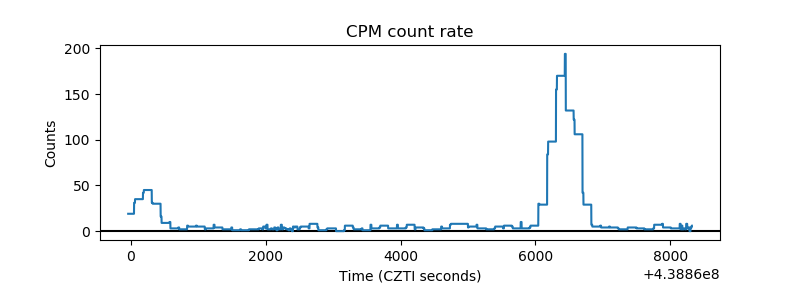 |
| CZT Counter | 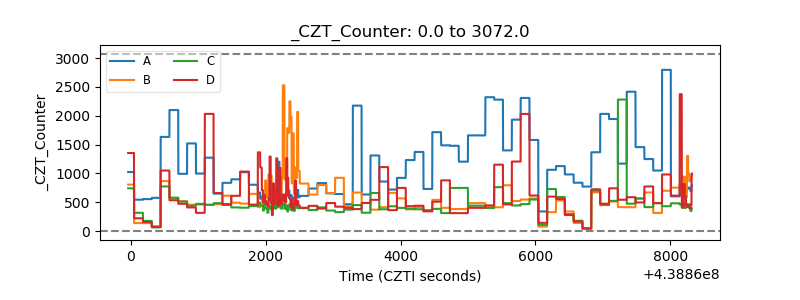 |
| +2.5 Volts monitor | 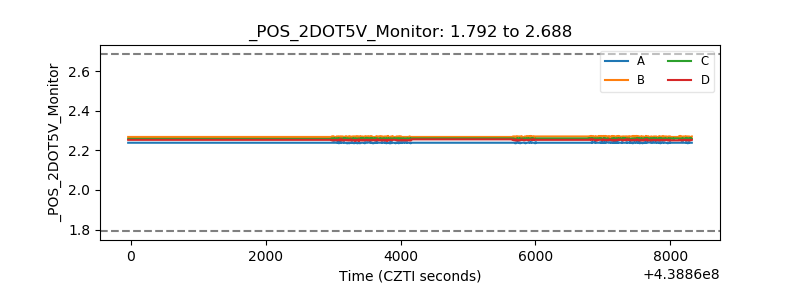 |
| +5 Volts monitor | 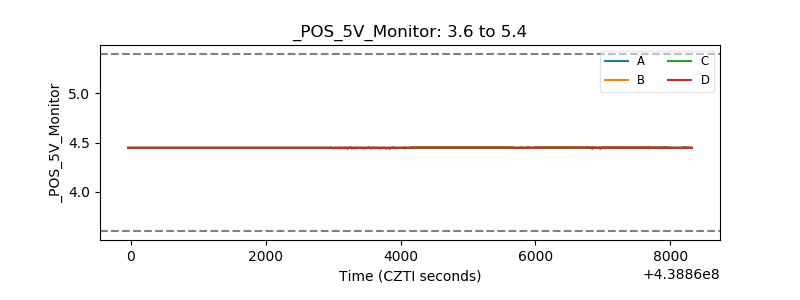 |
| _ROLL_ROT | 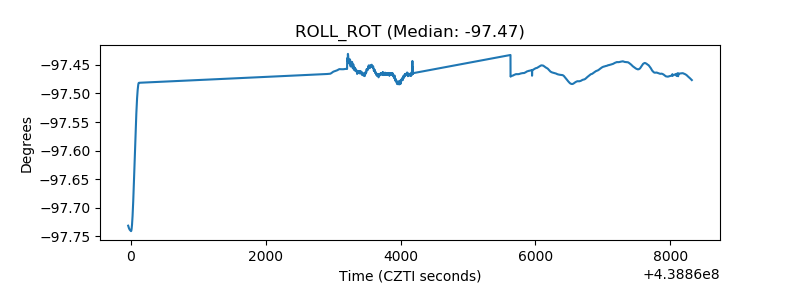 |
| _Roll_DEC | 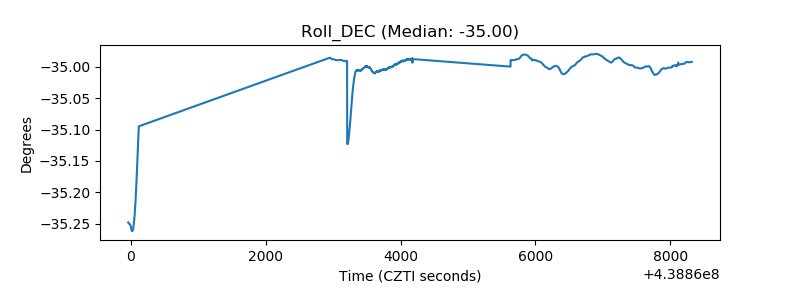 |
| _Roll_RA | 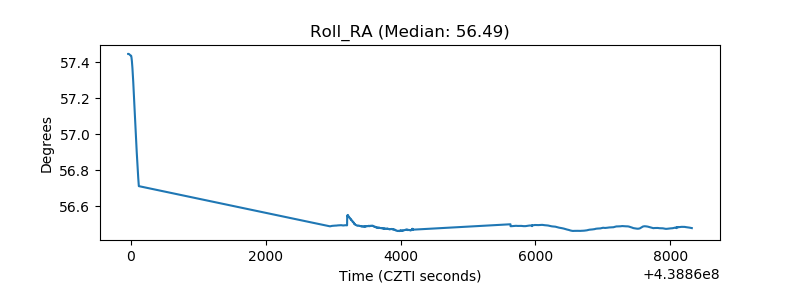 |
| Veto Counter | 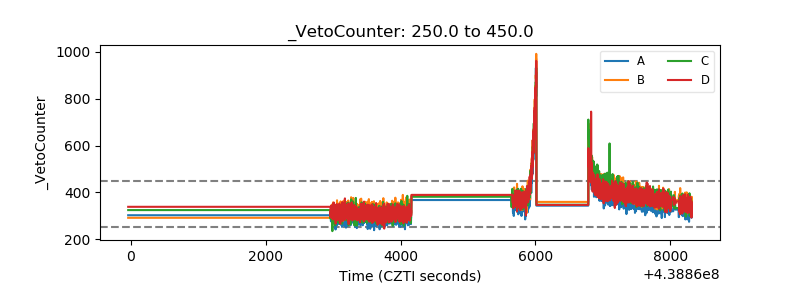 |