| Param | Original file | Final file |
|---|---|---|
| Filename | modeM0/AS1A13_079T01_9000005956_44165cztM0_level2.fits | modeM0/AS1A13_079T01_9000005956_44165cztM0_level2_quad_clean.evt |
| Size (bytes) | 310,593,600 | 67,314,240 |
| Size | 296.2 MB | 64.2 MB |
| Events in quadrant A | 4,385,105 | 425,185 |
| Events in quadrant B | 2,349,521 | 467,683 |
| Events in quadrant C | 1,987,583 | 447,087 |
| Events in quadrant D | 2,449,394 | 404,533 |
| Mode M9 | |||
|---|---|---|---|
| Quadrant | BADHDUFLAG | Total packets | Discarded packets |
| A | 0 | 11 | 1 |
| B | 0 | 11 | 1 |
| C | 0 | 11 | 1 |
| D | 0 | 10 | 0 |
| Mode M0 | |||
|---|---|---|---|
| Quadrant | BADHDUFLAG | Total packets | Discarded packets |
| A | 0 | 16487 | 303 |
| B | 0 | 10197 | 169 |
| C | 0 | 9115 | 137 |
| D | 0 | 10369 | 172 |
| Mode SS | |||
|---|---|---|---|
| Quadrant | BADHDUFLAG | Total packets | Discarded packets |
| A | 0 | 86 | 2 |
| B | 0 | 87 | 3 |
| C | 0 | 85 | 1 |
| D | 0 | 86 | 2 |
| Quadrant | Total seconds | Saturated seconds | Saturation percentage |
|---|---|---|---|
| A | 4171 | 510 | 12.227284% |
| B | 4170 | 120 | 2.877698% |
| C | 4180 | 77 | 1.842105% |
| D | 4173 | 138 | 3.306973% |
Noise dominated data is calculated using 1-second bins in cleaned event files. If a bin has >2000 counts, and if more than 50% of those come from <1% of pixels, then it is considered to be noise-dominated and hence unusable.
| Quadrant | # 1 sec bins | Bins with >0 counts | Bins with >2000 counts | High rate bins dominated by noise | Noise dominated (total time) | Noise dominated (detector-on time) | Marked lightcurve |
|---|---|---|---|---|---|---|---|
| A | 5137 | 4181 | 326 | 326 | 6.35% | 7.80% | 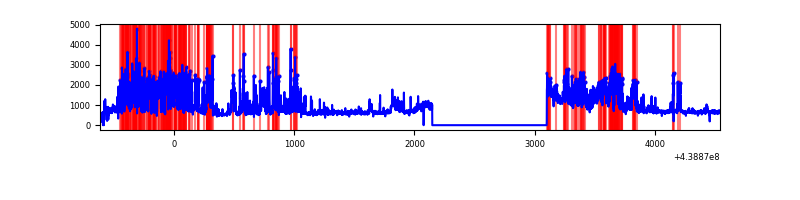 |
| B | 5145 | 4187 | 21 | 21 | 0.41% | 0.50% | 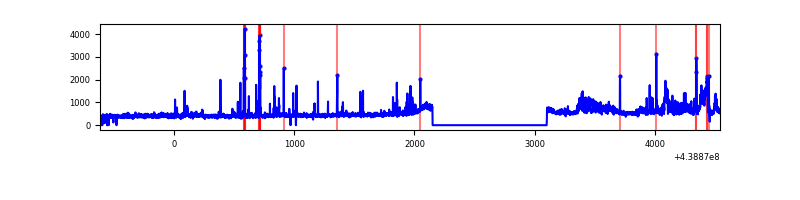 |
| C | 5155 | 4197 | 11 | 11 | 0.21% | 0.26% | 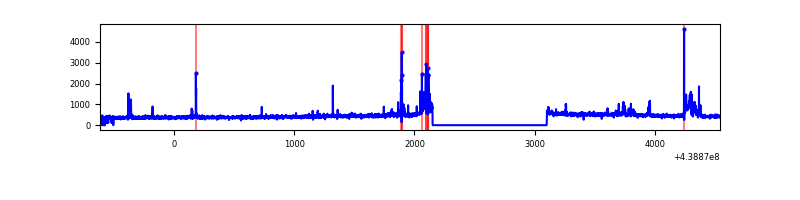 |
| D | 5154 | 4189 | 71 | 71 | 1.38% | 1.69% | 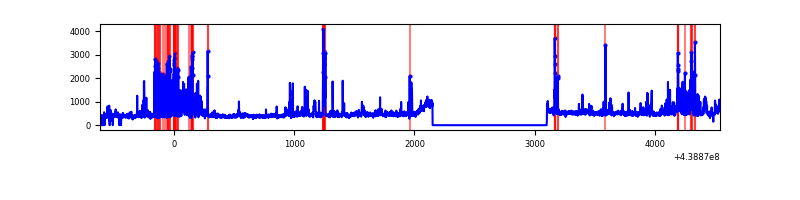 |
Top three noisy pixels from each quadrant. If the there are fewer than three noisy pixels in the level2.evt file, extra rows are filled as -1
| Pixel properties | Quadrant properties | ||||||
|---|---|---|---|---|---|---|---|
| Quadrant | DetID | PixID | Counts | Sigma | Mean | Median | Sigma |
| A | 15 | 223 | 1738258 | 17752.07 | 463 | 452 | 97.9 |
| A | 10 | 83 | 812570 | 8295.97 | 463 | 452 | 97.9 |
| A | 7 | 3 | 37298 | 376.39 | 463 | 452 | 97.9 |
| B | 5 | 255 | 151310 | 1589.16 | 472 | 456 | 94.9 |
| B | 0 | 219 | 117957 | 1237.8 | 472 | 456 | 94.9 |
| B | 0 | 230 | 110009 | 1154.07 | 472 | 456 | 94.9 |
| C | 14 | 254 | 91751 | 836.07 | 464 | 464 | 109.2 |
| C | 4 | 254 | 66653 | 606.21 | 464 | 464 | 109.2 |
| C | 15 | 208 | 6792 | 57.96 | 464 | 464 | 109.2 |
| D | 13 | 187 | 262879 | 2217.19 | 462 | 447 | 118.4 |
| D | 13 | 249 | 181583 | 1530.35 | 462 | 447 | 118.4 |
| D | 1 | 47 | 38944 | 325.25 | 462 | 447 | 118.4 |
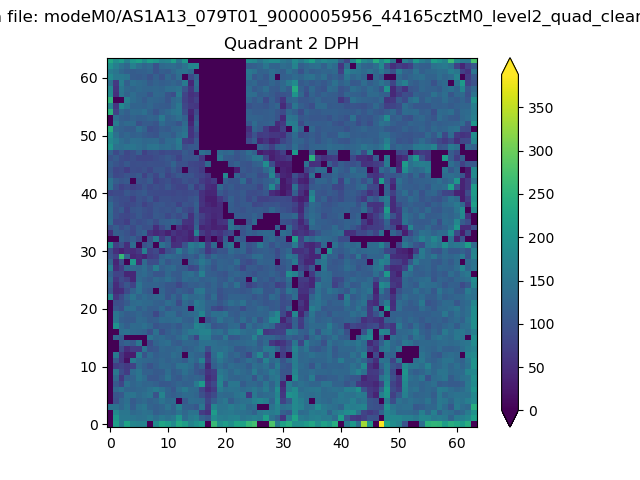
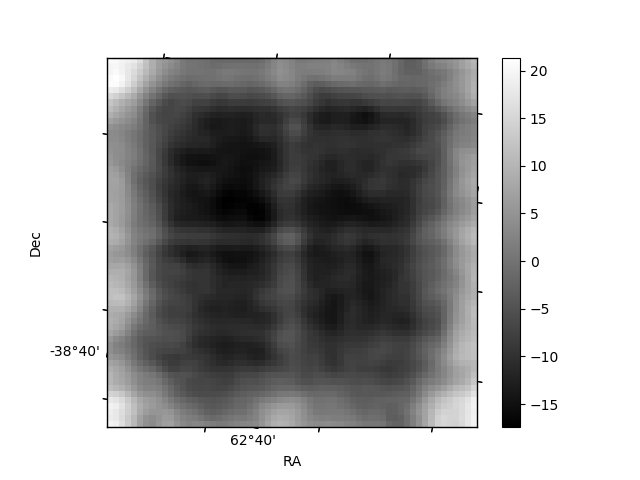
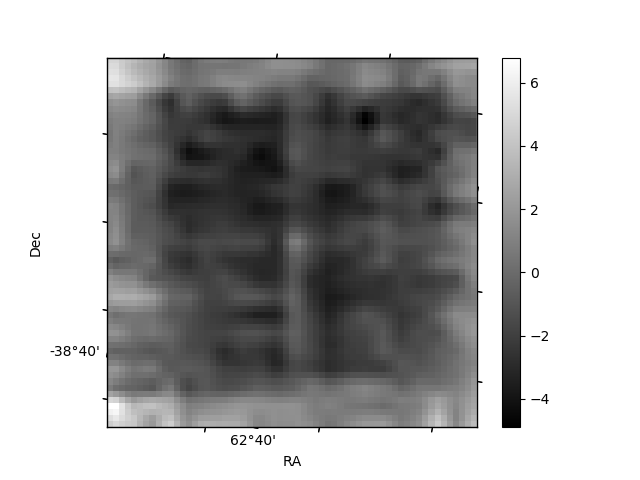
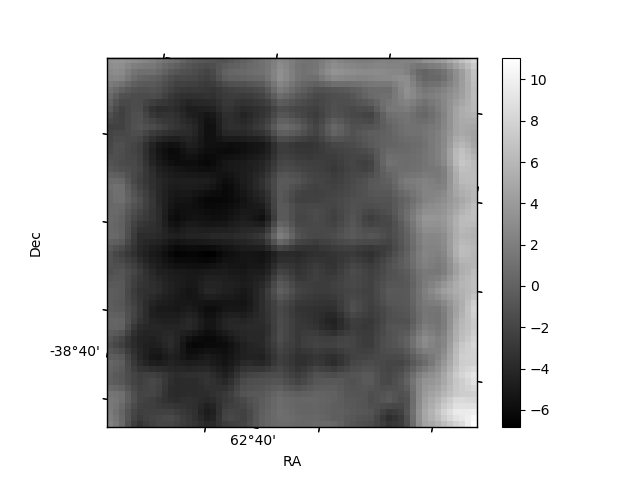
Histogram calculated using DETX and DETY for each event in the final _common_clean file
| Quadrant A | 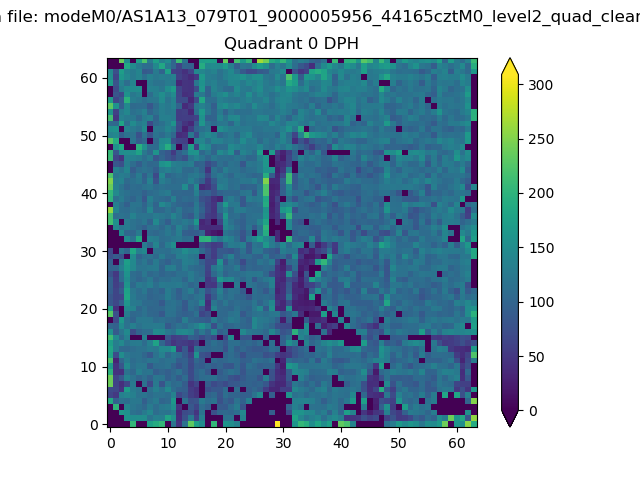 |
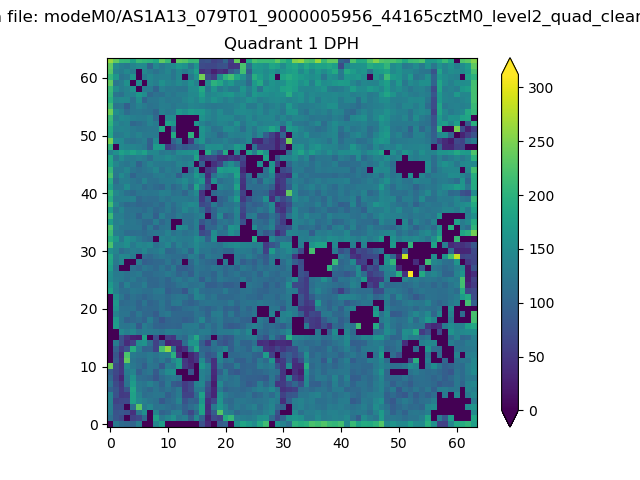 |
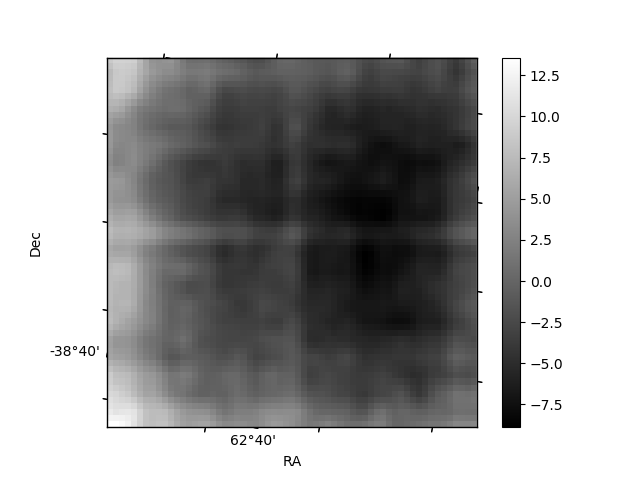
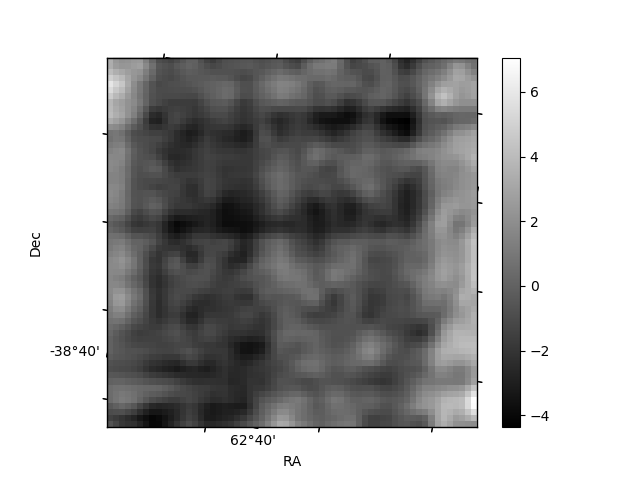
Quadrant B |
|---|---|---|---|
| Quadrant D | 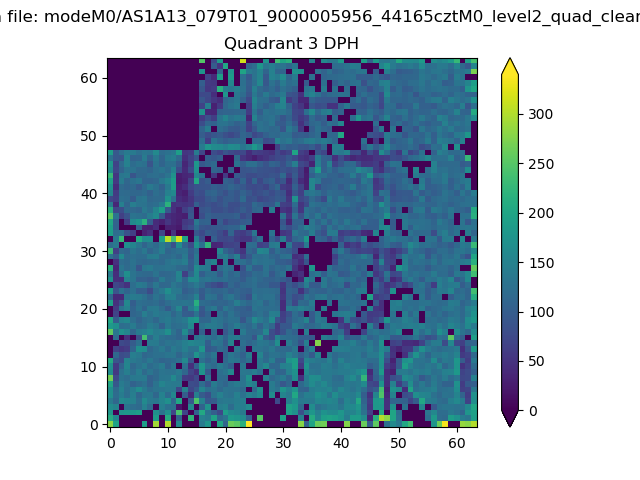 |
 |
Quadrant C |
| Plot type | Count rate plots | Images |
|---|---|---|
| Comparison with Poisson distribution Blue bars denote a histogram of data divided into 1 sec bins. Red curve is a Poisson curve with rate = median count rate of data. |
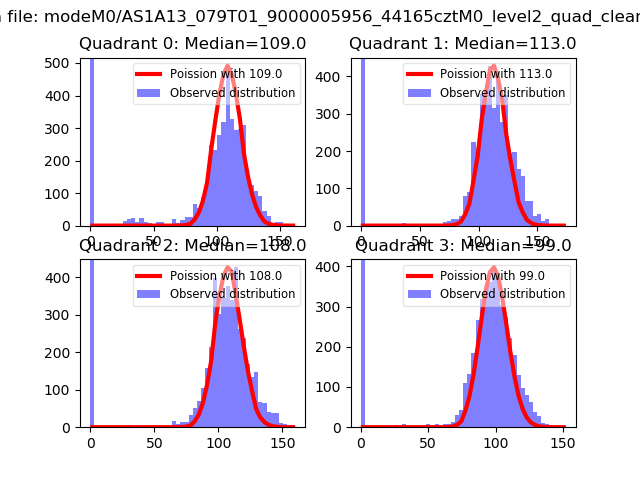 |
 |
| Quadrant-wise count rates Data is divided into 100 sec bins |
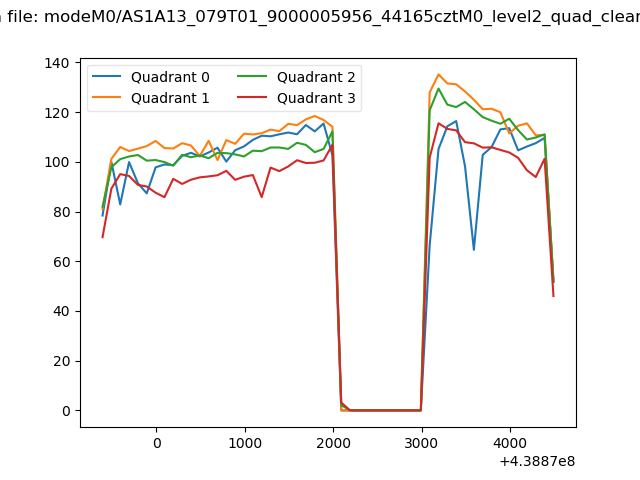 |
|
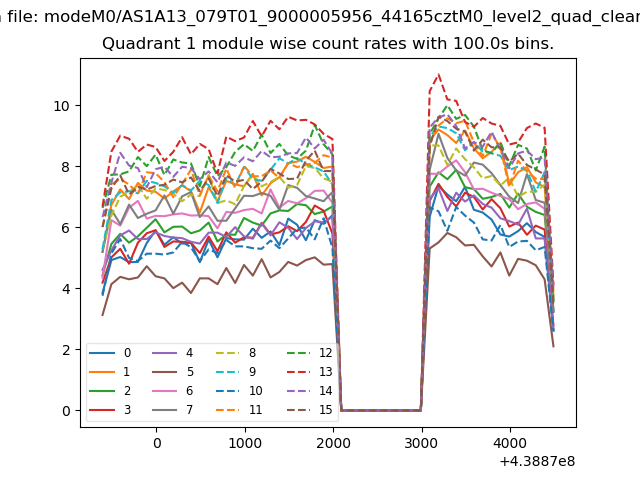
| Module-wise count rates for Quadrant A Data is divided into 100 sec bins |
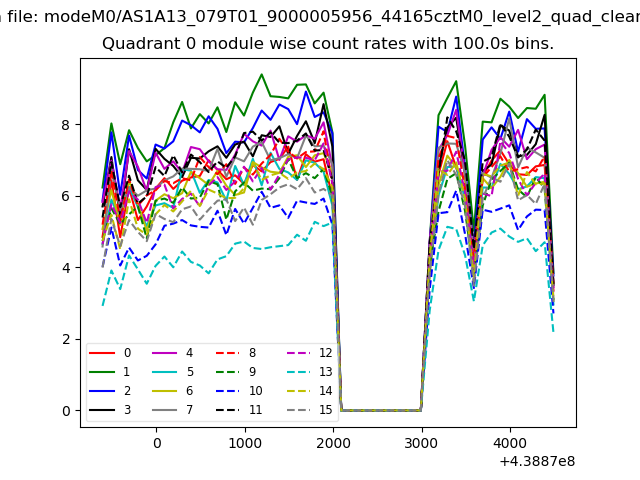 |
 |
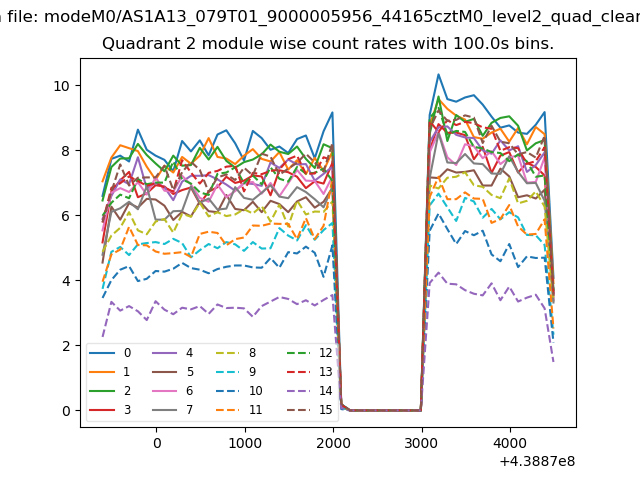
| Module-wise count rates for Quadrant B Data is divided into 100 sec bins |
 |
 |
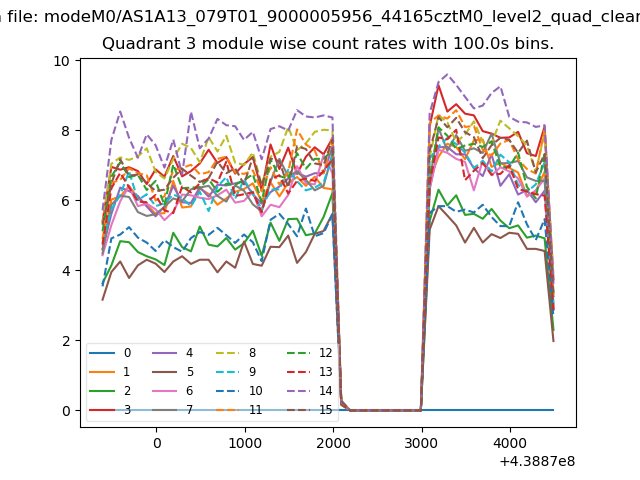
| Module-wise count rates for Quadrant C Data is divided into 100 sec bins |
 |
 |
| Module-wise count rates for Quadrant D Data is divided into 100 sec bins |
 |
 |
| Parameter | Plot |
|---|---|
| CZT HV Monitor | 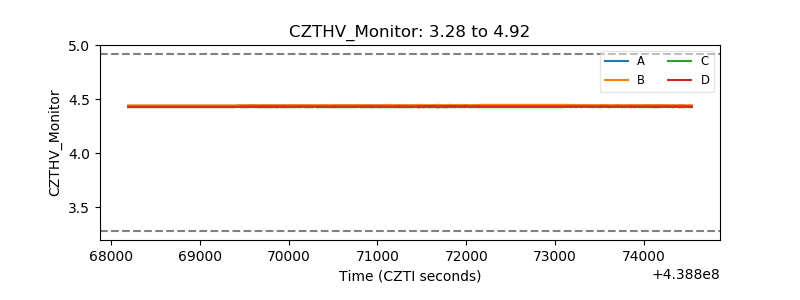 |
| D_VDD | 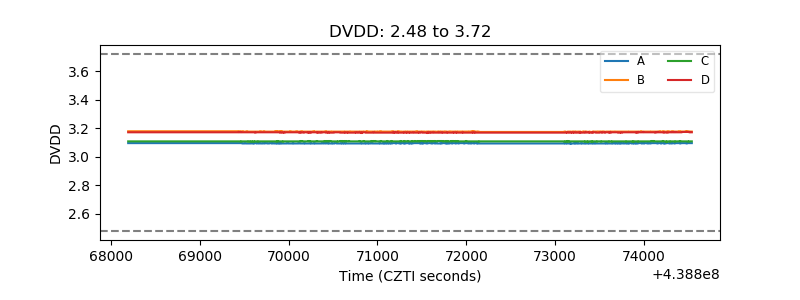 |
| Temperature 1 | 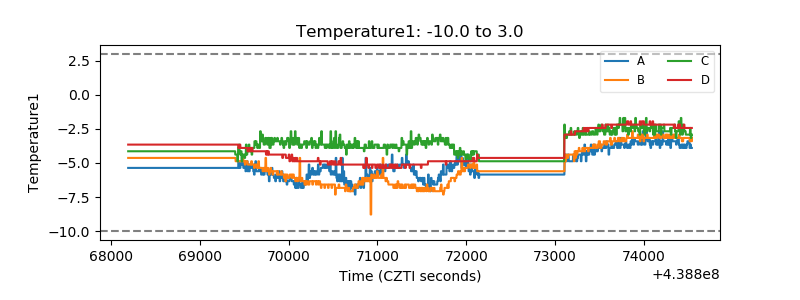 |
| Veto HV Monitor | 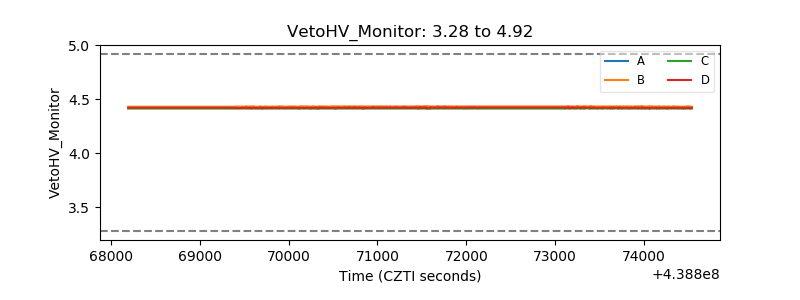 |
| Veto LLD | 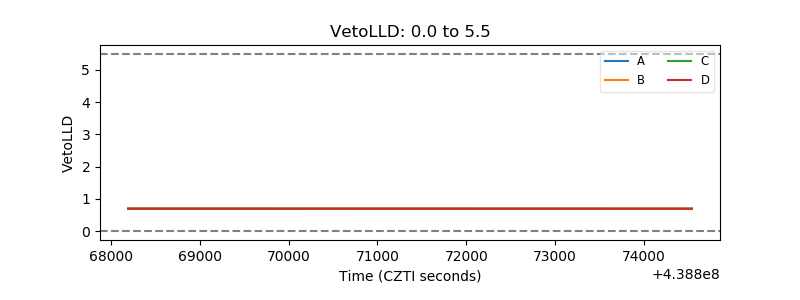 |
| Alpha Counter | 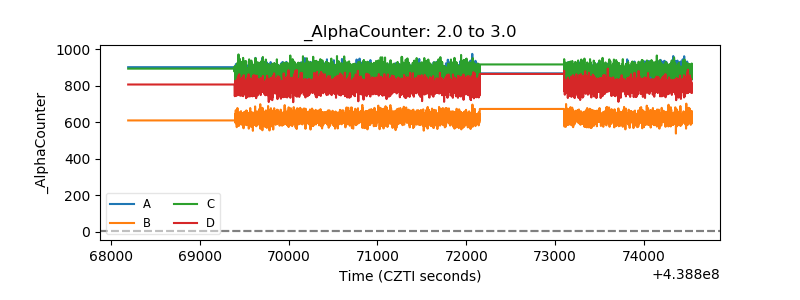 |
| _CPM_Rate | 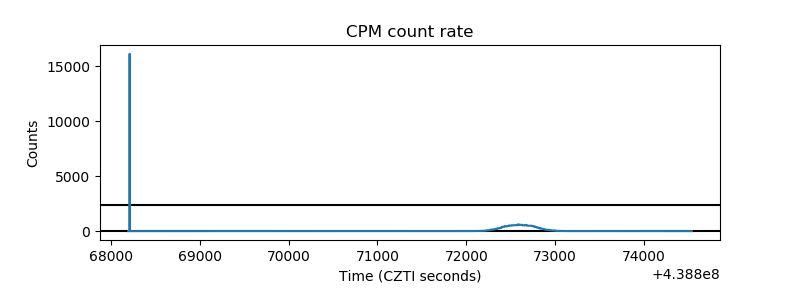 |
| CZT Counter | 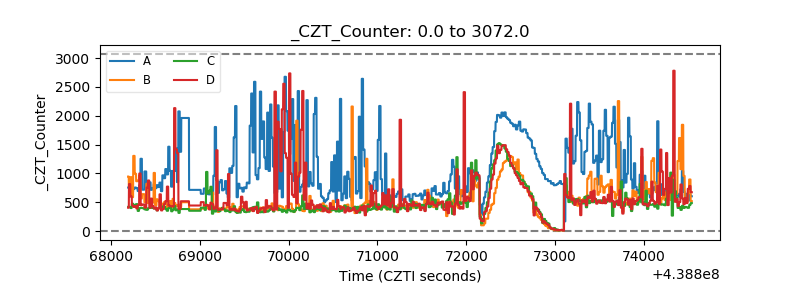 |
| +2.5 Volts monitor | 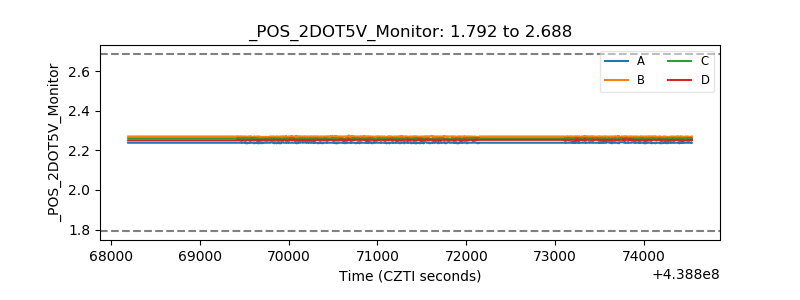 |
| +5 Volts monitor | 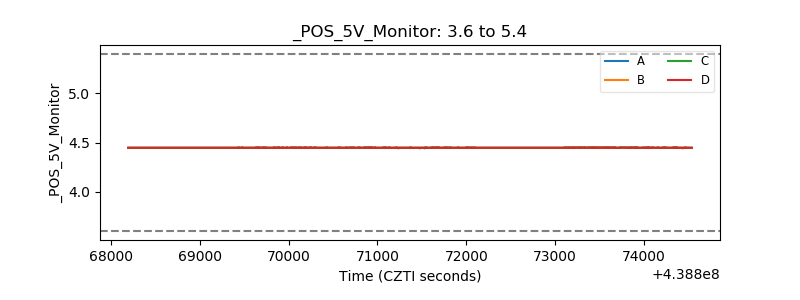 |
| _ROLL_ROT | 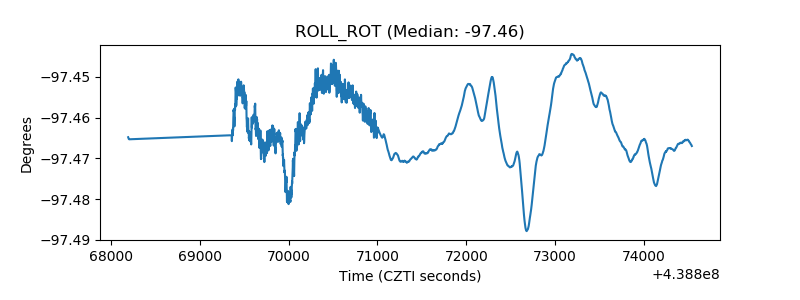 |
| _Roll_DEC | 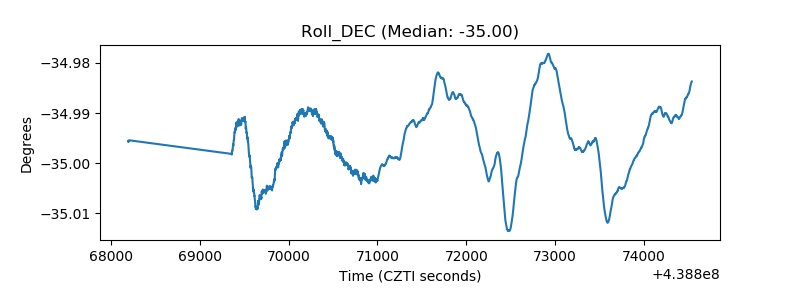 |
| _Roll_RA | 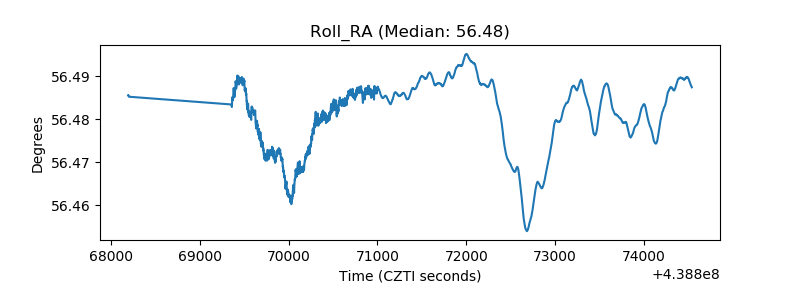 |
| Veto Counter | 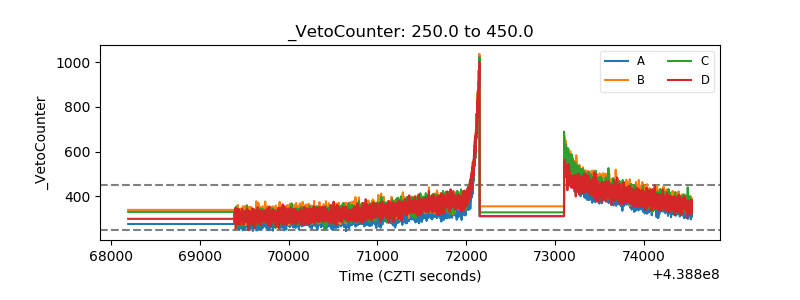 |