| Param | Original file | Final file |
|---|---|---|
| Filename | modeM0/AS1A13_079T01_9000005956_44167cztM0_level2.fits | modeM0/AS1A13_079T01_9000005956_44167cztM0_level2_quad_clean.evt |
| Size (bytes) | 446,713,920 | 99,224,640 |
| Size | 426.0 MB | 94.6 MB |
| Events in quadrant A | 5,565,127 | 652,894 |
| Events in quadrant B | 3,664,037 | 683,997 |
| Events in quadrant C | 2,812,458 | 660,678 |
| Events in quadrant D | 4,026,830 | 586,594 |
| Mode M9 | |||
|---|---|---|---|
| Quadrant | BADHDUFLAG | Total packets | Discarded packets |
| A | 0 | 11 | 0 |
| B | 0 | 11 | 0 |
| C | 0 | 11 | 0 |
| D | 0 | 11 | 0 |
| Mode M0 | |||
|---|---|---|---|
| Quadrant | BADHDUFLAG | Total packets | Discarded packets |
| A | 0 | 21189 | 1 |
| B | 0 | 15203 | 1 |
| C | 0 | 12772 | 1 |
| D | 0 | 16227 | 1 |
| Mode SS | |||
|---|---|---|---|
| Quadrant | BADHDUFLAG | Total packets | Discarded packets |
| A | 0 | 122 | 0 |
| B | 0 | 122 | 0 |
| C | 0 | 122 | 0 |
| D | 0 | 122 | 0 |
| Quadrant | Total seconds | Saturated seconds | Saturation percentage |
|---|---|---|---|
| A | 6018 | 401 | 6.663343% |
| B | 6018 | 223 | 3.705550% |
| C | 6019 | 68 | 1.129756% |
| D | 6019 | 298 | 4.950989% |
Noise dominated data is calculated using 1-second bins in cleaned event files. If a bin has >2000 counts, and if more than 50% of those come from <1% of pixels, then it is considered to be noise-dominated and hence unusable.
| Quadrant | # 1 sec bins | Bins with >0 counts | Bins with >2000 counts | High rate bins dominated by noise | Noise dominated (total time) | Noise dominated (detector-on time) | Marked lightcurve |
|---|---|---|---|---|---|---|---|
| A | 7098 | 6019 | 263 | 263 | 3.71% | 4.37% | 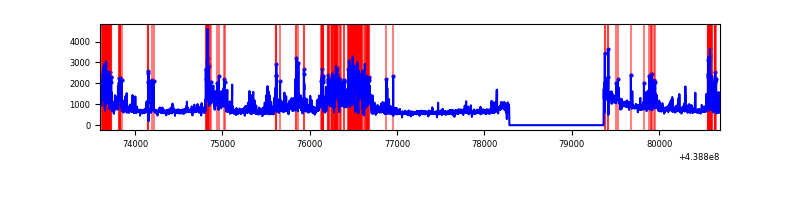 |
| B | 7098 | 6019 | 83 | 83 | 1.17% | 1.38% | 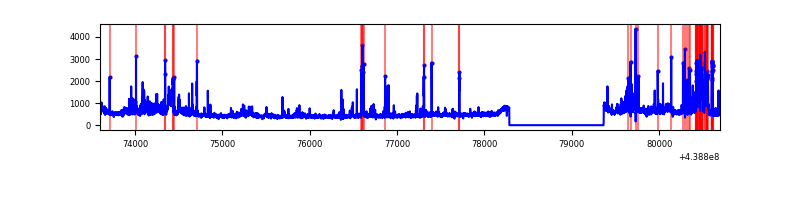 |
| C | 7099 | 6020 | 17 | 17 | 0.24% | 0.28% | 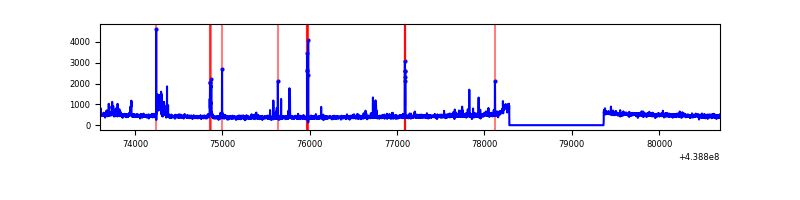 |
| D | 7099 | 6020 | 230 | 230 | 3.24% | 3.82% | 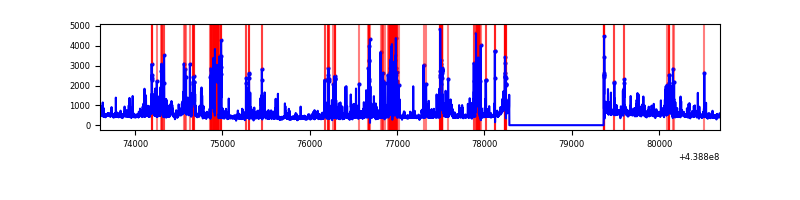 |
Top three noisy pixels from each quadrant. If the there are fewer than three noisy pixels in the level2.evt file, extra rows are filled as -1
| Pixel properties | Quadrant properties | ||||||
|---|---|---|---|---|---|---|---|
| Quadrant | DetID | PixID | Counts | Sigma | Mean | Median | Sigma |
| A | 15 | 223 | 1737362 | 12355.73 | 676 | 664 | 140.6 |
| A | 10 | 83 | 1178061 | 8376.59 | 676 | 664 | 140.6 |
| A | 7 | 3 | 22629 | 156.27 | 676 | 664 | 140.6 |
| B | 5 | 255 | 300713 | 2239.27 | 677 | 658 | 134.0 |
| B | 0 | 219 | 256388 | 1908.48 | 677 | 658 | 134.0 |
| B | 5 | 172 | 180731 | 1343.86 | 677 | 658 | 134.0 |
| C | 14 | 254 | 131839 | 832.49 | 666 | 670 | 157.6 |
| C | 4 | 254 | 65649 | 412.4 | 666 | 670 | 157.6 |
| C | 1 | 241 | 13485 | 81.33 | 666 | 670 | 157.6 |
| D | 1 | 52 | 617612 | 3727.9 | 654 | 635 | 165.5 |
| D | 13 | 249 | 337560 | 2035.77 | 654 | 635 | 165.5 |
| D | 5 | 235 | 195115 | 1175.09 | 654 | 635 | 165.5 |
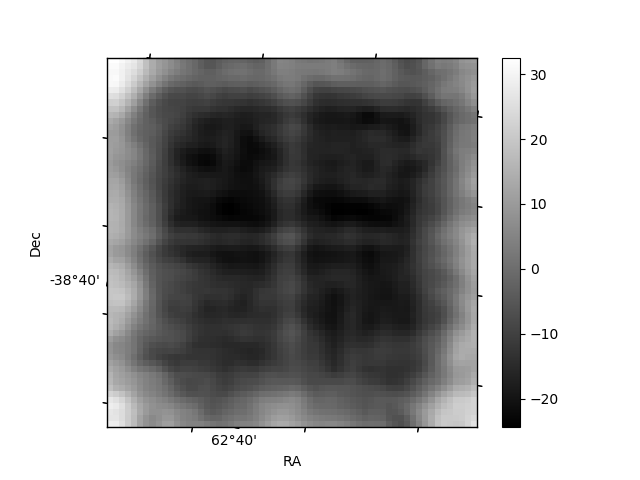
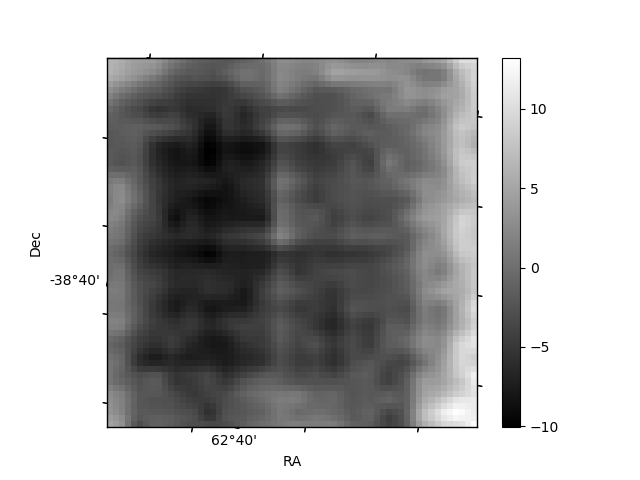
Histogram calculated using DETX and DETY for each event in the final _common_clean file
| Quadrant A | 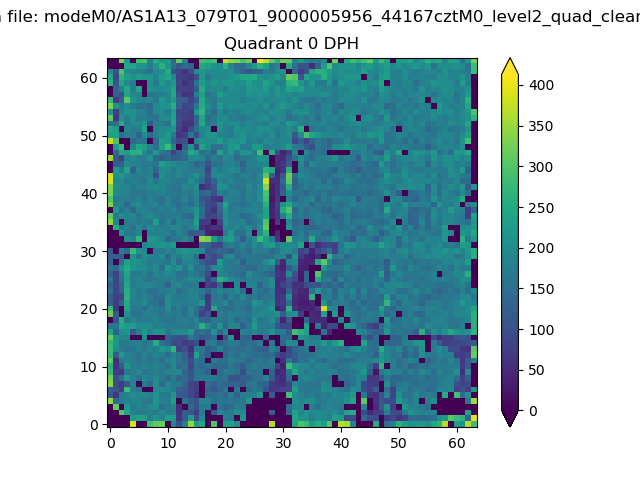 |
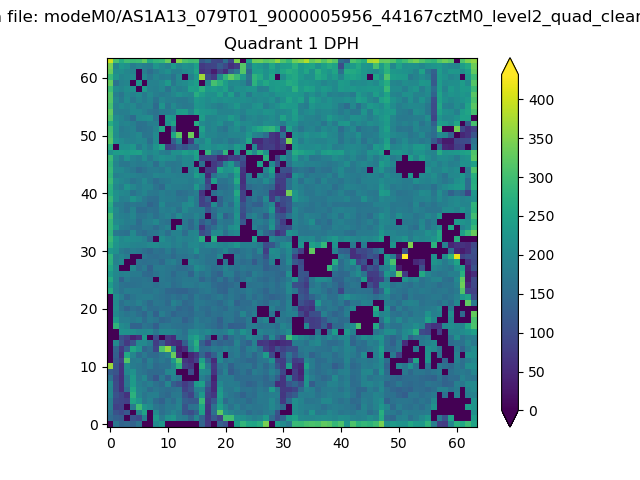 |
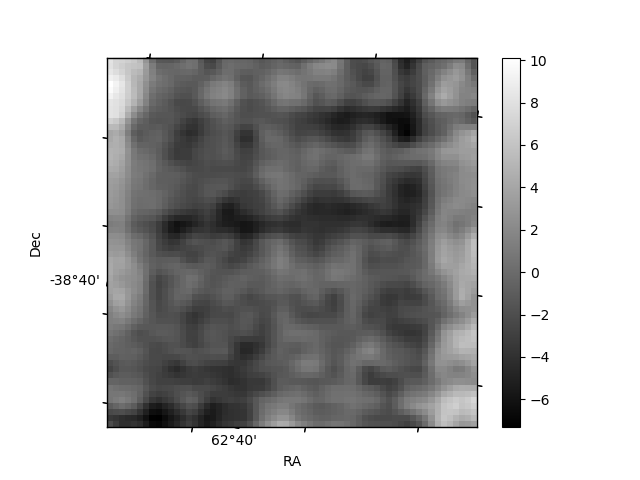
Quadrant B |
|---|---|---|---|
| Quadrant D | 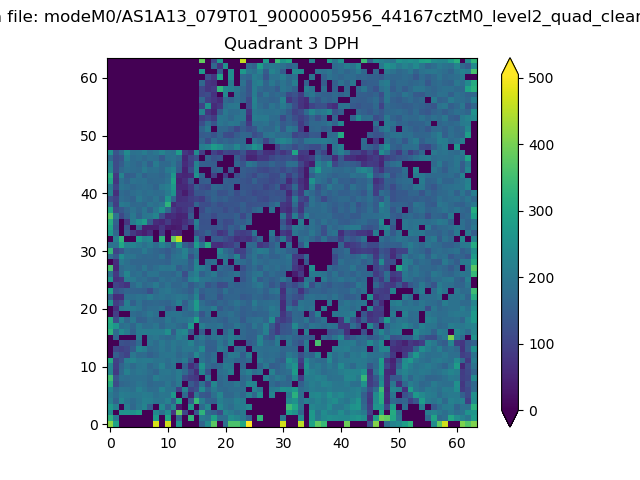 |
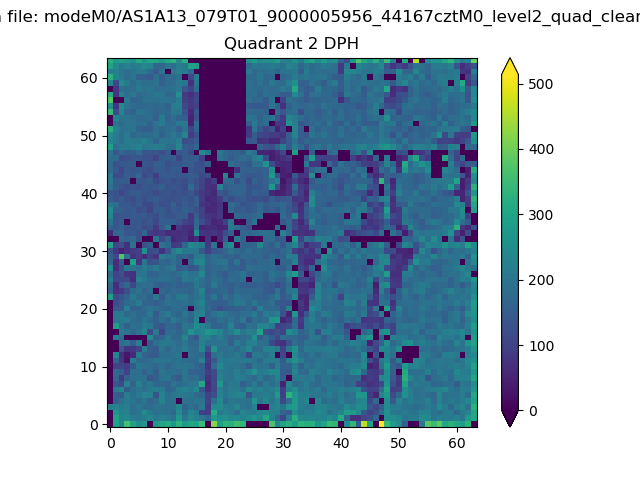 |
Quadrant C |
| Plot type | Count rate plots | Images |
|---|---|---|
| Comparison with Poisson distribution Blue bars denote a histogram of data divided into 1 sec bins. Red curve is a Poisson curve with rate = median count rate of data. |
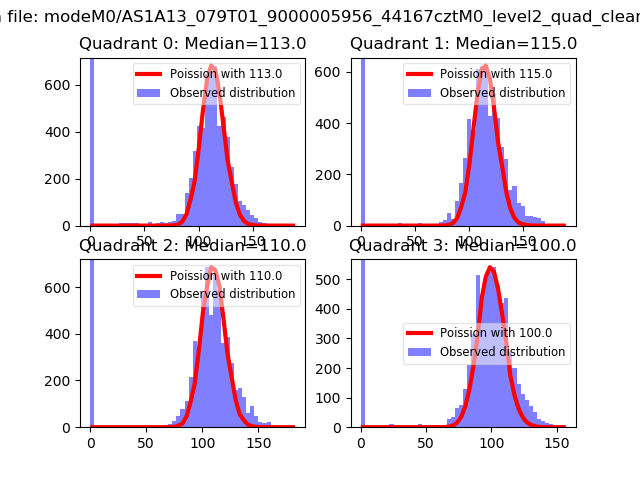 |
 |
| Quadrant-wise count rates Data is divided into 100 sec bins |
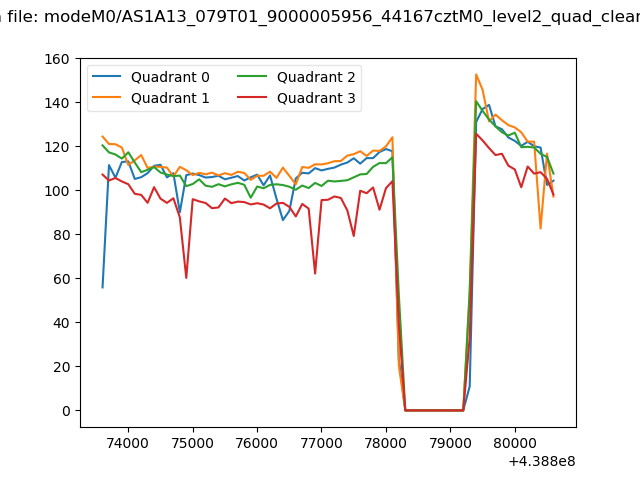 |
|
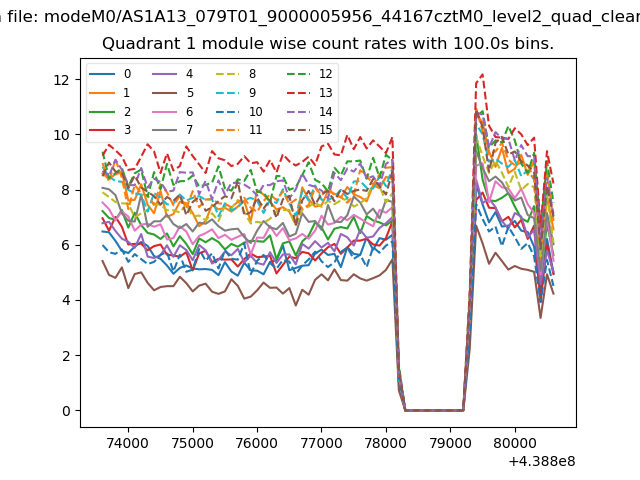
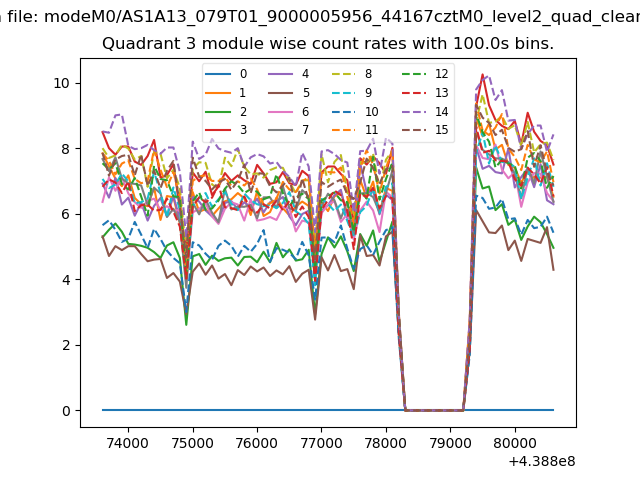
| Module-wise count rates for Quadrant A Data is divided into 100 sec bins |
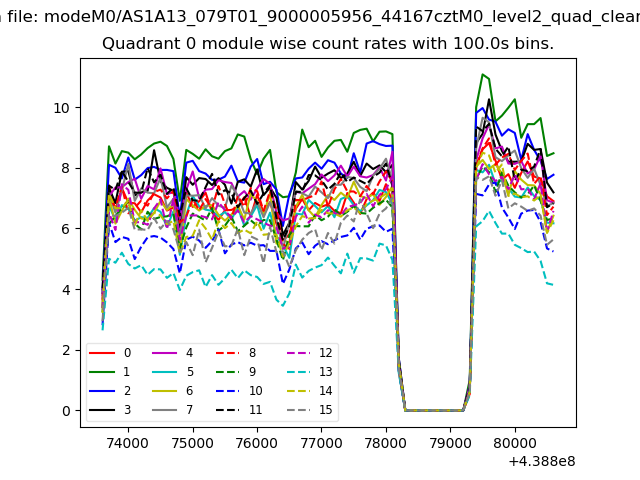 |
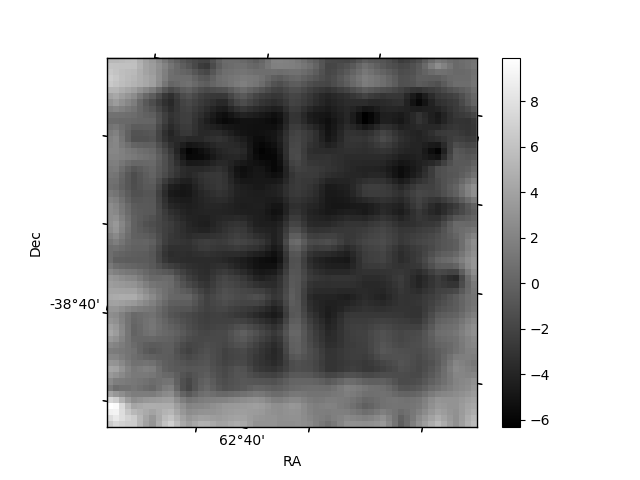 |
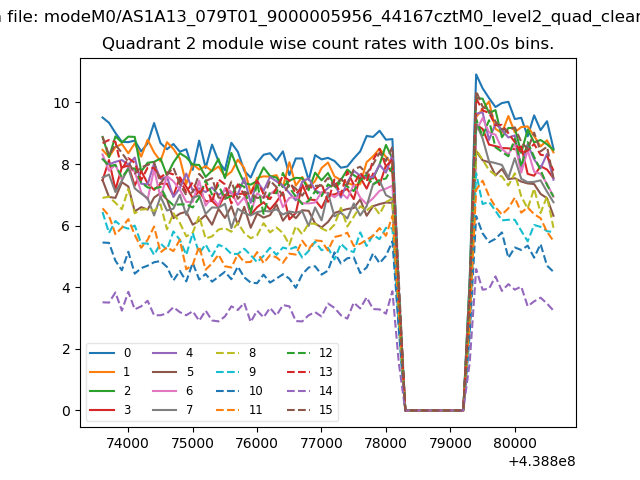
| Module-wise count rates for Quadrant B Data is divided into 100 sec bins |
 |
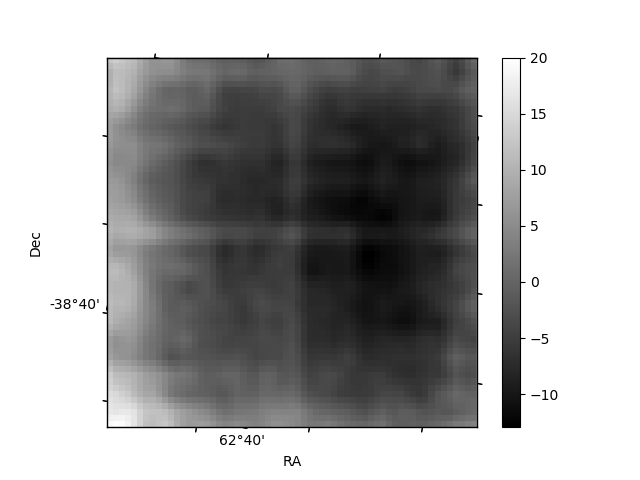 |
| Module-wise count rates for Quadrant C Data is divided into 100 sec bins |
 |
 |
| Module-wise count rates for Quadrant D Data is divided into 100 sec bins |
 |
 |
| Parameter | Plot |
|---|---|
| CZT HV Monitor | 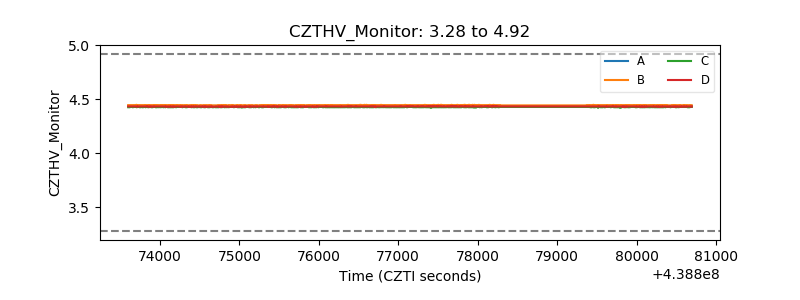 |
| D_VDD | 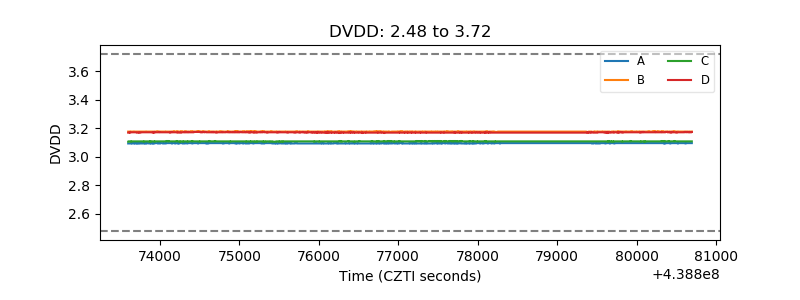 |
| Temperature 1 | 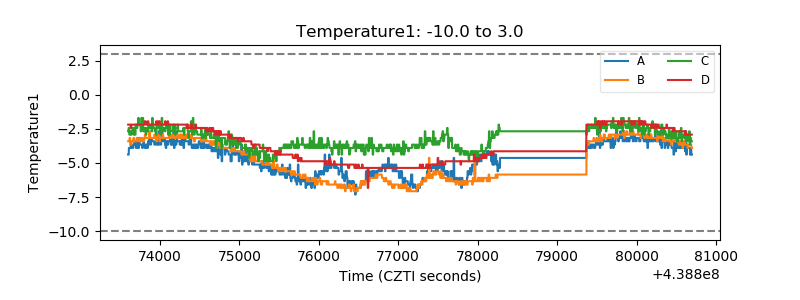 |
| Veto HV Monitor | 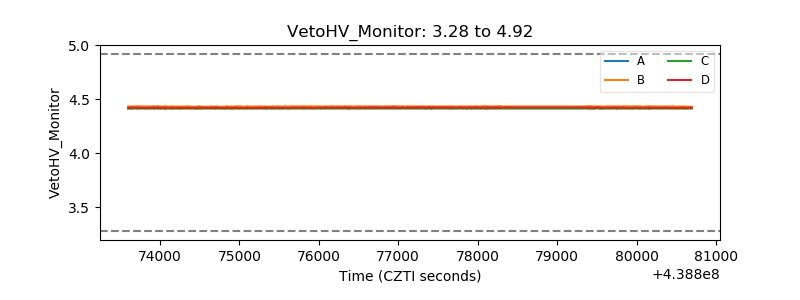 |
| Veto LLD | 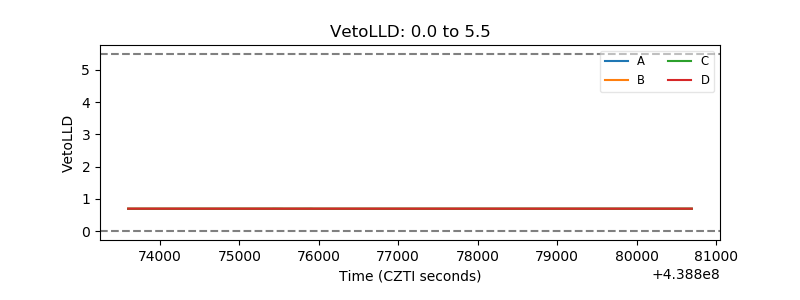 |
| Alpha Counter | 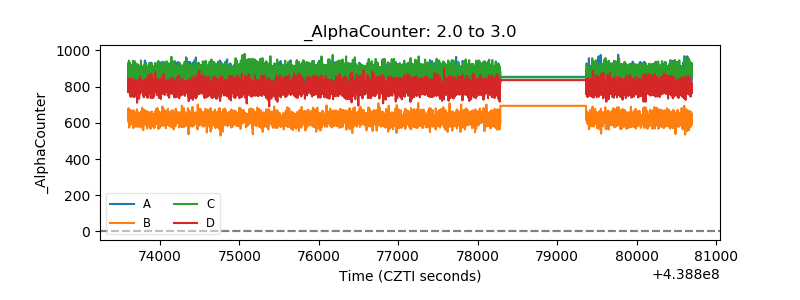 |
| _CPM_Rate | 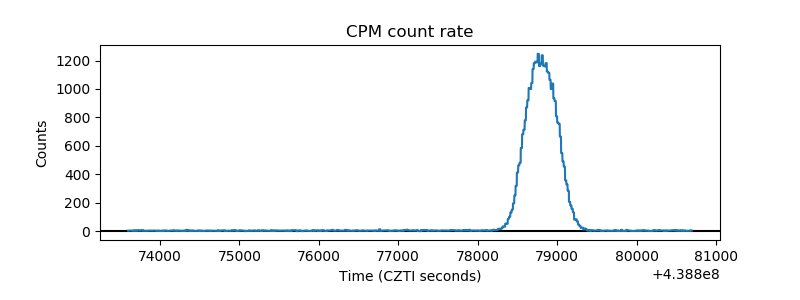 |
| CZT Counter | 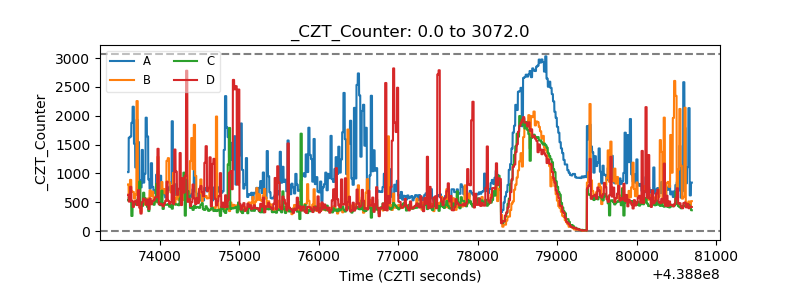 |
| +2.5 Volts monitor | 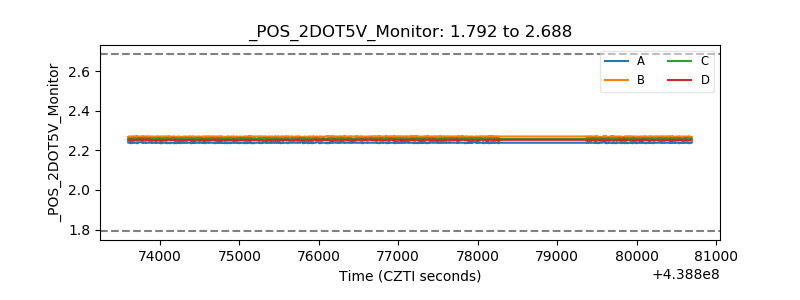 |
| +5 Volts monitor | 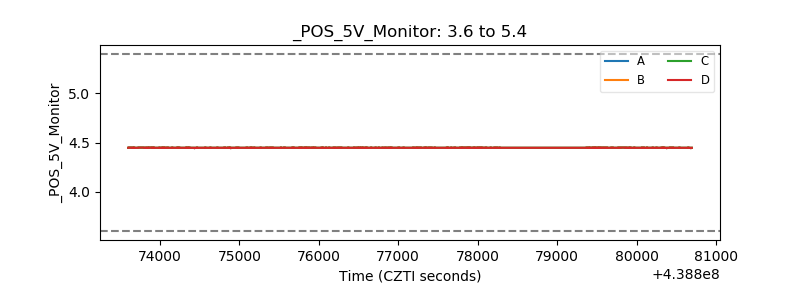 |
| _ROLL_ROT | 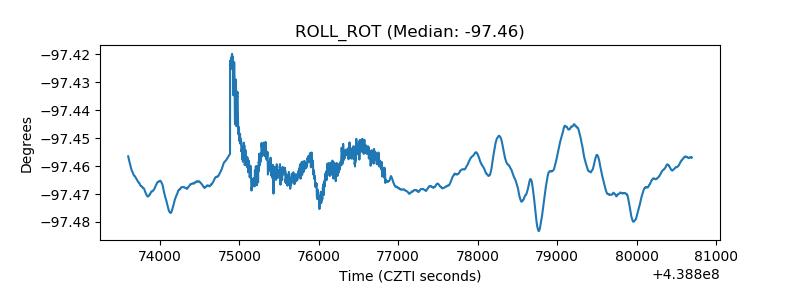 |
| _Roll_DEC | 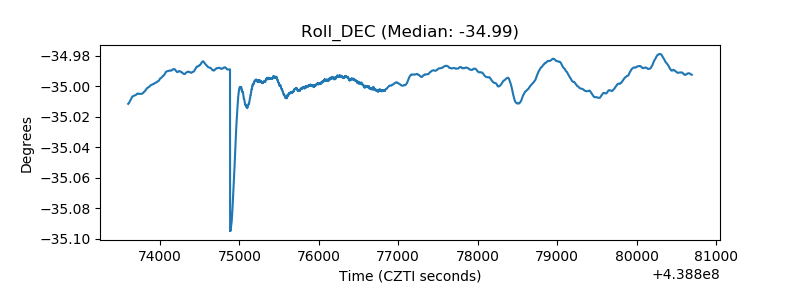 |
| _Roll_RA | 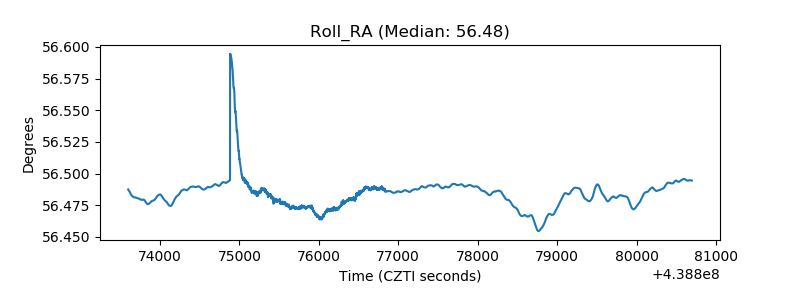 |
| Veto Counter | 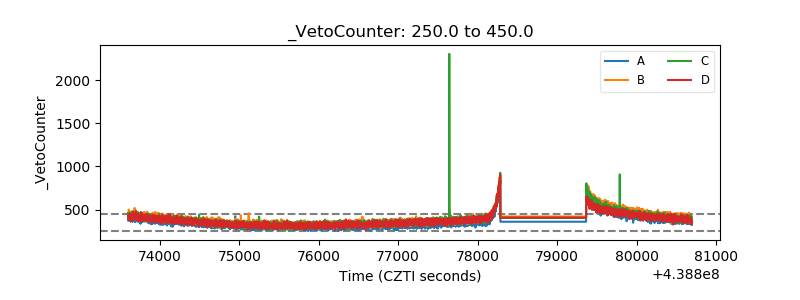 |