| Param | Original file | Final file |
|---|---|---|
| Filename | modeM0/AS1A13_079T01_9000005956_44168cztM0_level2.fits | modeM0/AS1A13_079T01_9000005956_44168cztM0_level2_quad_clean.evt |
| Size (bytes) | 534,173,760 | 113,832,000 |
| Size | 509.4 MB | 108.6 MB |
| Events in quadrant A | 6,758,201 | 759,360 |
| Events in quadrant B | 4,163,774 | 806,402 |
| Events in quadrant C | 3,188,854 | 772,182 |
| Events in quadrant D | 5,139,742 | 639,751 |
| Mode M9 | |||
|---|---|---|---|
| Quadrant | BADHDUFLAG | Total packets | Discarded packets |
| A | 0 | 23 | 0 |
| B | 0 | 23 | 0 |
| C | 0 | 23 | 0 |
| D | 0 | 23 | 0 |
| Mode M0 | |||
|---|---|---|---|
| Quadrant | BADHDUFLAG | Total packets | Discarded packets |
| A | 0 | 25179 | 2 |
| B | 0 | 17126 | 3 |
| C | 0 | 14248 | 2 |
| D | 0 | 19837 | 2 |
| Mode SS | |||
|---|---|---|---|
| Quadrant | BADHDUFLAG | Total packets | Discarded packets |
| A | 0 | 138 | 0 |
| B | 0 | 138 | 0 |
| C | 0 | 138 | 0 |
| D | 0 | 138 | 0 |
| Quadrant | Total seconds | Saturated seconds | Saturation percentage |
|---|---|---|---|
| A | 6734 | 597 | 8.865459% |
| B | 6733 | 322 | 4.782415% |
| C | 6734 | 99 | 1.470151% |
| D | 6734 | 779 | 11.568162% |
Noise dominated data is calculated using 1-second bins in cleaned event files. If a bin has >2000 counts, and if more than 50% of those come from <1% of pixels, then it is considered to be noise-dominated and hence unusable.
| Quadrant | # 1 sec bins | Bins with >0 counts | Bins with >2000 counts | High rate bins dominated by noise | Noise dominated (total time) | Noise dominated (detector-on time) | Marked lightcurve |
|---|---|---|---|---|---|---|---|
| A | 8994 | 6737 | 359 | 359 | 3.99% | 5.33% | 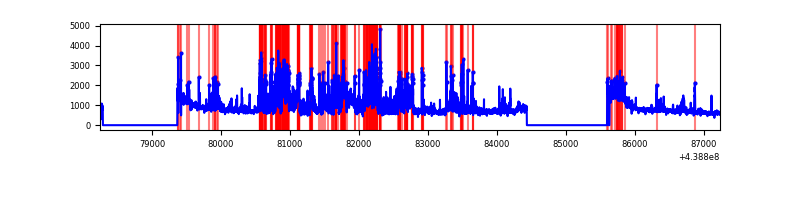 |
| B | 8993 | 6736 | 132 | 132 | 1.47% | 1.96% | 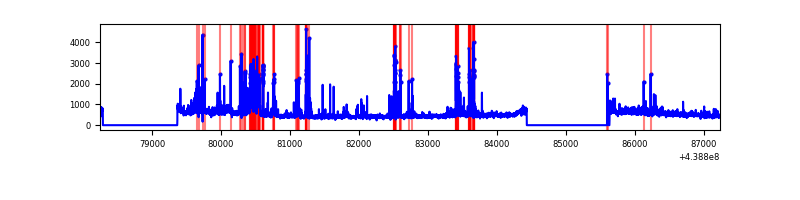 |
| C | 8994 | 6737 | 13 | 13 | 0.14% | 0.19% | 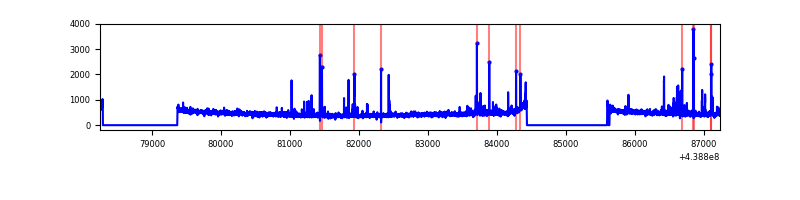 |
| D | 8994 | 6737 | 613 | 613 | 6.82% | 9.10% | 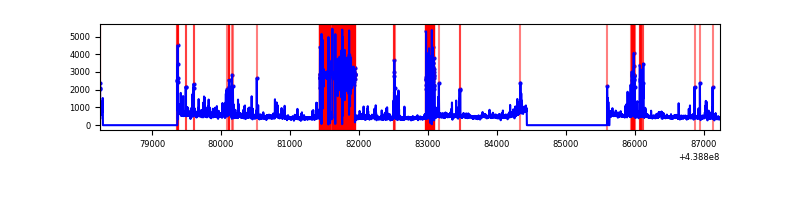 |
Top three noisy pixels from each quadrant. If the there are fewer than three noisy pixels in the level2.evt file, extra rows are filled as -1
| Pixel properties | Quadrant properties | ||||||
|---|---|---|---|---|---|---|---|
| Quadrant | DetID | PixID | Counts | Sigma | Mean | Median | Sigma |
| A | 15 | 223 | 2231478 | 13758.69 | 784 | 770 | 162.1 |
| A | 10 | 83 | 1455773 | 8974.25 | 784 | 770 | 162.1 |
| A | 13 | 6 | 15222 | 89.14 | 784 | 770 | 162.1 |
| B | 5 | 172 | 387077 | 2512.8 | 787 | 765 | 153.7 |
| B | 5 | 255 | 294692 | 1911.87 | 787 | 765 | 153.7 |
| B | 0 | 219 | 225535 | 1462.03 | 787 | 765 | 153.7 |
| C | 14 | 254 | 105904 | 583.85 | 769 | 775 | 180.1 |
| C | 15 | 208 | 27253 | 147.05 | 769 | 775 | 180.1 |
| C | 1 | 16 | 20097 | 107.31 | 769 | 775 | 180.1 |
| D | 13 | 187 | 1606053 | 8811.68 | 724 | 701 | 182.2 |
| D | 5 | 235 | 198312 | 1084.67 | 724 | 701 | 182.2 |
| D | 1 | 52 | 138874 | 758.42 | 724 | 701 | 182.2 |
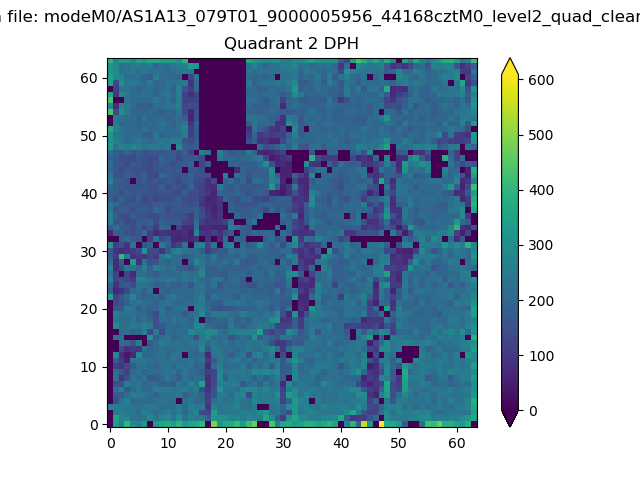
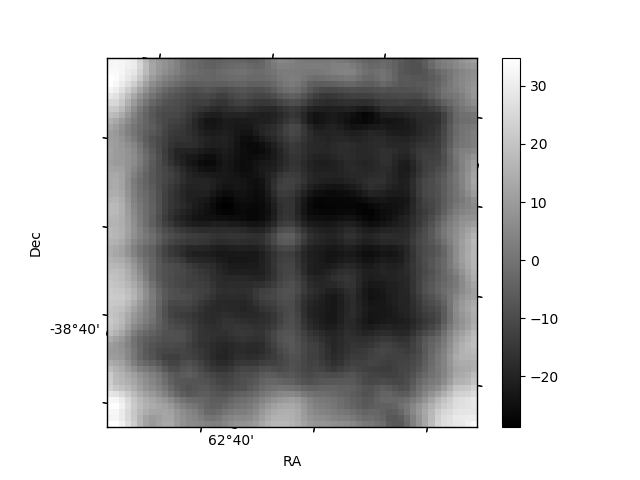
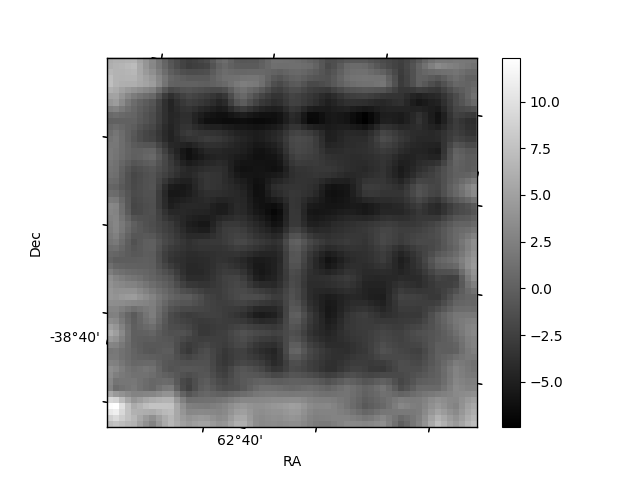
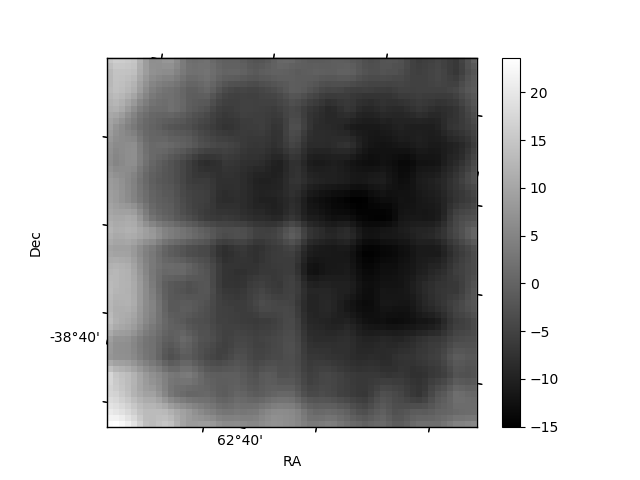
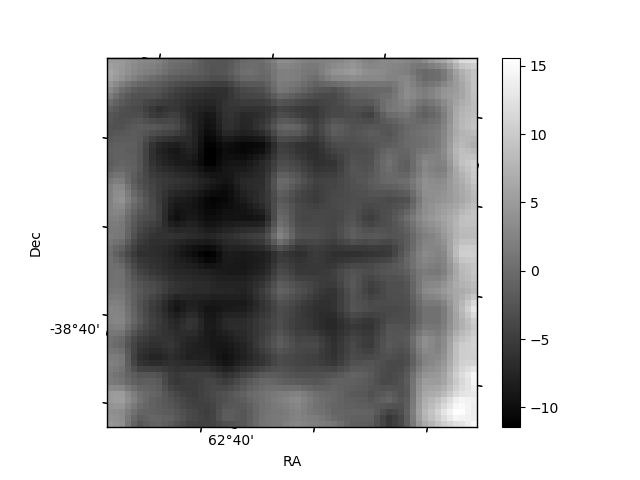
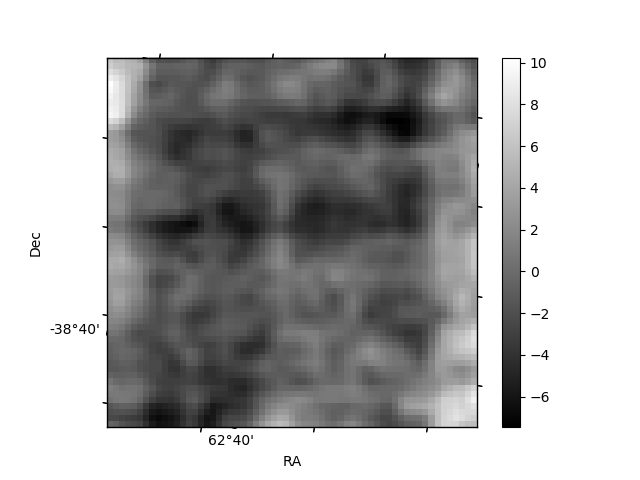
Histogram calculated using DETX and DETY for each event in the final _common_clean file
| Quadrant A | 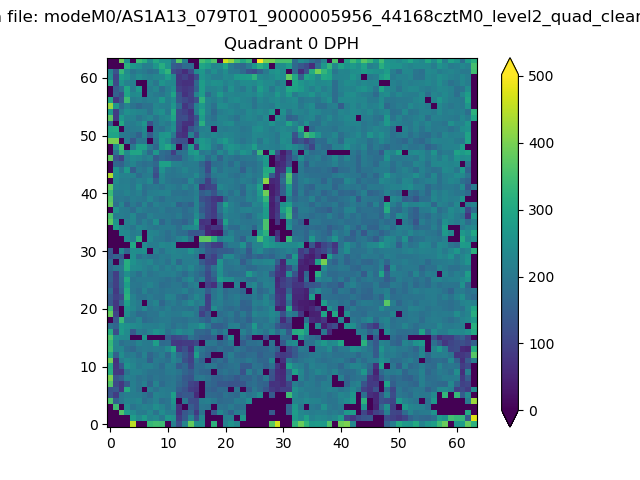 |
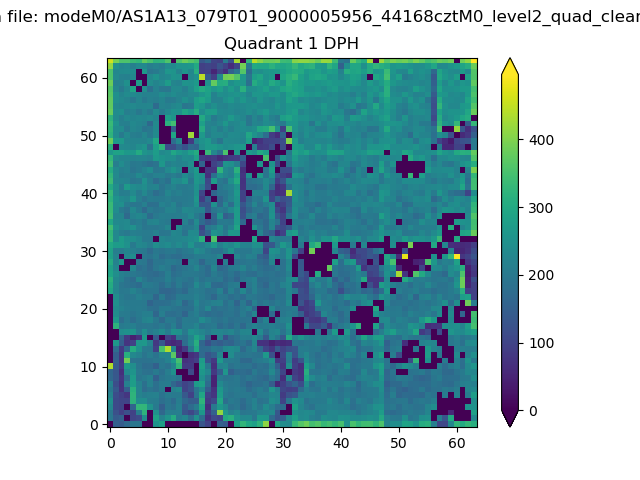 |
Quadrant B |
|---|---|---|---|
| Quadrant D | 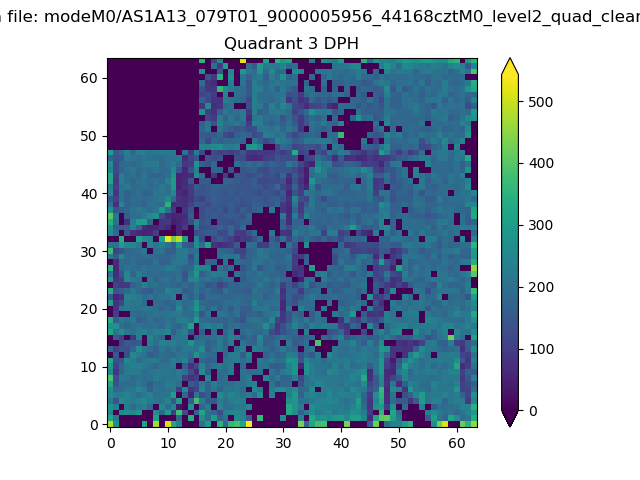 |
 |
Quadrant C |
| Plot type | Count rate plots | Images |
|---|---|---|
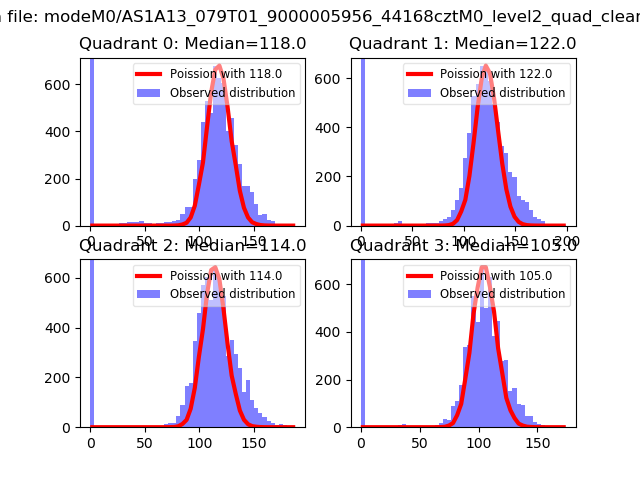
| Comparison with Poisson distribution Blue bars denote a histogram of data divided into 1 sec bins. Red curve is a Poisson curve with rate = median count rate of data. |
 |
 |
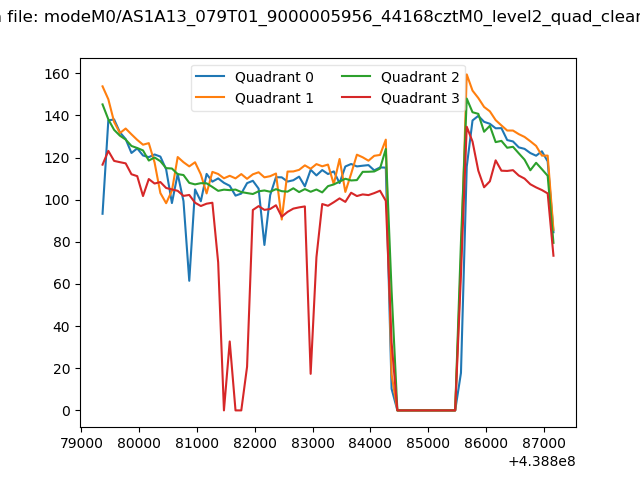
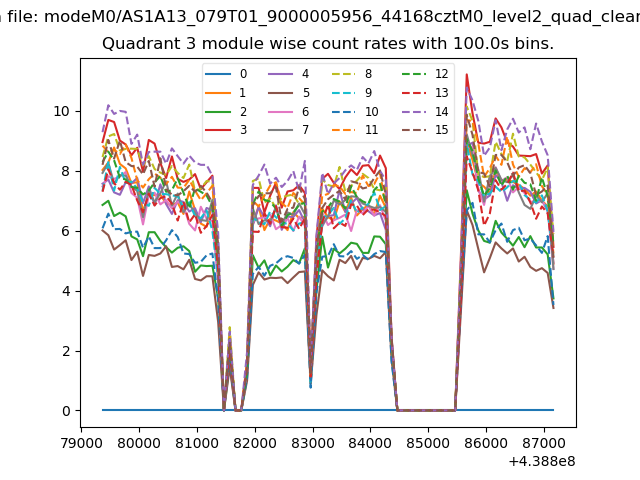
| Quadrant-wise count rates Data is divided into 100 sec bins |
 |
|
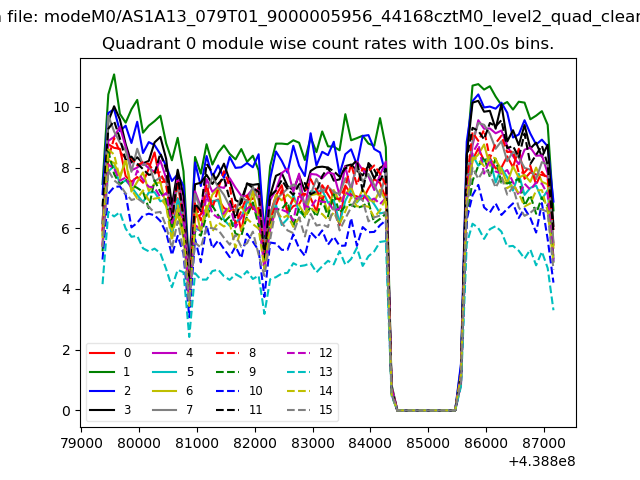
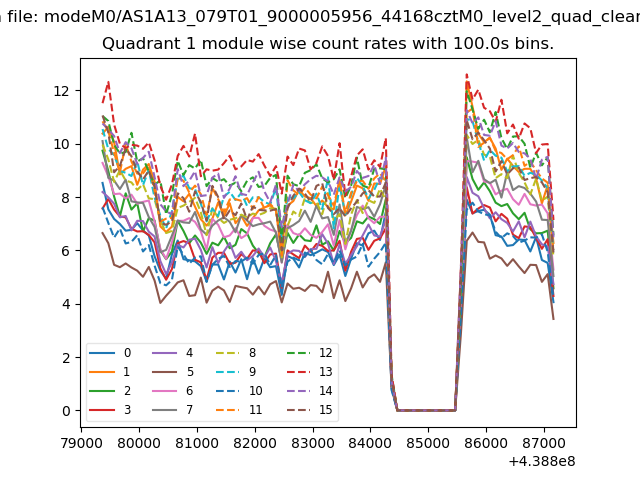
| Module-wise count rates for Quadrant A Data is divided into 100 sec bins |
 |
 |
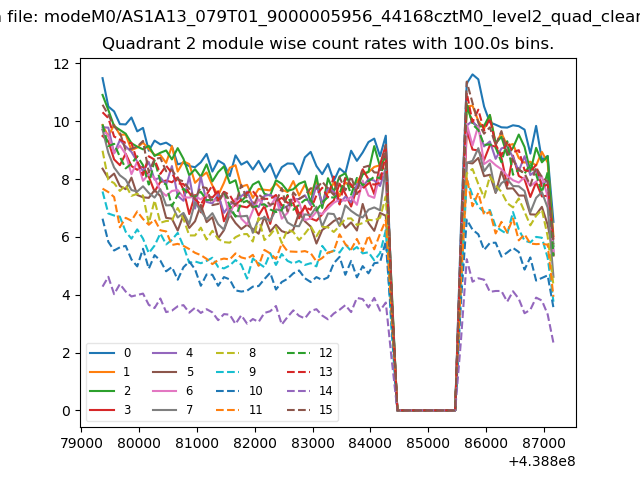
| Module-wise count rates for Quadrant B Data is divided into 100 sec bins |
 |
 |
| Module-wise count rates for Quadrant C Data is divided into 100 sec bins |
 |
 |
| Module-wise count rates for Quadrant D Data is divided into 100 sec bins |
 |
 |
| Parameter | Plot |
|---|---|
| CZT HV Monitor | 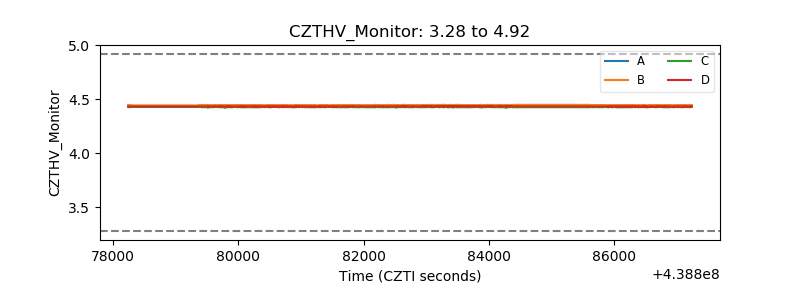 |
| D_VDD | 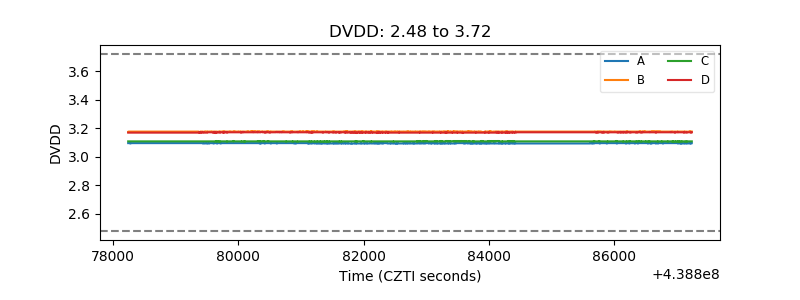 |
| Temperature 1 | 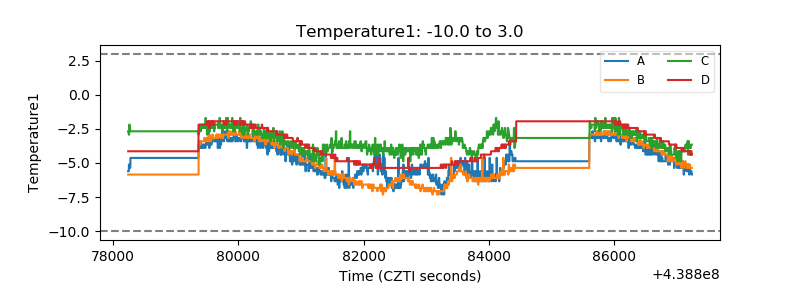 |
| Veto HV Monitor | 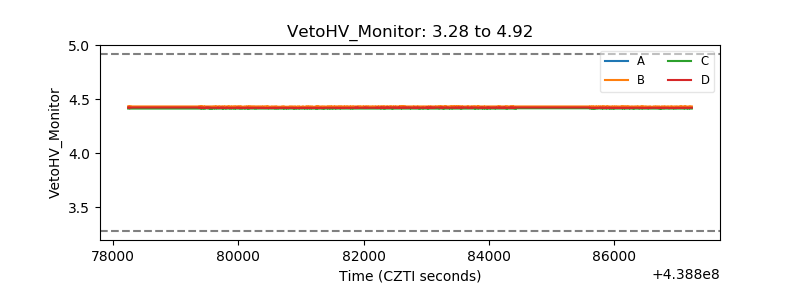 |
| Veto LLD | 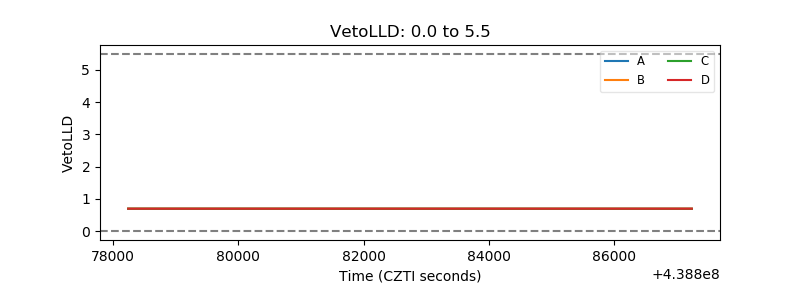 |
| Alpha Counter | 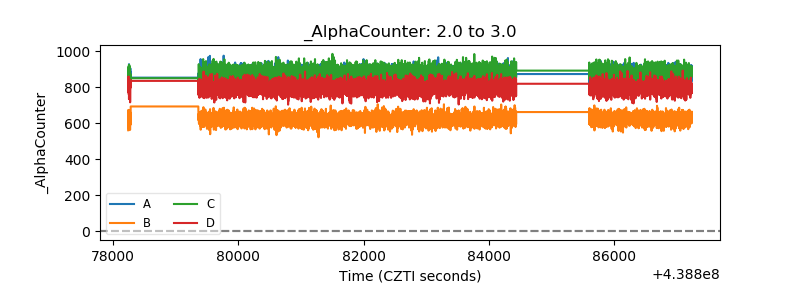 |
| _CPM_Rate | 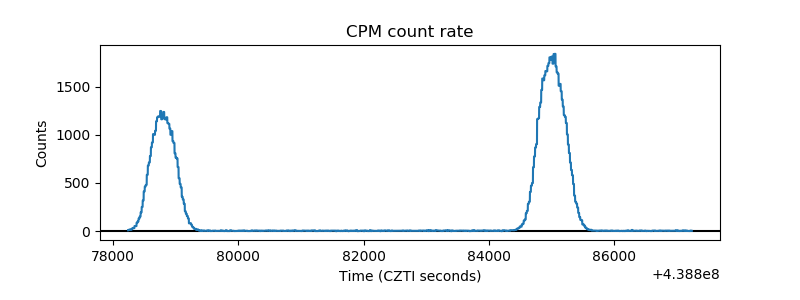 |
| CZT Counter | 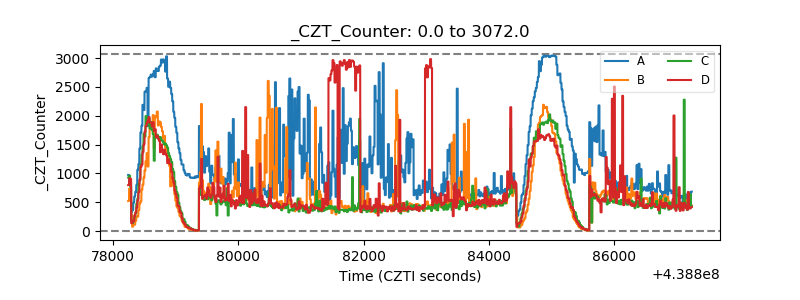 |
| +2.5 Volts monitor | 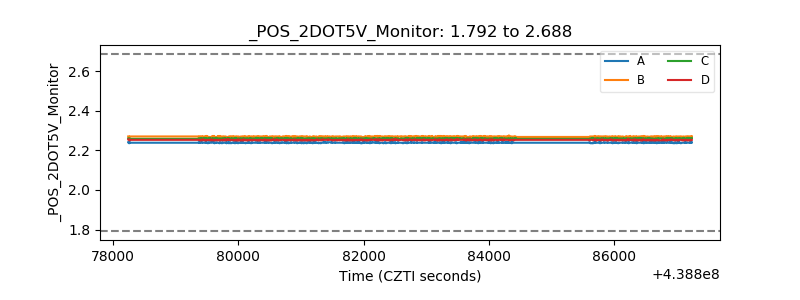 |
| +5 Volts monitor | 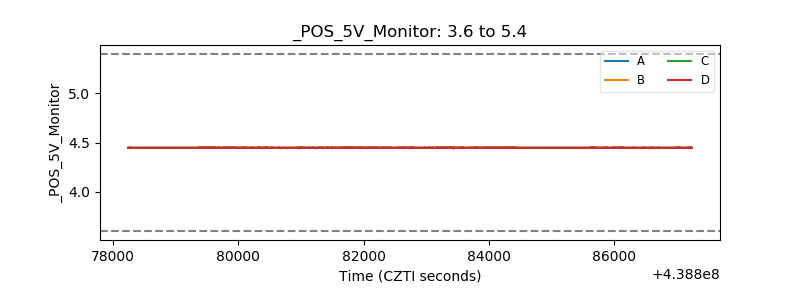 |
| _ROLL_ROT | 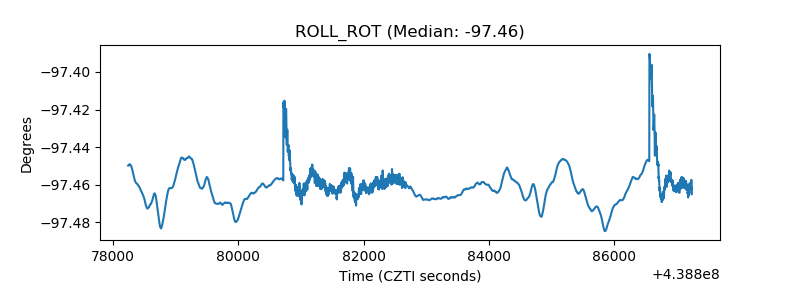 |
| _Roll_DEC | 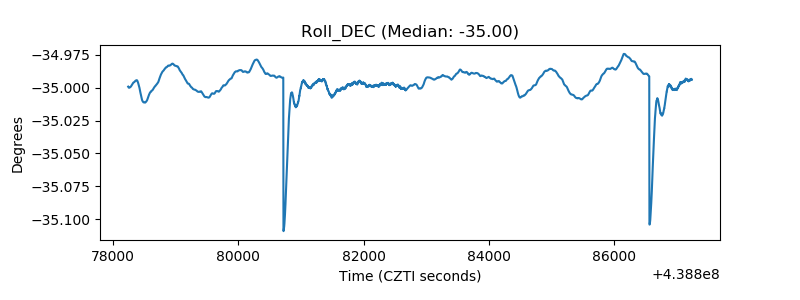 |
| _Roll_RA | 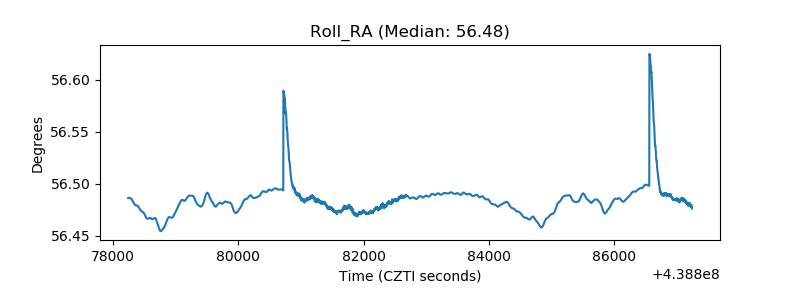 |
| Veto Counter | 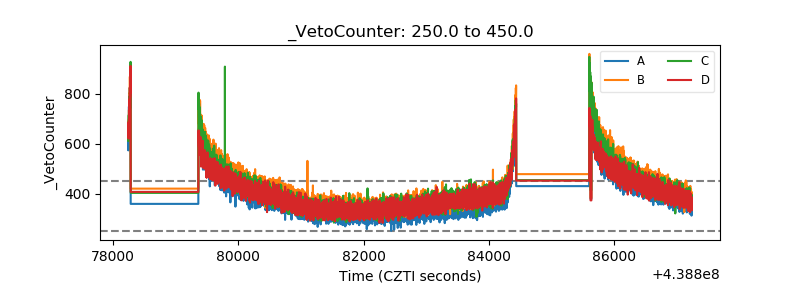 |