| Param | Original file | Final file |
|---|---|---|
| Filename | modeM0/AS1A13_079T01_9000005956_44169cztM0_level2.fits | modeM0/AS1A13_079T01_9000005956_44169cztM0_level2_quad_clean.evt |
| Size (bytes) | 464,376,960 | 118,229,760 |
| Size | 442.9 MB | 112.8 MB |
| Events in quadrant A | 4,813,774 | 801,635 |
| Events in quadrant B | 3,751,576 | 838,161 |
| Events in quadrant C | 3,234,850 | 787,809 |
| Events in quadrant D | 4,871,673 | 687,878 |
| Mode M9 | |||
|---|---|---|---|
| Quadrant | BADHDUFLAG | Total packets | Discarded packets |
| A | 0 | 12 | 0 |
| B | 0 | 12 | 0 |
| C | 0 | 12 | 0 |
| D | 0 | 12 | 0 |
| Mode M0 | |||
|---|---|---|---|
| Quadrant | BADHDUFLAG | Total packets | Discarded packets |
| A | 0 | 19224 | 2 |
| B | 0 | 15669 | 2 |
| C | 0 | 14296 | 2 |
| D | 0 | 19205 | 2 |
| Mode SS | |||
|---|---|---|---|
| Quadrant | BADHDUFLAG | Total packets | Discarded packets |
| A | 0 | 136 | 0 |
| B | 0 | 136 | 0 |
| C | 0 | 136 | 0 |
| D | 0 | 136 | 0 |
| Quadrant | Total seconds | Saturated seconds | Saturation percentage |
|---|---|---|---|
| A | 6667 | 215 | 3.224839% |
| B | 6668 | 174 | 2.609478% |
| C | 6668 | 59 | 0.884823% |
| D | 6668 | 353 | 5.293941% |
Noise dominated data is calculated using 1-second bins in cleaned event files. If a bin has >2000 counts, and if more than 50% of those come from <1% of pixels, then it is considered to be noise-dominated and hence unusable.
| Quadrant | # 1 sec bins | Bins with >0 counts | Bins with >2000 counts | High rate bins dominated by noise | Noise dominated (total time) | Noise dominated (detector-on time) | Marked lightcurve |
|---|---|---|---|---|---|---|---|
| A | 7907 | 6669 | 24 | 24 | 0.30% | 0.36% | 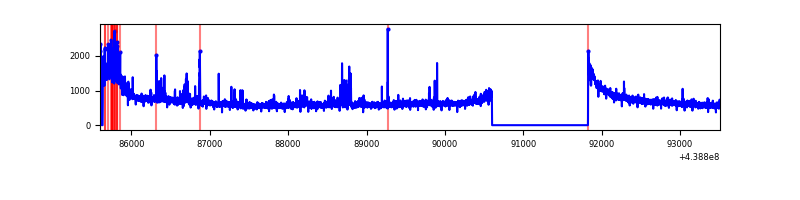 |
| B | 7908 | 6670 | 55 | 55 | 0.70% | 0.82% | 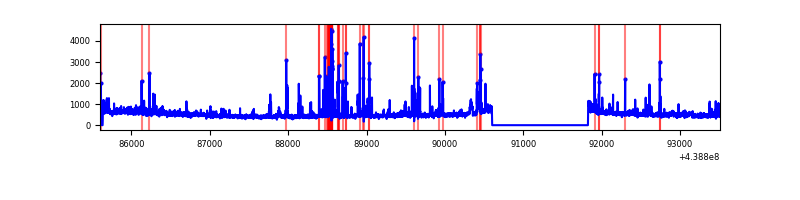 |
| C | 7908 | 6670 | 21 | 21 | 0.27% | 0.31% | 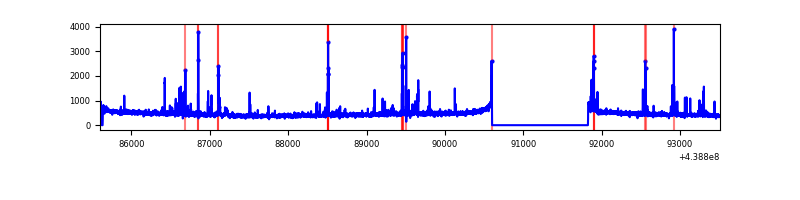 |
| D | 7908 | 6669 | 231 | 231 | 2.92% | 3.46% | 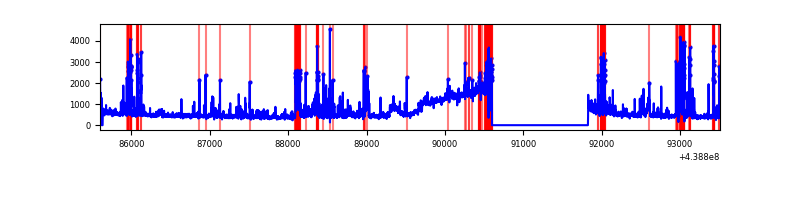 |
Top three noisy pixels from each quadrant. If the there are fewer than three noisy pixels in the level2.evt file, extra rows are filled as -1
| Pixel properties | Quadrant properties | ||||||
|---|---|---|---|---|---|---|---|
| Quadrant | DetID | PixID | Counts | Sigma | Mean | Median | Sigma |
| A | 10 | 83 | 1442076 | 8863.1 | 788 | 774 | 162.6 |
| A | 15 | 223 | 281303 | 1725.08 | 788 | 774 | 162.6 |
| A | 2 | 79 | 13425 | 77.8 | 788 | 774 | 162.6 |
| B | 5 | 172 | 378954 | 2475.57 | 790 | 767 | 152.8 |
| B | 0 | 219 | 90872 | 589.82 | 790 | 767 | 152.8 |
| B | 0 | 230 | 60588 | 391.58 | 790 | 767 | 152.8 |
| C | 14 | 254 | 169229 | 945.06 | 762 | 767 | 178.3 |
| C | 15 | 208 | 47793 | 263.81 | 762 | 767 | 178.3 |
| C | 1 | 16 | 25330 | 137.8 | 762 | 767 | 178.3 |
| D | 13 | 187 | 997823 | 5376.16 | 738 | 716 | 185.5 |
| D | 13 | 249 | 597119 | 3215.66 | 738 | 716 | 185.5 |
| D | 2 | 249 | 104587 | 560.04 | 738 | 716 | 185.5 |
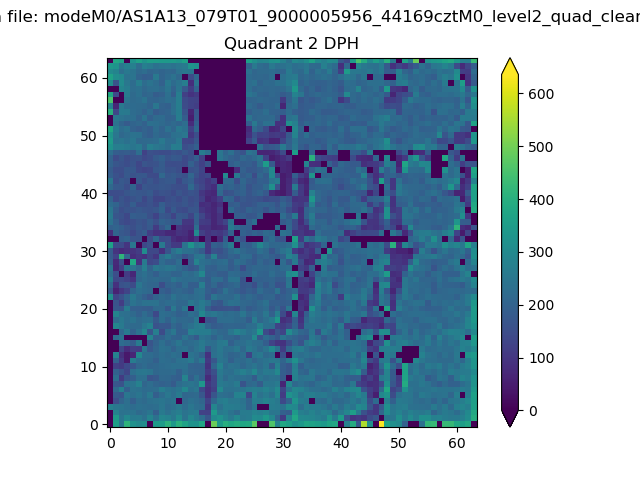
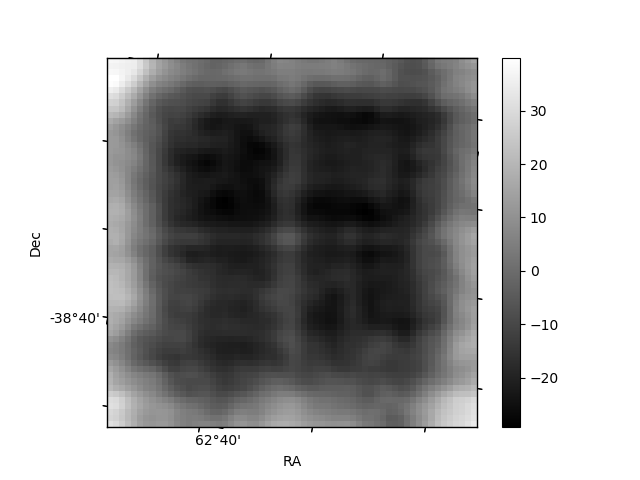
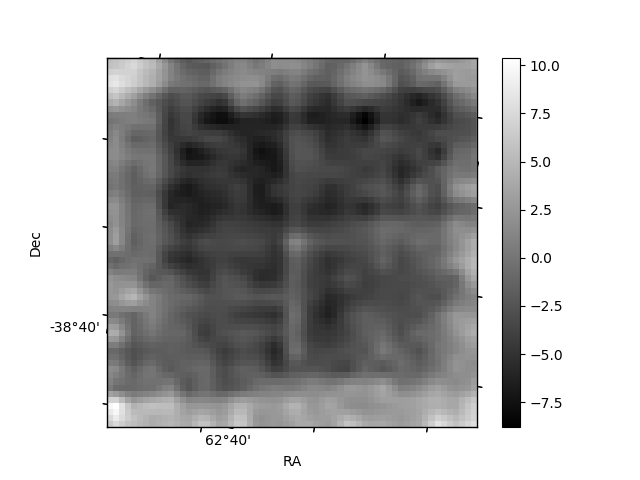
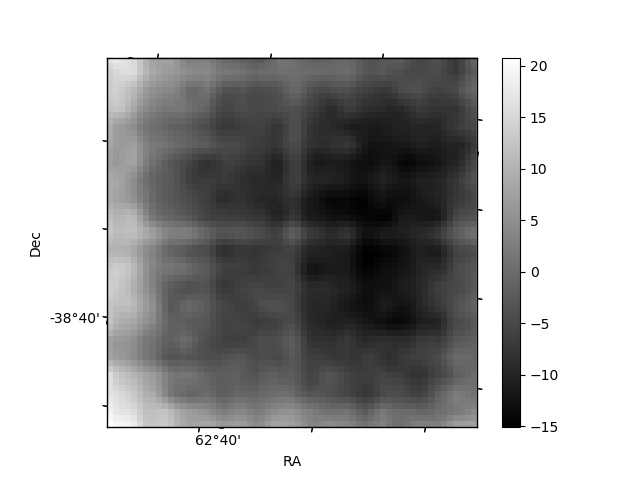
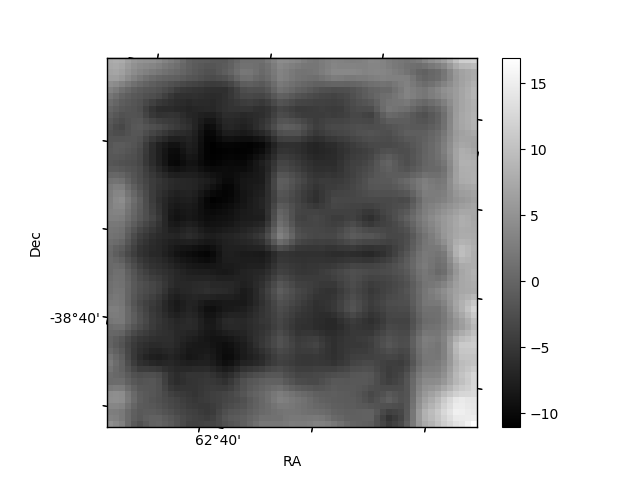
Histogram calculated using DETX and DETY for each event in the final _common_clean file
| Quadrant A | 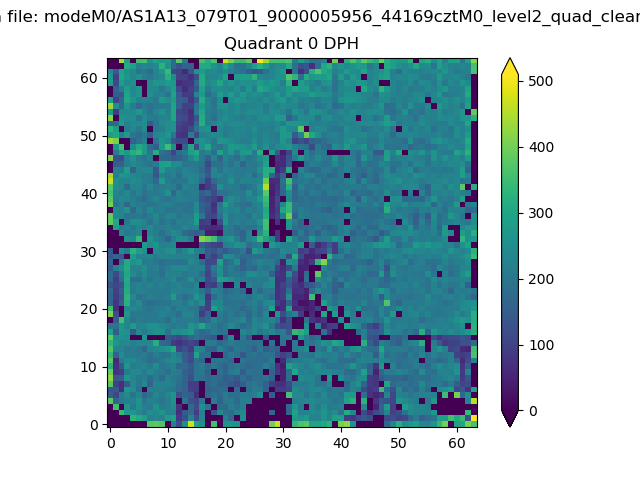 |
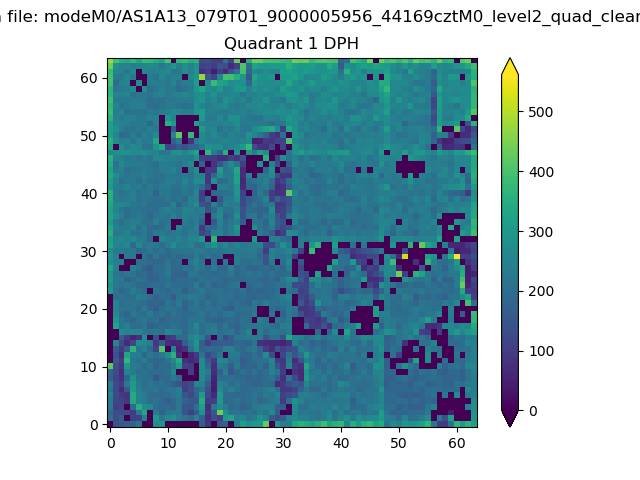 |
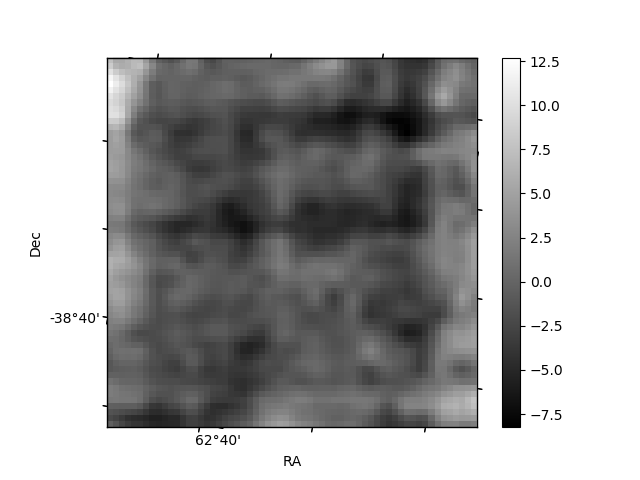
Quadrant B |
|---|---|---|---|
| Quadrant D | 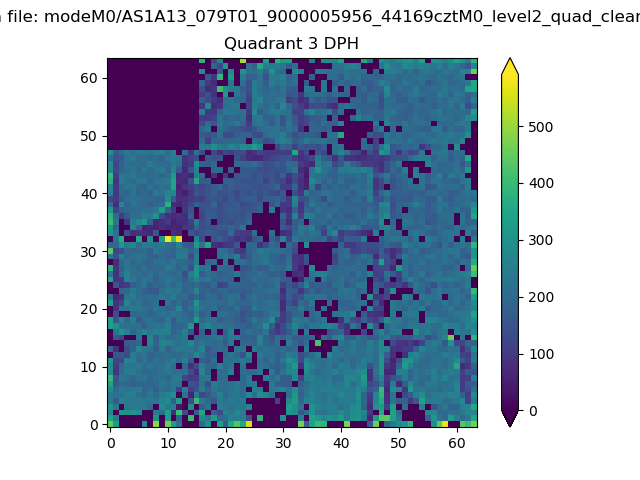 |
 |
Quadrant C |
| Plot type | Count rate plots | Images |
|---|---|---|
| Comparison with Poisson distribution Blue bars denote a histogram of data divided into 1 sec bins. Red curve is a Poisson curve with rate = median count rate of data. |
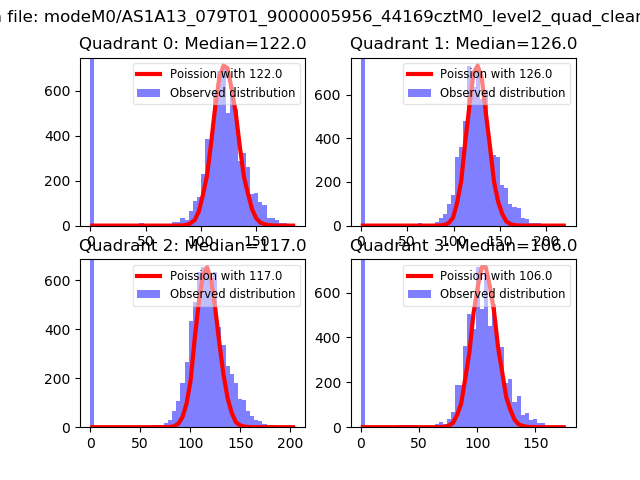 |
 |
| Quadrant-wise count rates Data is divided into 100 sec bins |
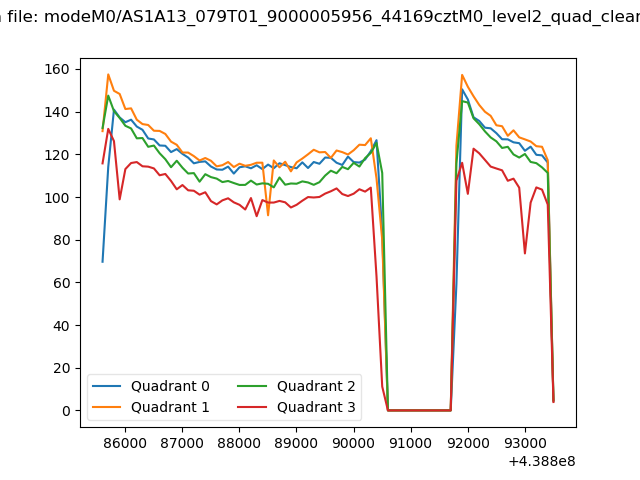 |
|
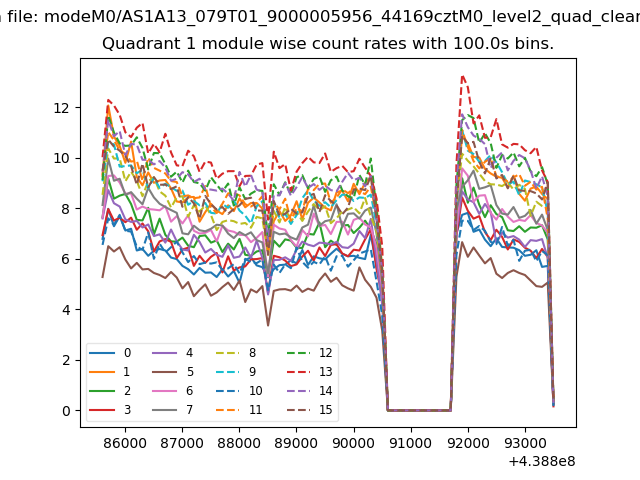
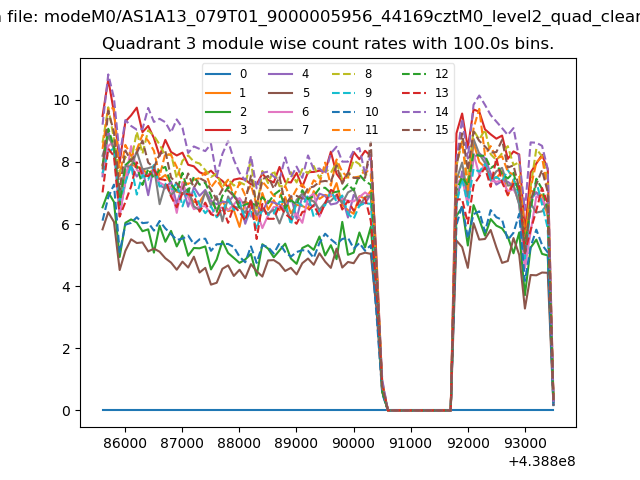
| Module-wise count rates for Quadrant A Data is divided into 100 sec bins |
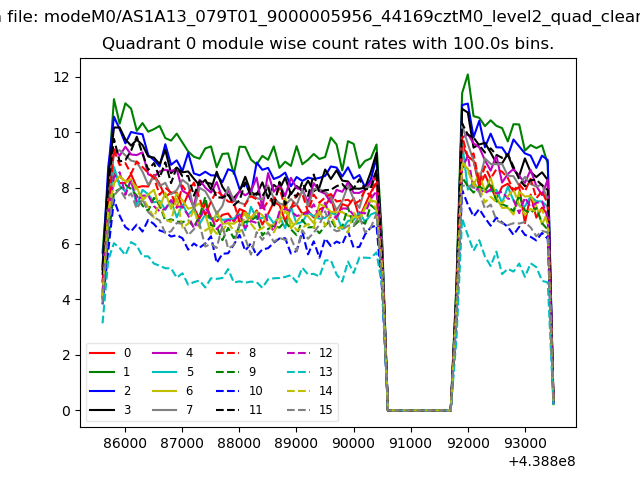 |
 |
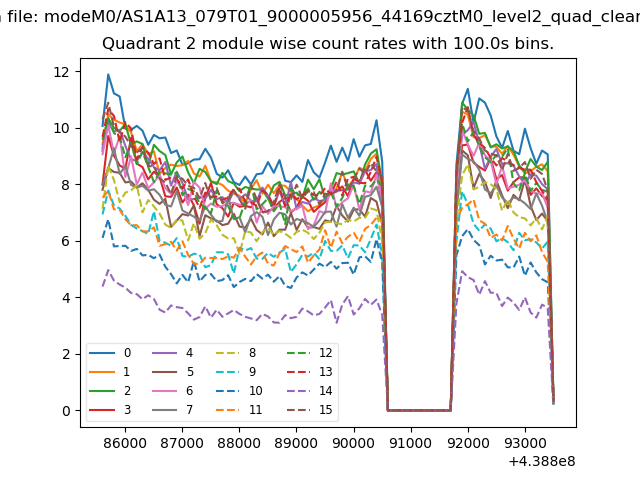
| Module-wise count rates for Quadrant B Data is divided into 100 sec bins |
 |
 |
| Module-wise count rates for Quadrant C Data is divided into 100 sec bins |
 |
 |
| Module-wise count rates for Quadrant D Data is divided into 100 sec bins |
 |
 |
| Parameter | Plot |
|---|---|
| CZT HV Monitor | 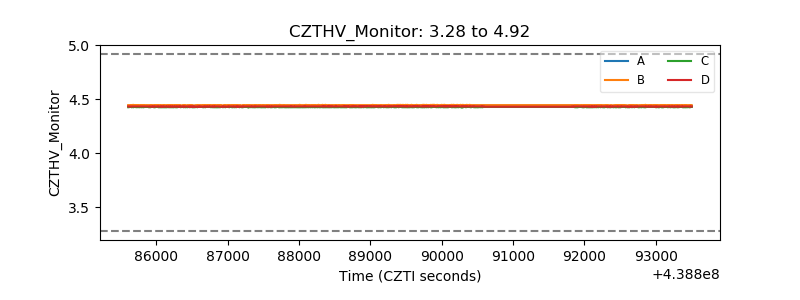 |
| D_VDD | 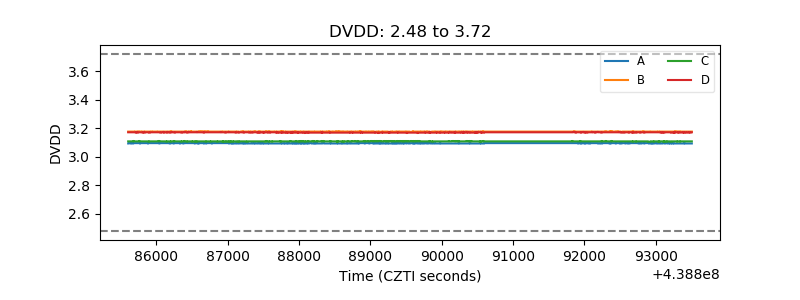 |
| Temperature 1 | 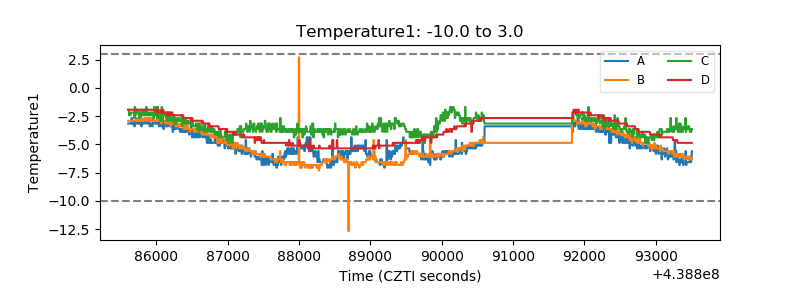 |
| Veto HV Monitor | 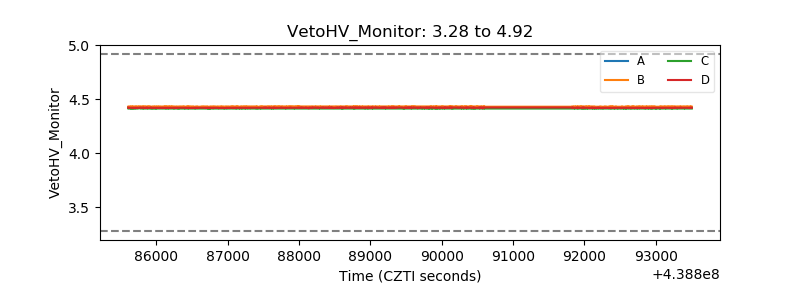 |
| Veto LLD | 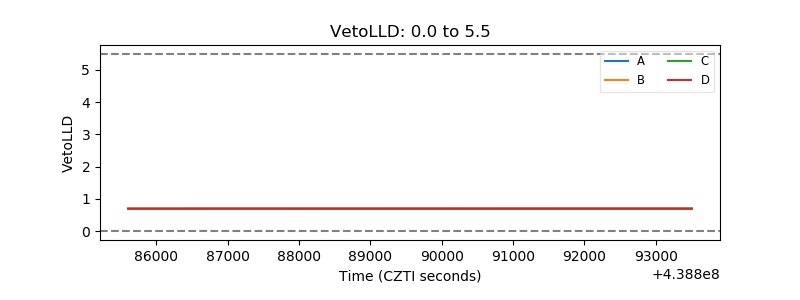 |
| Alpha Counter | 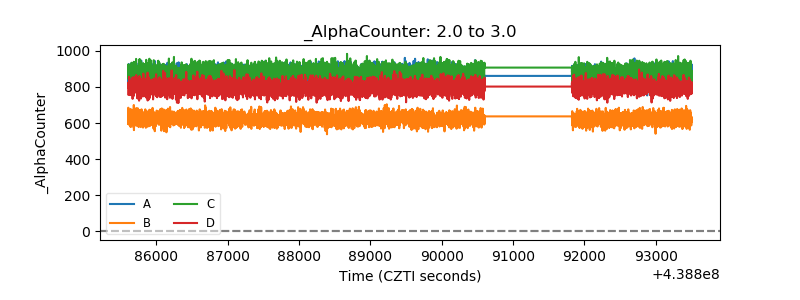 |
| _CPM_Rate | 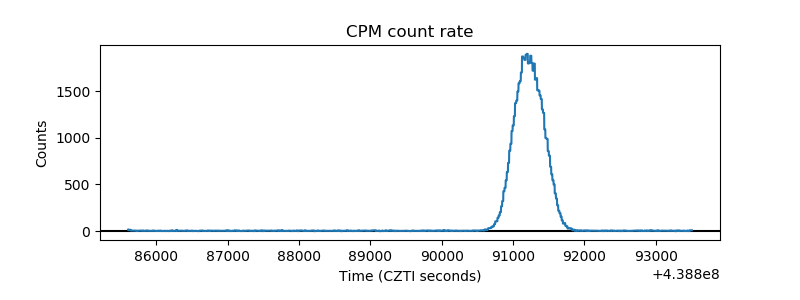 |
| CZT Counter | 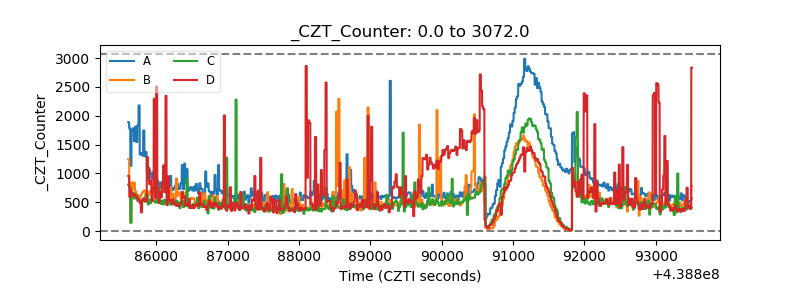 |
| +2.5 Volts monitor | 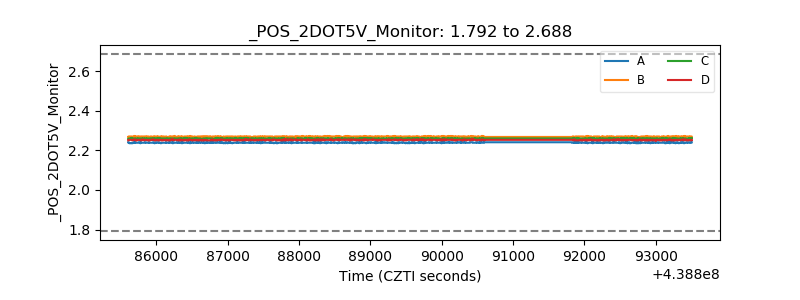 |
| +5 Volts monitor | 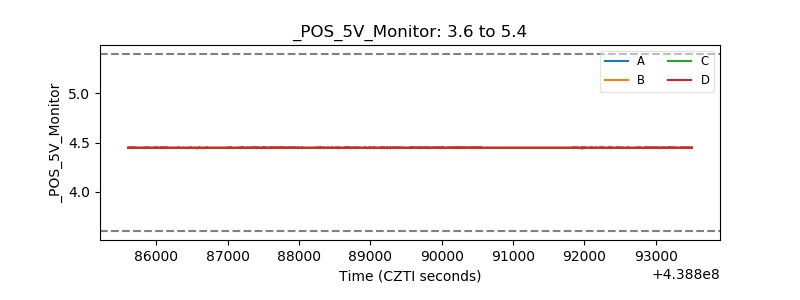 |
| _ROLL_ROT | 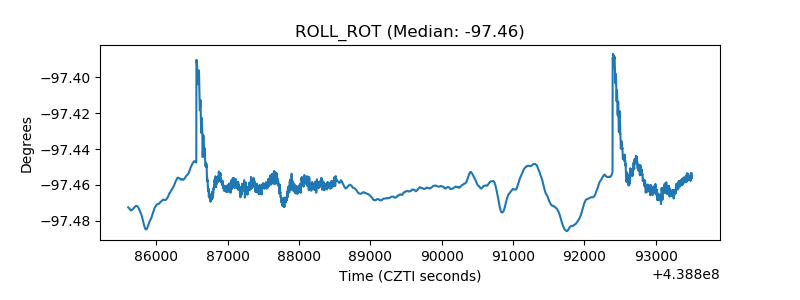 |
| _Roll_DEC | 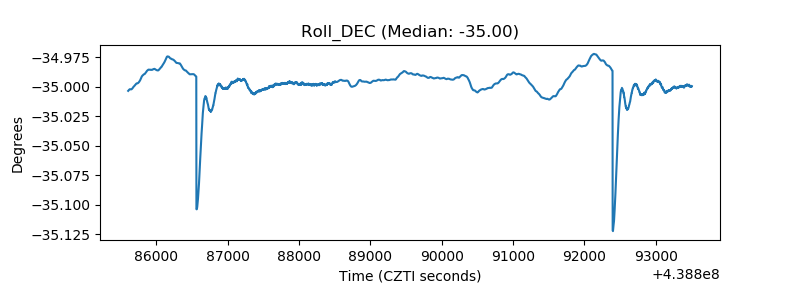 |
| _Roll_RA | 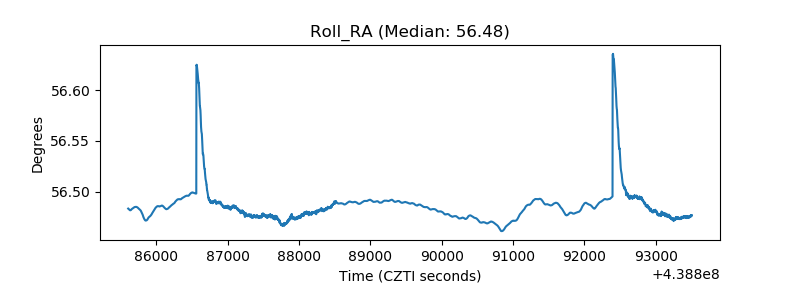 |
| Veto Counter | 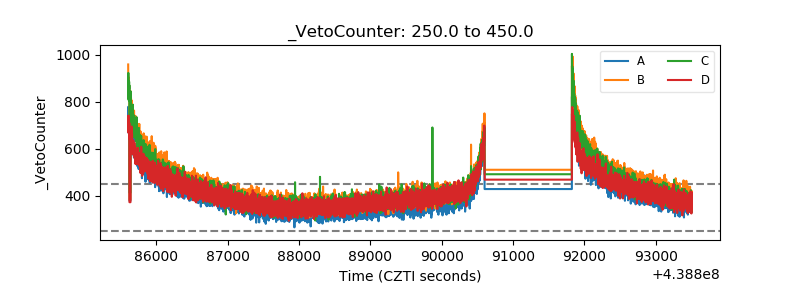 |