| Param | Original file | Final file |
|---|---|---|
| Filename | modeM0/AS1A13_079T01_9000005956_44170cztM0_level2.fits | modeM0/AS1A13_079T01_9000005956_44170cztM0_level2_quad_clean.evt |
| Size (bytes) | 459,599,040 | 111,957,120 |
| Size | 438.3 MB | 106.8 MB |
| Events in quadrant A | 4,316,761 | 770,531 |
| Events in quadrant B | 4,012,436 | 777,552 |
| Events in quadrant C | 3,000,830 | 753,296 |
| Events in quadrant D | 5,182,759 | 639,977 |
| Mode M9 | |||
|---|---|---|---|
| Quadrant | BADHDUFLAG | Total packets | Discarded packets |
| A | 0 | 12 | 0 |
| B | 0 | 12 | 0 |
| C | 0 | 12 | 0 |
| D | 0 | 12 | 0 |
| Mode M0 | |||
|---|---|---|---|
| Quadrant | BADHDUFLAG | Total packets | Discarded packets |
| A | 0 | 17365 | 1 |
| B | 0 | 16216 | 1 |
| C | 0 | 13592 | 1 |
| D | 0 | 19950 | 2 |
| Mode SS | |||
|---|---|---|---|
| Quadrant | BADHDUFLAG | Total packets | Discarded packets |
| A | 0 | 130 | 0 |
| B | 0 | 130 | 0 |
| C | 0 | 130 | 0 |
| D | 0 | 130 | 0 |
| Quadrant | Total seconds | Saturated seconds | Saturation percentage |
|---|---|---|---|
| A | 6435 | 137 | 2.128982% |
| B | 6435 | 361 | 5.609946% |
| C | 6436 | 35 | 0.543816% |
| D | 6435 | 467 | 7.257187% |
Noise dominated data is calculated using 1-second bins in cleaned event files. If a bin has >2000 counts, and if more than 50% of those come from <1% of pixels, then it is considered to be noise-dominated and hence unusable.
| Quadrant | # 1 sec bins | Bins with >0 counts | Bins with >2000 counts | High rate bins dominated by noise | Noise dominated (total time) | Noise dominated (detector-on time) | Marked lightcurve |
|---|---|---|---|---|---|---|---|
| A | 7645 | 6436 | 14 | 14 | 0.18% | 0.22% | 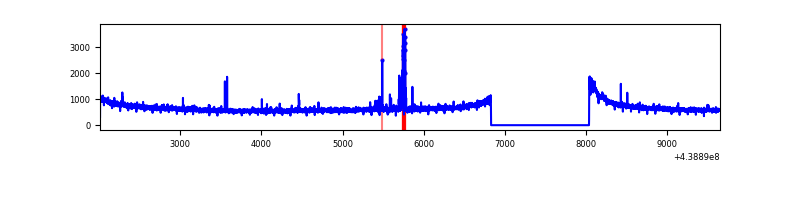 |
| B | 7645 | 6436 | 185 | 185 | 2.42% | 2.87% | 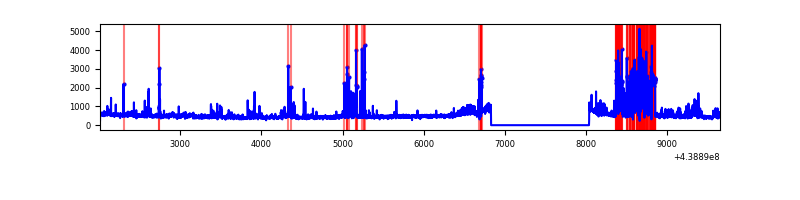 |
| C | 7646 | 6437 | 13 | 13 | 0.17% | 0.20% | 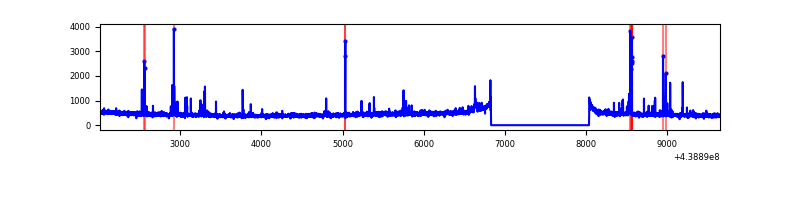 |
| D | 7645 | 6436 | 366 | 366 | 4.79% | 5.69% | 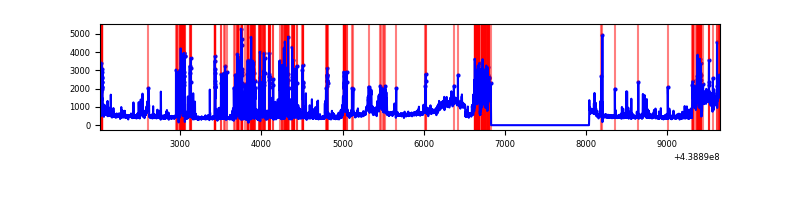 |
Top three noisy pixels from each quadrant. If the there are fewer than three noisy pixels in the level2.evt file, extra rows are filled as -1
| Pixel properties | Quadrant properties | ||||||
|---|---|---|---|---|---|---|---|
| Quadrant | DetID | PixID | Counts | Sigma | Mean | Median | Sigma |
| A | 10 | 83 | 1307542 | 8442.09 | 750 | 737 | 154.8 |
| A | 15 | 223 | 78785 | 504.2 | 750 | 737 | 154.8 |
| A | 13 | 6 | 10439 | 62.68 | 750 | 737 | 154.8 |
| B | 5 | 172 | 745814 | 5170.85 | 740 | 719 | 144.1 |
| B | 0 | 189 | 122975 | 848.44 | 740 | 719 | 144.1 |
| B | 0 | 219 | 81238 | 558.79 | 740 | 719 | 144.1 |
| C | 14 | 254 | 157699 | 911.5 | 726 | 730 | 172.2 |
| C | 8 | 13 | 4916 | 24.31 | 726 | 730 | 172.2 |
| C | 13 | 61 | 4873 | 24.06 | 726 | 730 | 172.2 |
| D | 13 | 249 | 947951 | 5450.38 | 693 | 672 | 173.8 |
| D | 13 | 187 | 662866 | 3810.08 | 693 | 672 | 173.8 |
| D | 5 | 235 | 312137 | 1792.08 | 693 | 672 | 173.8 |
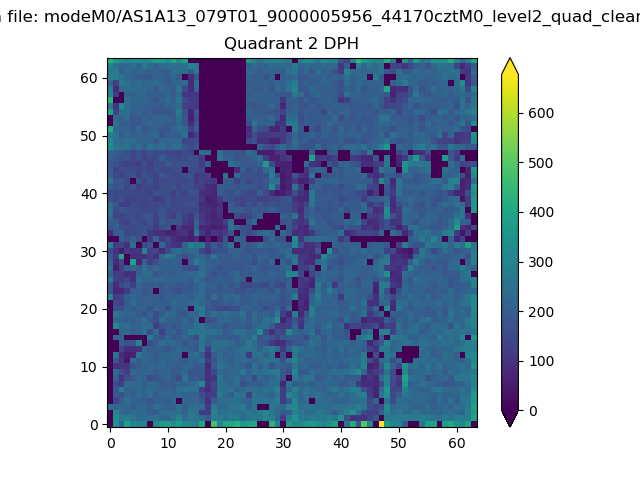
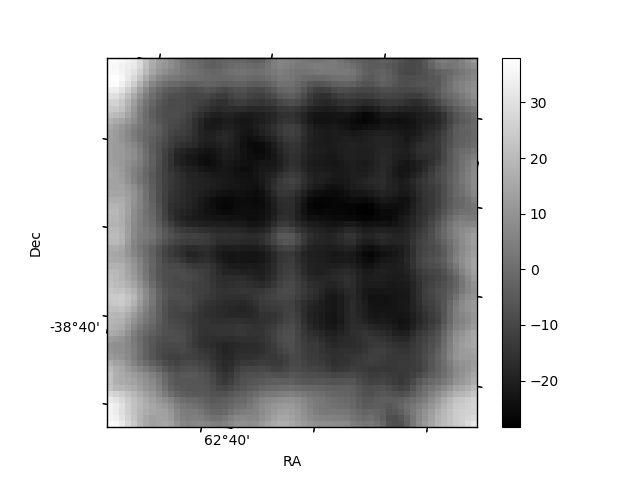
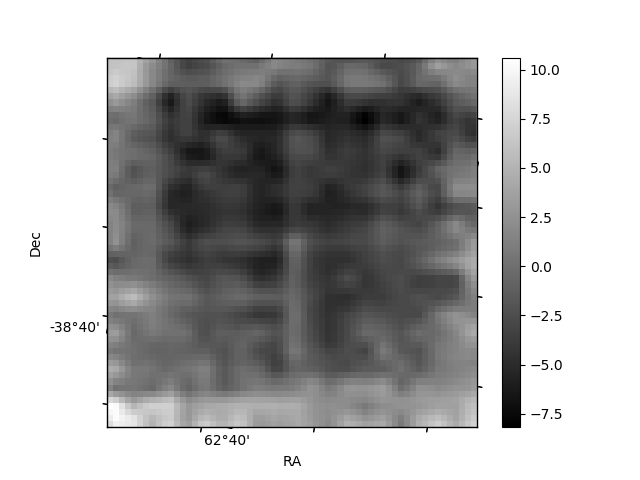
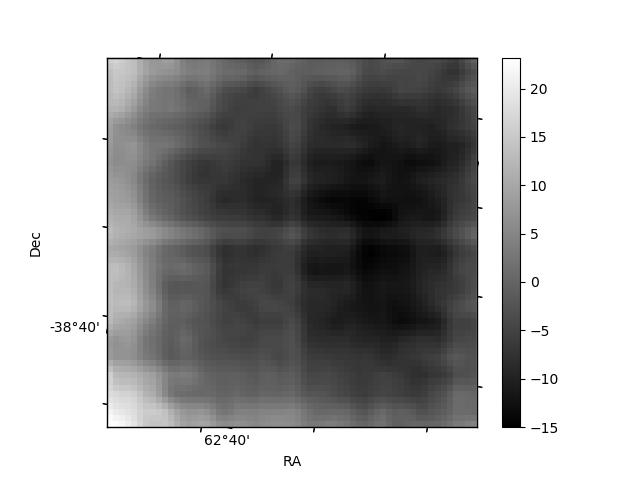
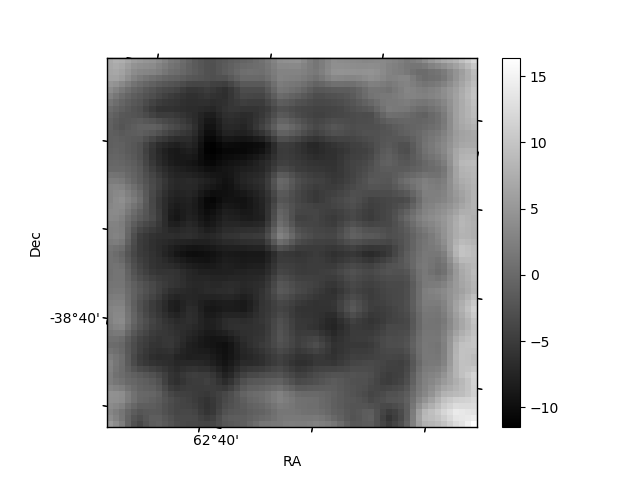
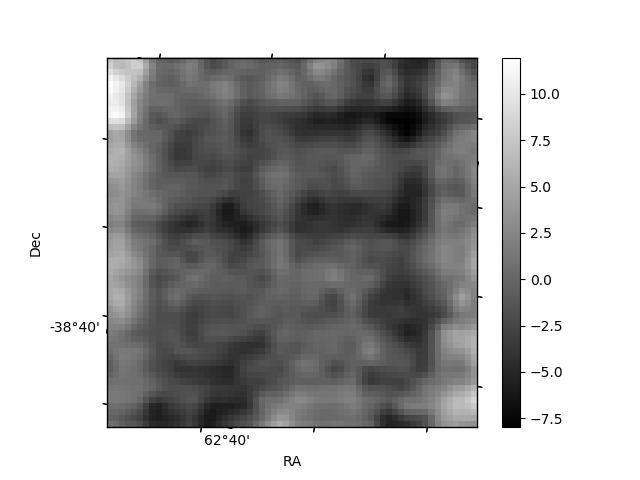
Histogram calculated using DETX and DETY for each event in the final _common_clean file
| Quadrant A | 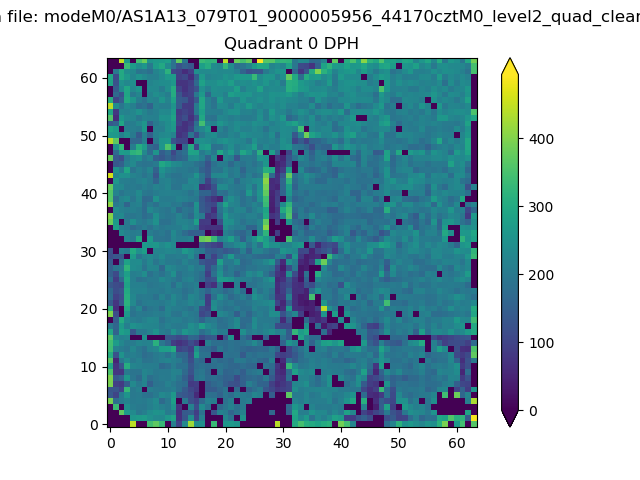 |
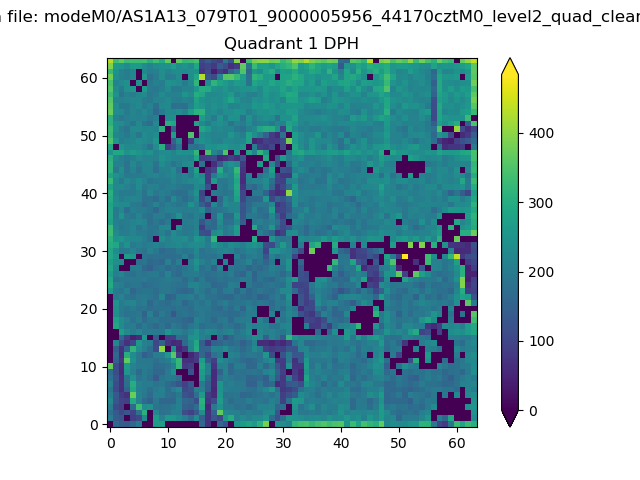 |
Quadrant B |
|---|---|---|---|
| Quadrant D | 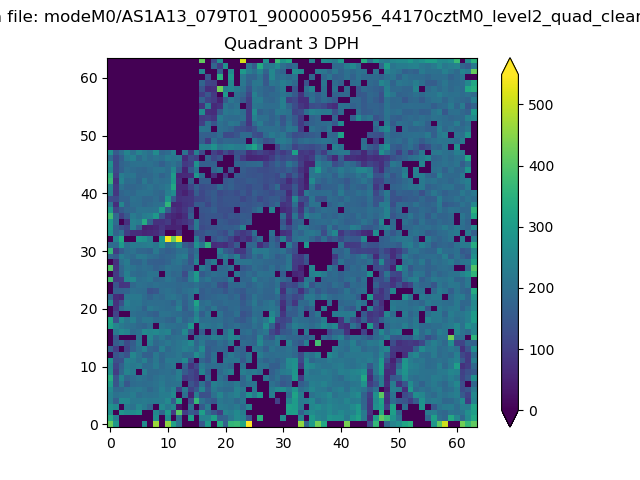 |
 |
Quadrant C |
| Plot type | Count rate plots | Images |
|---|---|---|
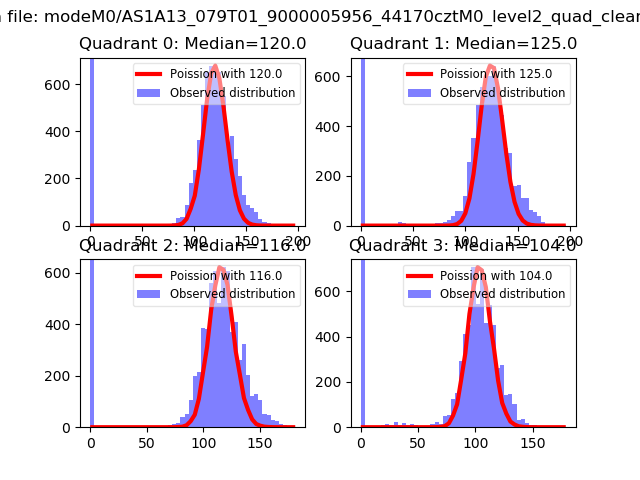
| Comparison with Poisson distribution Blue bars denote a histogram of data divided into 1 sec bins. Red curve is a Poisson curve with rate = median count rate of data. |
 |
 |
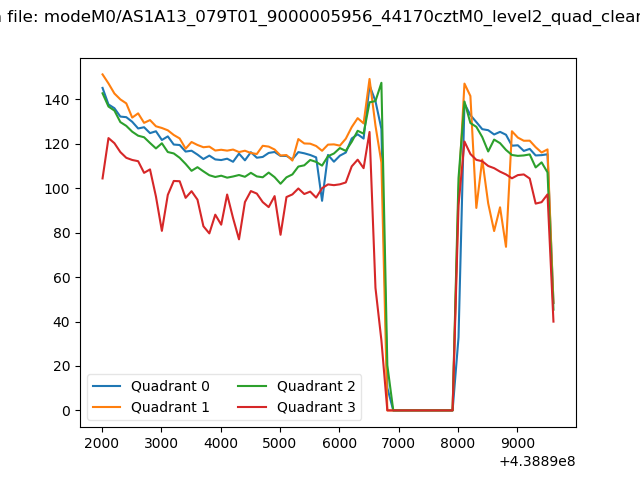
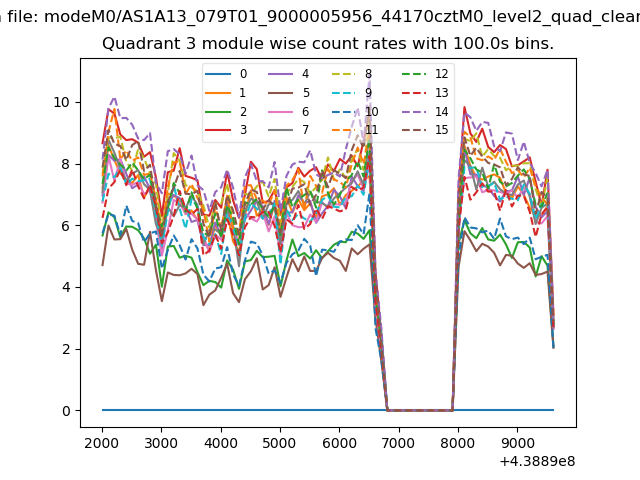
| Quadrant-wise count rates Data is divided into 100 sec bins |
 |
|
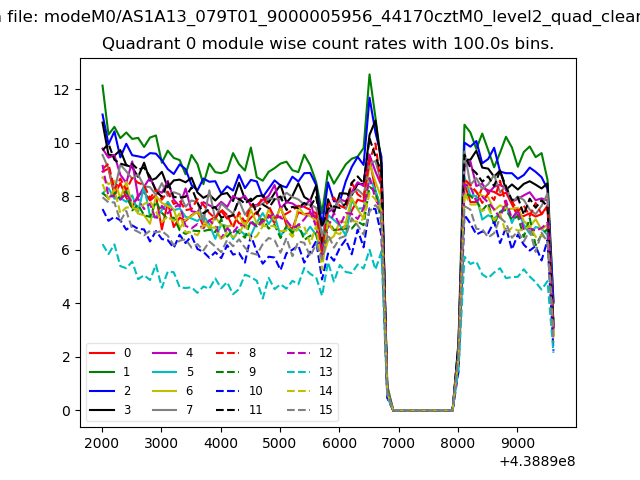
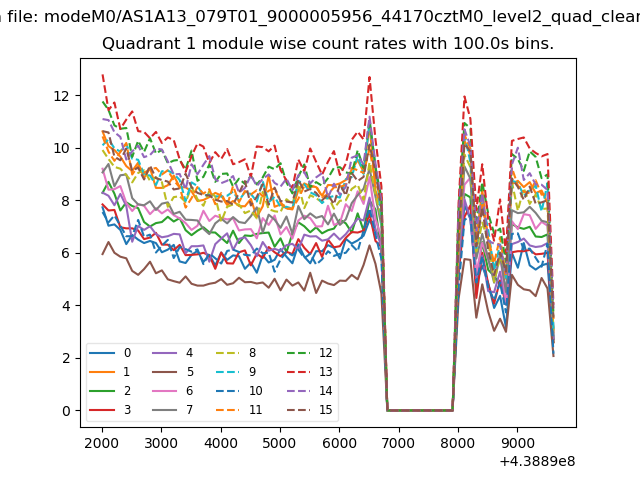
| Module-wise count rates for Quadrant A Data is divided into 100 sec bins |
 |
 |
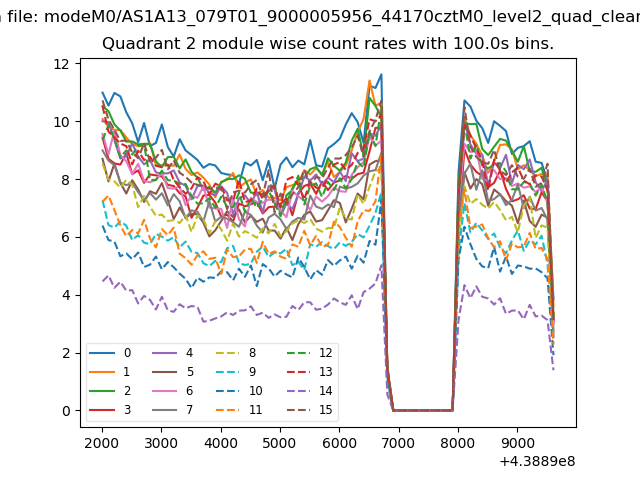
| Module-wise count rates for Quadrant B Data is divided into 100 sec bins |
 |
 |
| Module-wise count rates for Quadrant C Data is divided into 100 sec bins |
 |
 |
| Module-wise count rates for Quadrant D Data is divided into 100 sec bins |
 |
 |
| Parameter | Plot |
|---|---|
| CZT HV Monitor | 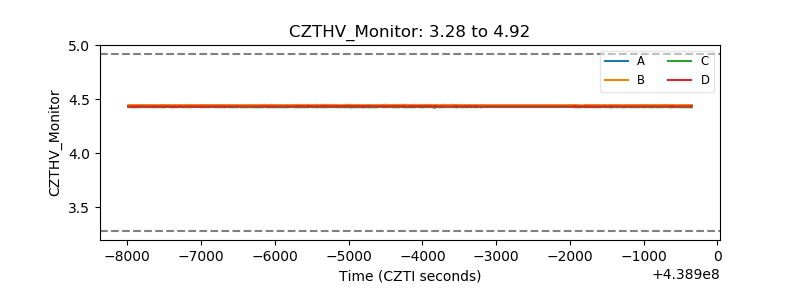 |
| D_VDD | 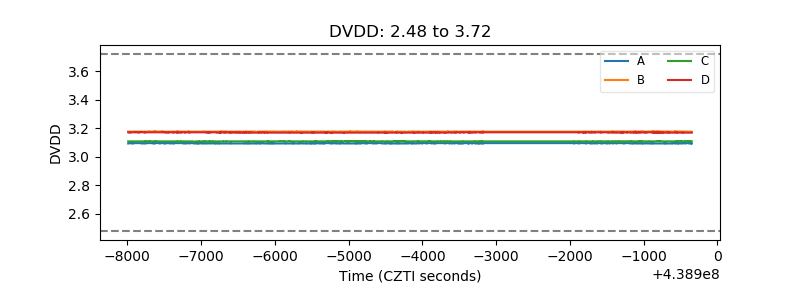 |
| Temperature 1 | 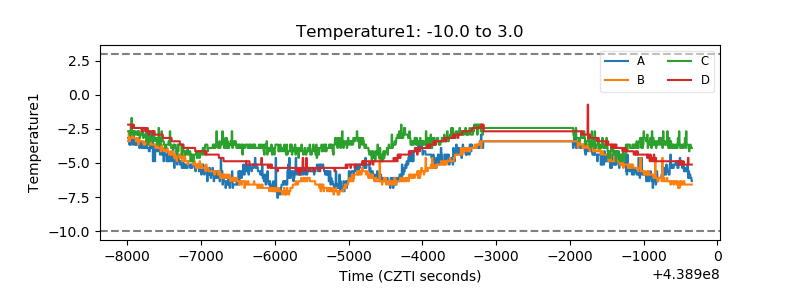 |
| Veto HV Monitor | 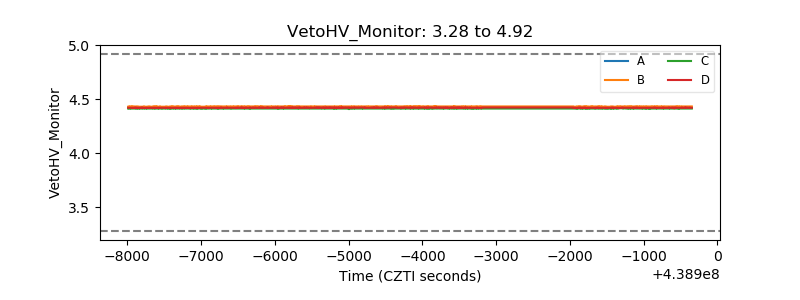 |
| Veto LLD | 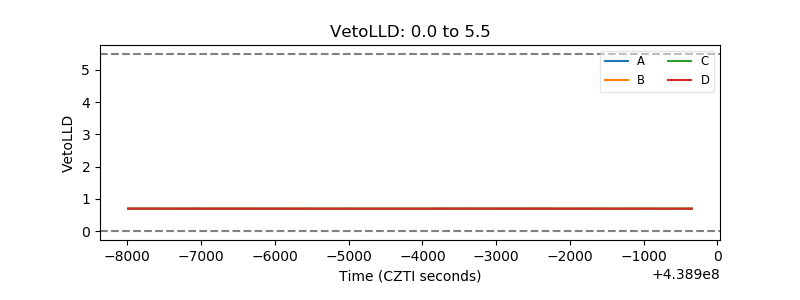 |
| Alpha Counter |  |
| _CPM_Rate | 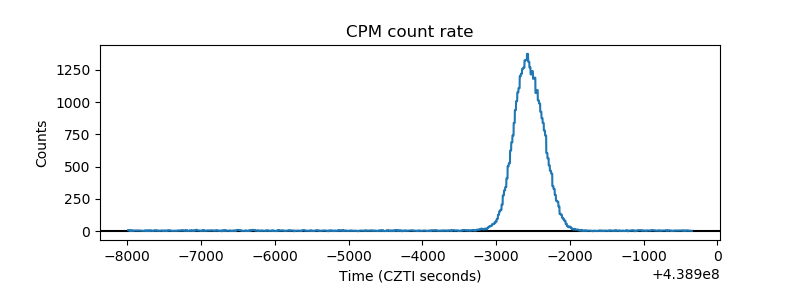 |
| CZT Counter | 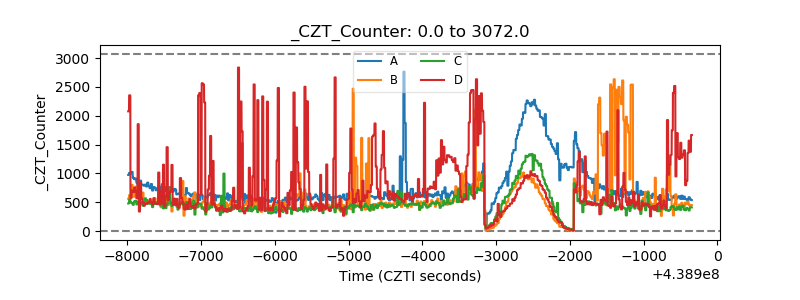 |
| +2.5 Volts monitor | 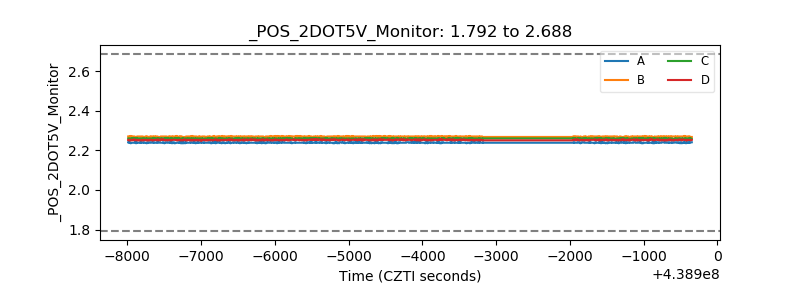 |
| +5 Volts monitor | 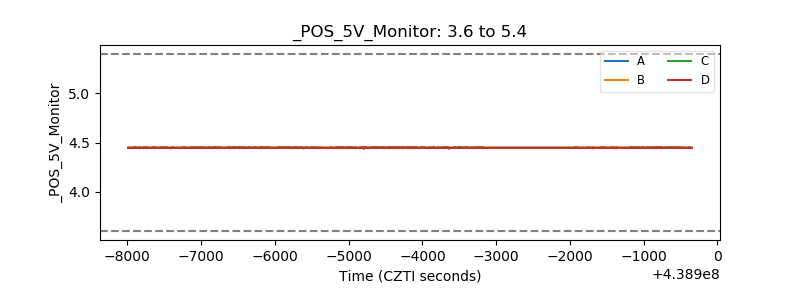 |
| _ROLL_ROT | 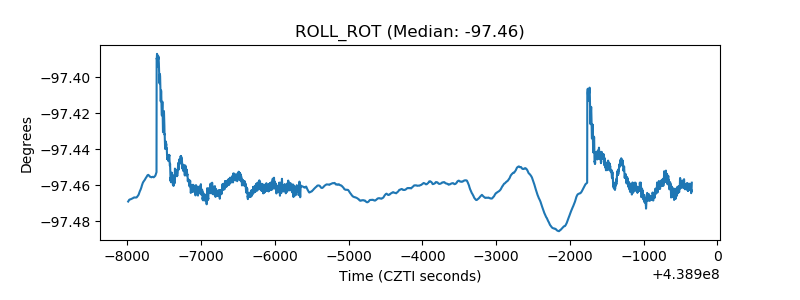 |
| _Roll_DEC | 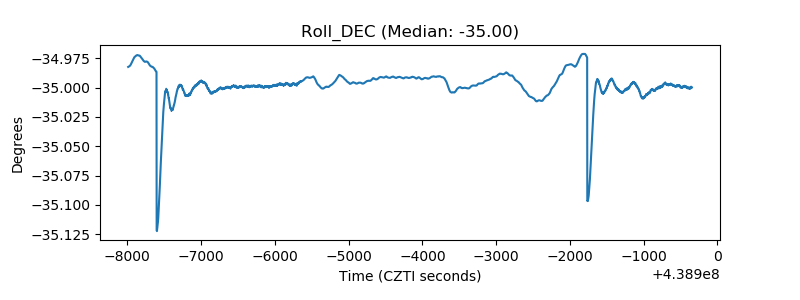 |
| _Roll_RA | 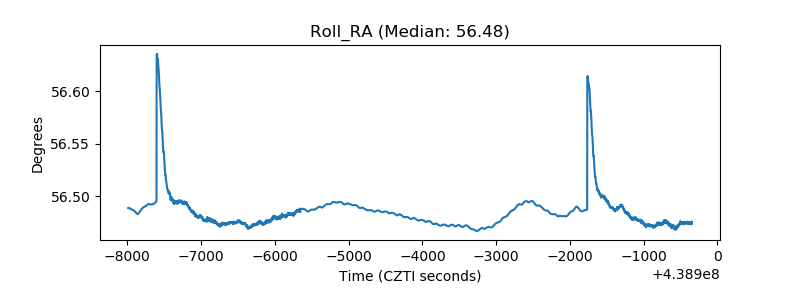 |
| Veto Counter | 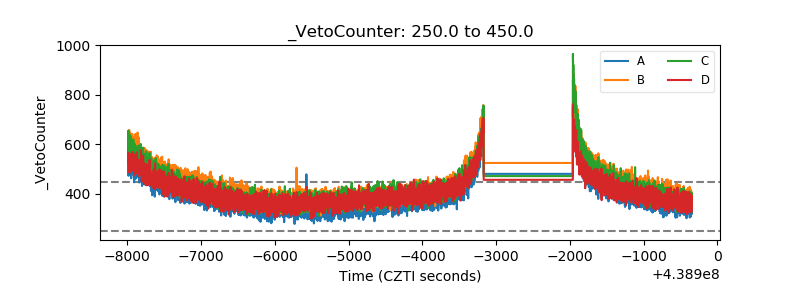 |