| Param | Original file | Final file |
|---|---|---|
| Filename | modeM0/AS1A13_079T01_9000005956_44171cztM0_level2.fits | modeM0/AS1A13_079T01_9000005956_44171cztM0_level2_quad_clean.evt |
| Size (bytes) | 593,582,400 | 103,798,080 |
| Size | 566.1 MB | 99.0 MB |
| Events in quadrant A | 4,449,518 | 753,196 |
| Events in quadrant B | 4,289,967 | 744,163 |
| Events in quadrant C | 3,242,486 | 738,428 |
| Events in quadrant D | 9,481,404 | 449,989 |
| Mode M9 | |||
|---|---|---|---|
| Quadrant | BADHDUFLAG | Total packets | Discarded packets |
| A | 0 | 17 | 0 |
| B | 0 | 17 | 0 |
| C | 0 | 18 | 0 |
| D | 0 | 18 | 0 |
| Mode M0 | |||
|---|---|---|---|
| Quadrant | BADHDUFLAG | Total packets | Discarded packets |
| A | 0 | 17748 | 2 |
| B | 0 | 17316 | 2 |
| C | 0 | 14351 | 2 |
| D | 0 | 32693 | 2 |
| Mode SS | |||
|---|---|---|---|
| Quadrant | BADHDUFLAG | Total packets | Discarded packets |
| A | 0 | 134 | 0 |
| B | 0 | 134 | 0 |
| C | 0 | 134 | 0 |
| D | 0 | 134 | 0 |
| Quadrant | Total seconds | Saturated seconds | Saturation percentage |
|---|---|---|---|
| A | 6553 | 142 | 2.166946% |
| B | 6553 | 478 | 7.294369% |
| C | 6553 | 56 | 0.854570% |
| D | 6553 | 2396 | 36.563406% |
Noise dominated data is calculated using 1-second bins in cleaned event files. If a bin has >2000 counts, and if more than 50% of those come from <1% of pixels, then it is considered to be noise-dominated and hence unusable.
| Quadrant | # 1 sec bins | Bins with >0 counts | Bins with >2000 counts | High rate bins dominated by noise | Noise dominated (total time) | Noise dominated (detector-on time) | Marked lightcurve |
|---|---|---|---|---|---|---|---|
| A | 7734 | 6556 | 7 | 7 | 0.09% | 0.11% | 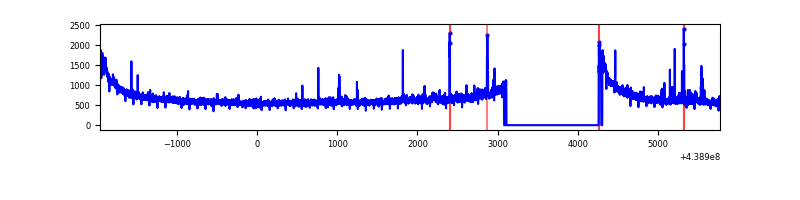 |
| B | 7734 | 6556 | 282 | 282 | 3.65% | 4.30% | 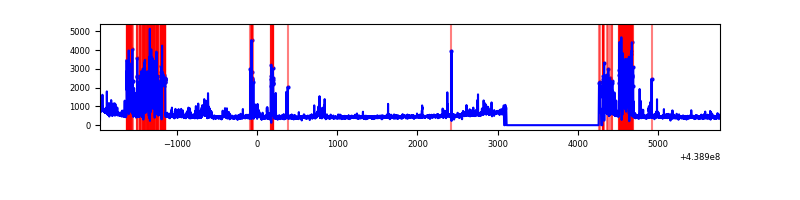 |
| C | 7734 | 6556 | 38 | 38 | 0.49% | 0.58% | 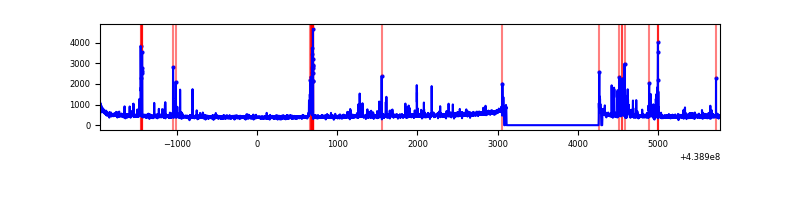 |
| D | 7734 | 6556 | 1951 | 1951 | 25.23% | 29.76% | 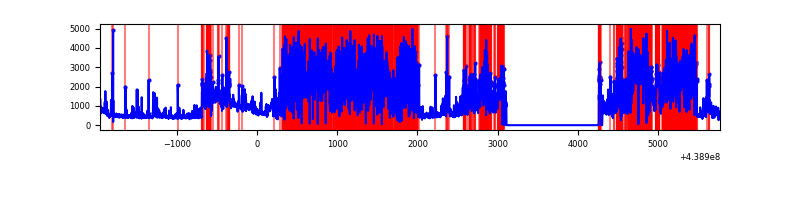 |
Top three noisy pixels from each quadrant. If the there are fewer than three noisy pixels in the level2.evt file, extra rows are filled as -1
| Pixel properties | Quadrant properties | ||||||
|---|---|---|---|---|---|---|---|
| Quadrant | DetID | PixID | Counts | Sigma | Mean | Median | Sigma |
| A | 10 | 83 | 1429173 | 9251.41 | 746 | 730 | 154.4 |
| A | 12 | 227 | 39560 | 251.49 | 746 | 730 | 154.4 |
| A | 15 | 223 | 35538 | 225.44 | 746 | 730 | 154.4 |
| B | 5 | 172 | 1106563 | 7769.14 | 728 | 706 | 142.3 |
| B | 0 | 213 | 91443 | 637.47 | 728 | 706 | 142.3 |
| B | 0 | 219 | 53358 | 369.9 | 728 | 706 | 142.3 |
| C | 14 | 254 | 296787 | 1716.6 | 728 | 732 | 172.5 |
| C | 1 | 16 | 46790 | 267.05 | 728 | 732 | 172.5 |
| C | 9 | 54 | 41665 | 237.34 | 728 | 732 | 172.5 |
| D | 12 | 3 | 3865541 | 26844.62 | 563 | 544 | 144.0 |
| D | 13 | 187 | 2427084 | 16853.71 | 563 | 544 | 144.0 |
| D | 1 | 52 | 491695 | 3411.33 | 563 | 544 | 144.0 |
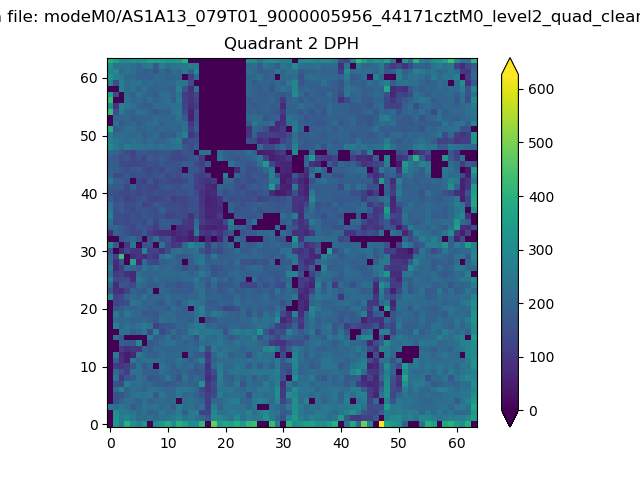
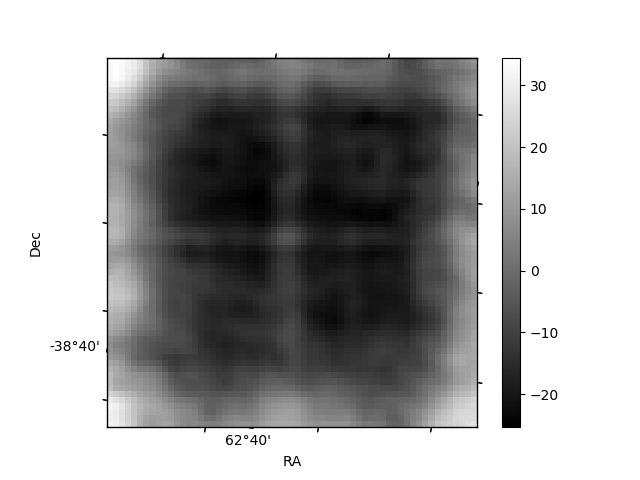
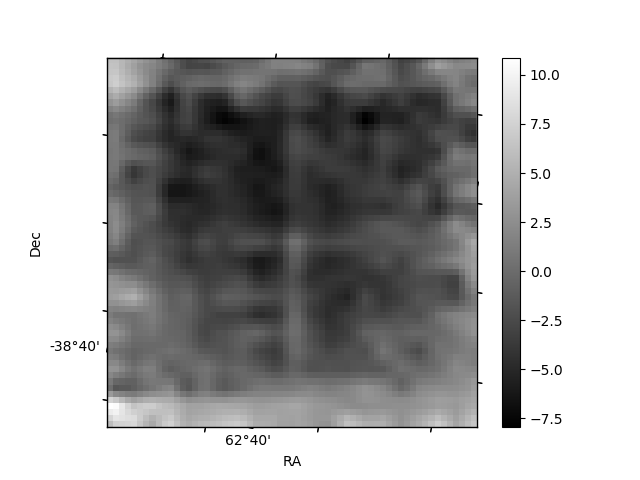
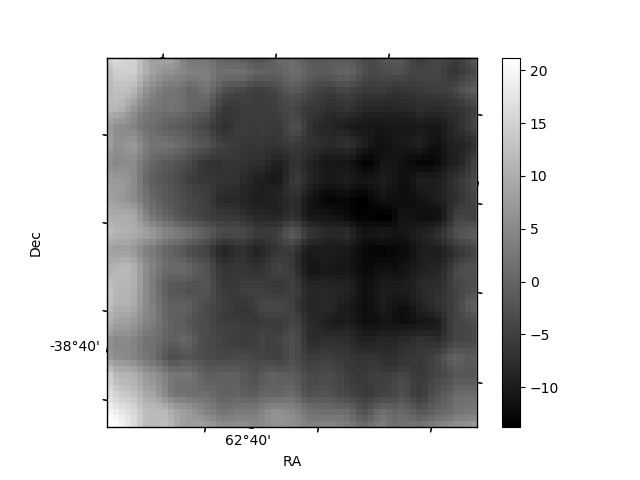
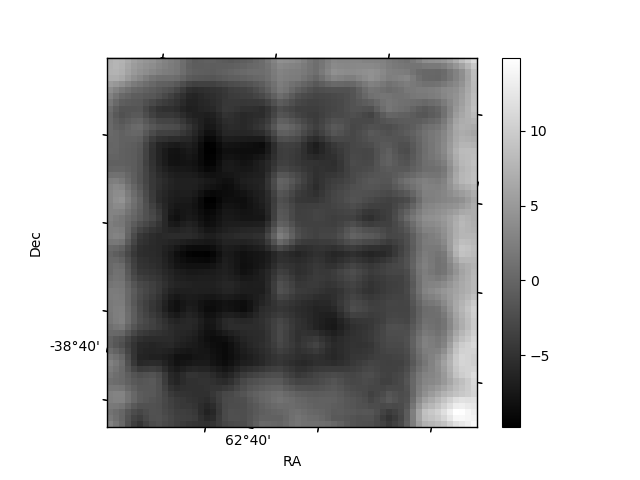
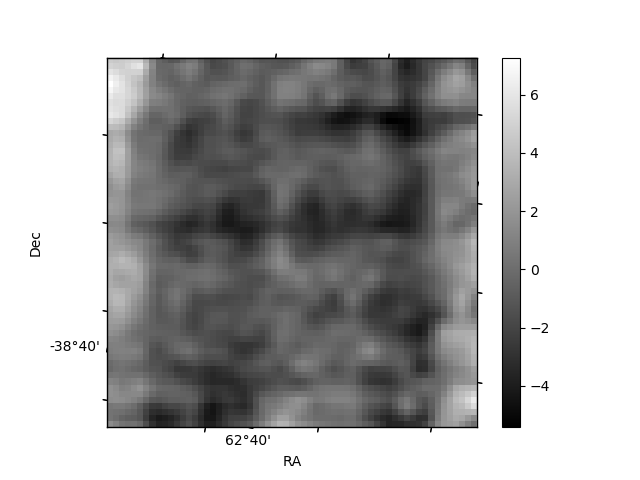
Histogram calculated using DETX and DETY for each event in the final _common_clean file
| Quadrant A | 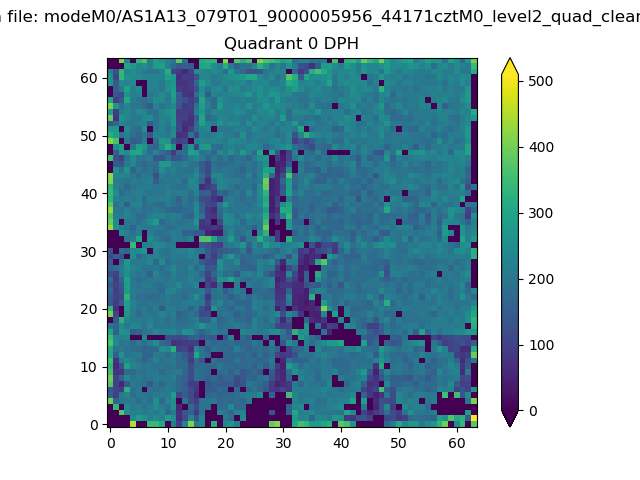 |
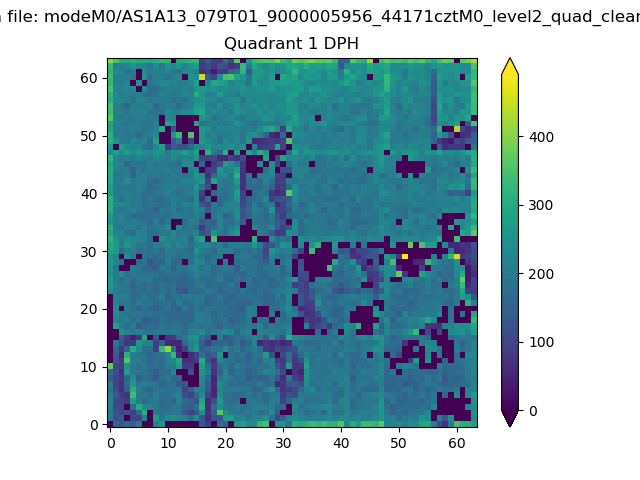 |
Quadrant B |
|---|---|---|---|
| Quadrant D | 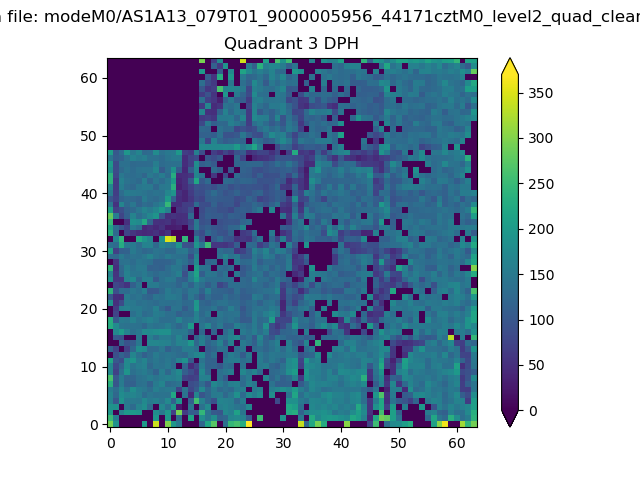 |
 |
Quadrant C |
| Plot type | Count rate plots | Images |
|---|---|---|
| Comparison with Poisson distribution Blue bars denote a histogram of data divided into 1 sec bins. Red curve is a Poisson curve with rate = median count rate of data. |
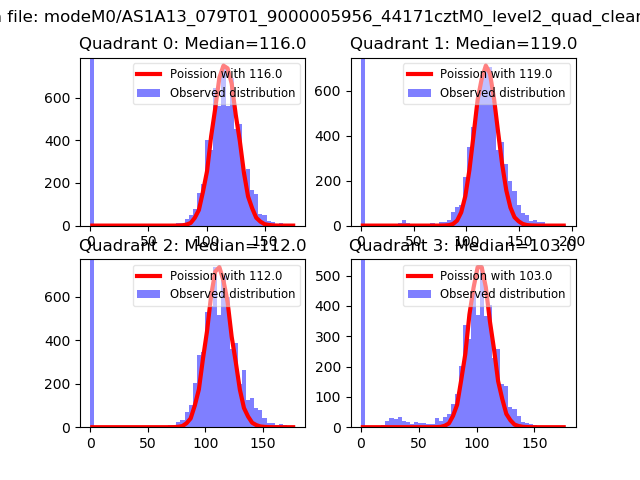 |
 |
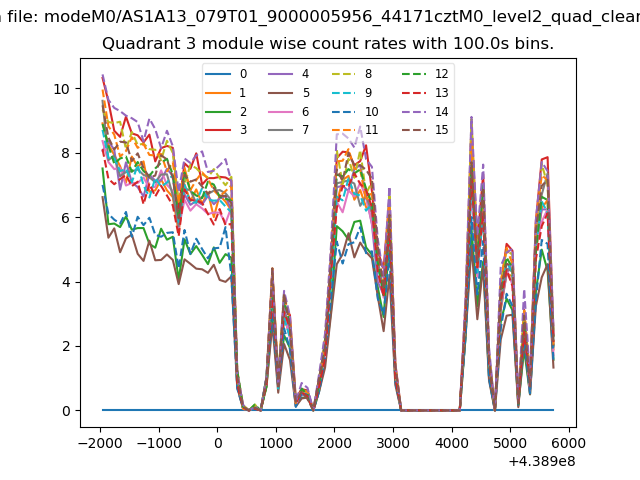
| Quadrant-wise count rates Data is divided into 100 sec bins |
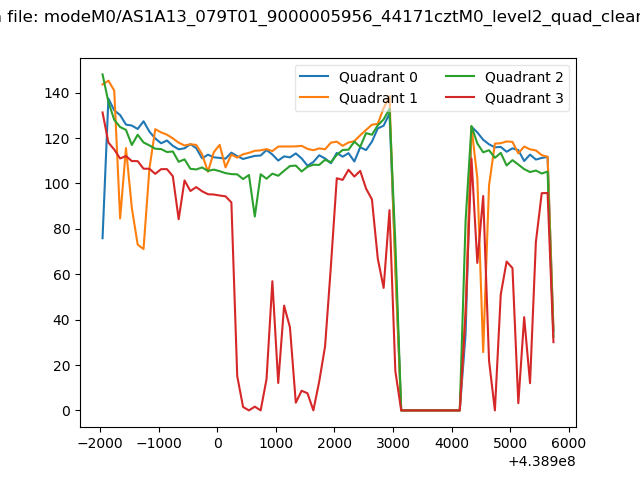 |
|
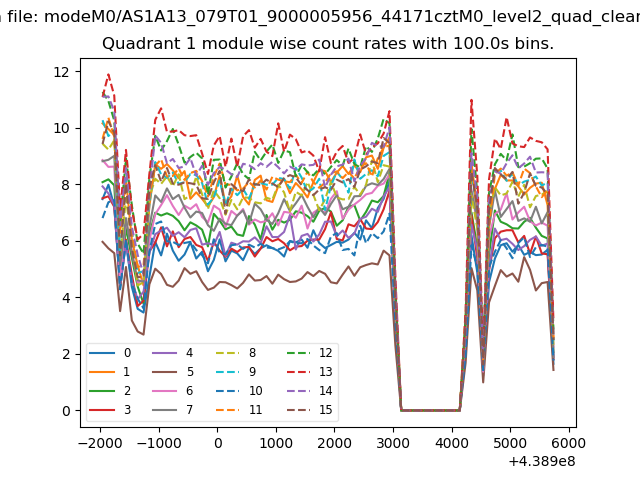
| Module-wise count rates for Quadrant A Data is divided into 100 sec bins |
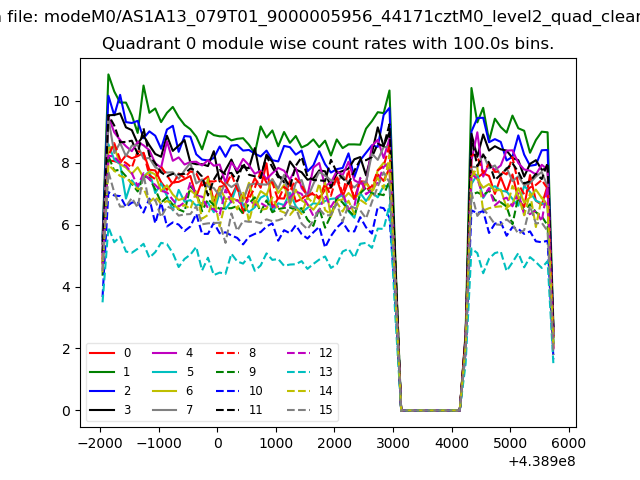 |
 |
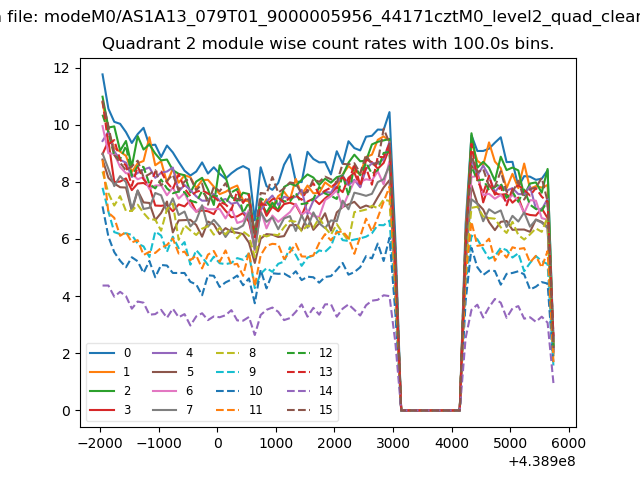
| Module-wise count rates for Quadrant B Data is divided into 100 sec bins |
 |
 |
| Module-wise count rates for Quadrant C Data is divided into 100 sec bins |
 |
 |
| Module-wise count rates for Quadrant D Data is divided into 100 sec bins |
 |
 |
| Parameter | Plot |
|---|---|
| CZT HV Monitor | 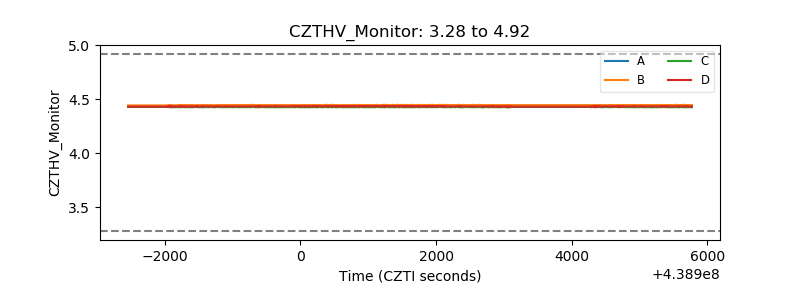 |
| D_VDD | 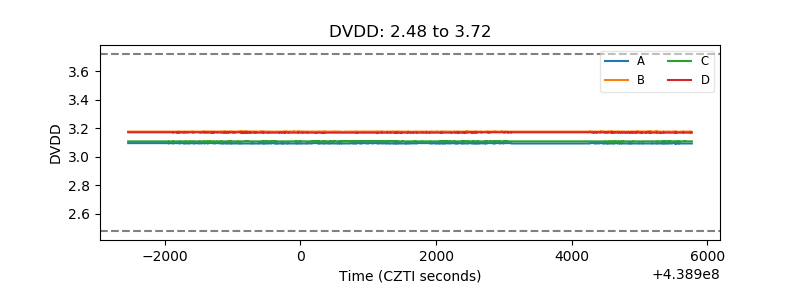 |
| Temperature 1 | 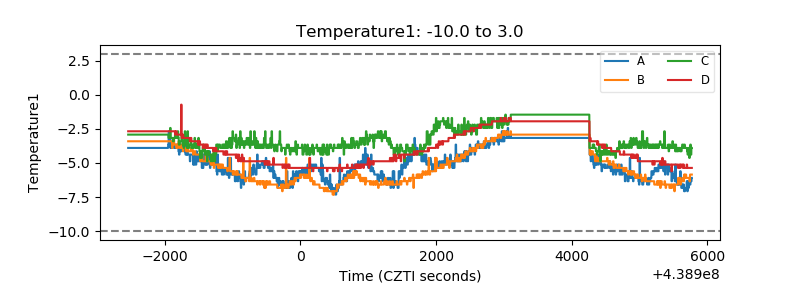 |
| Veto HV Monitor | 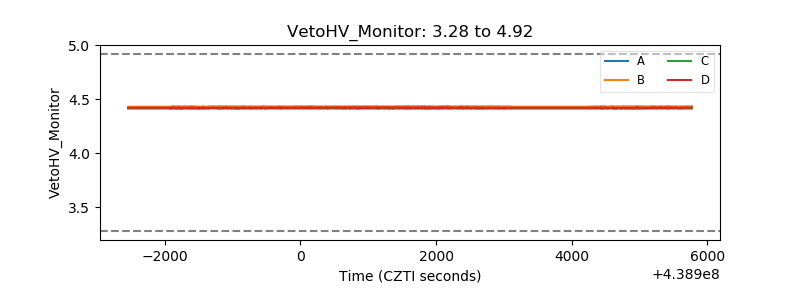 |
| Veto LLD | 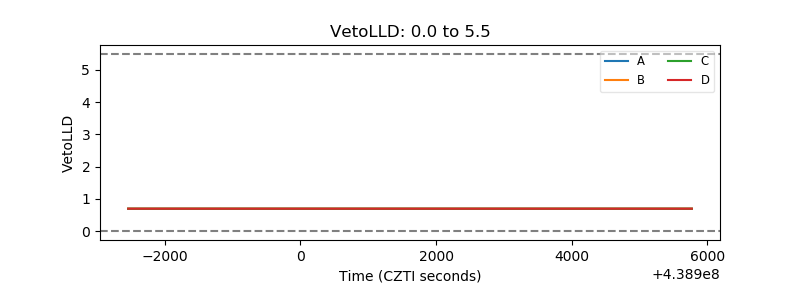 |
| Alpha Counter | 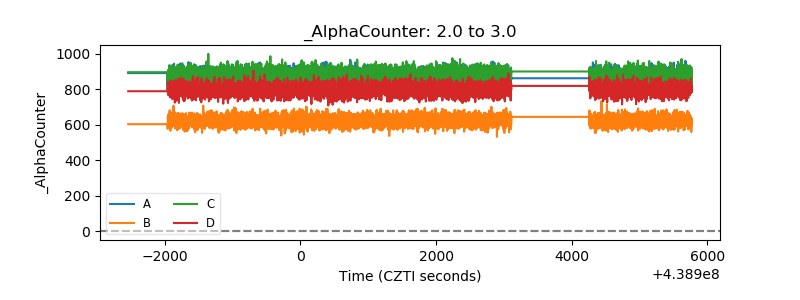 |
| _CPM_Rate | 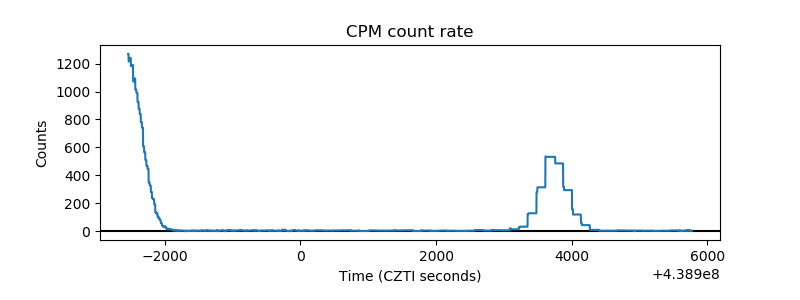 |
| CZT Counter | 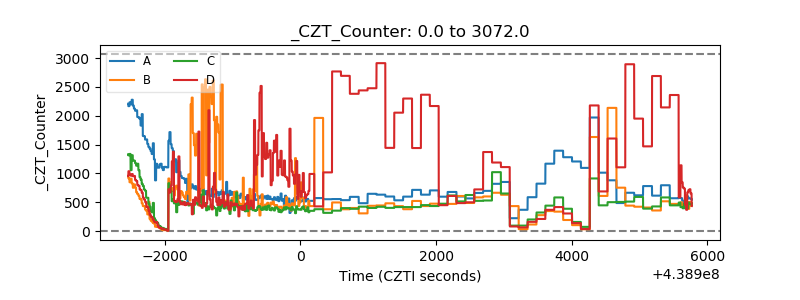 |
| +2.5 Volts monitor |  |
| +5 Volts monitor | 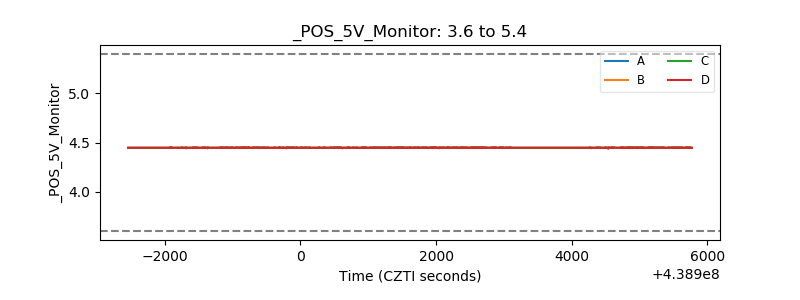 |
| _ROLL_ROT | 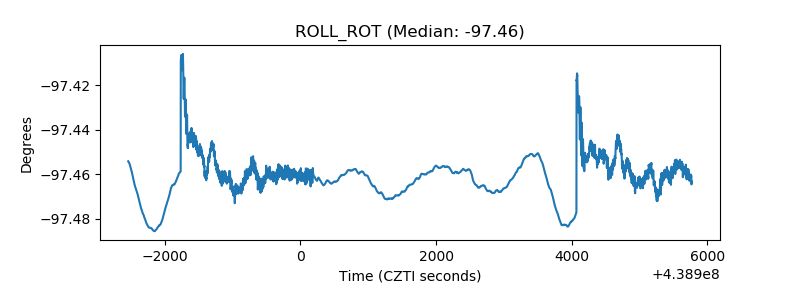 |
| _Roll_DEC | 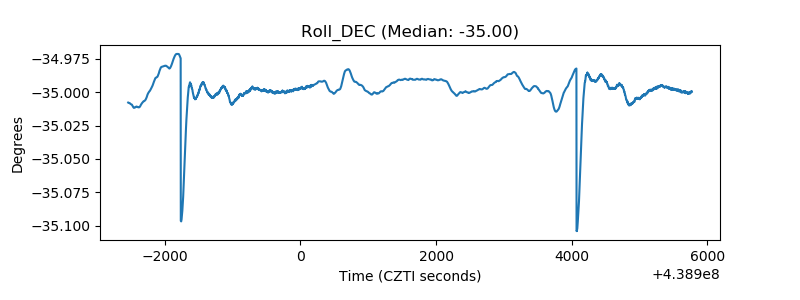 |
| _Roll_RA | 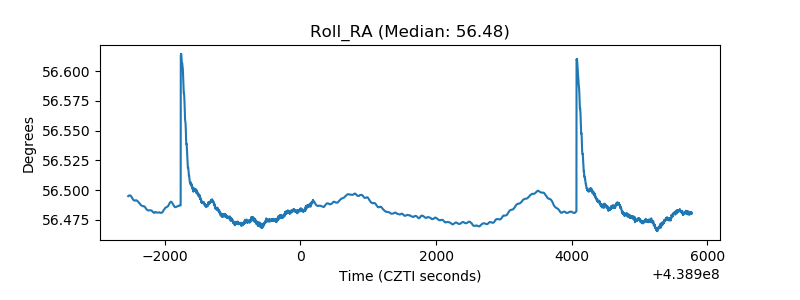 |
| Veto Counter | 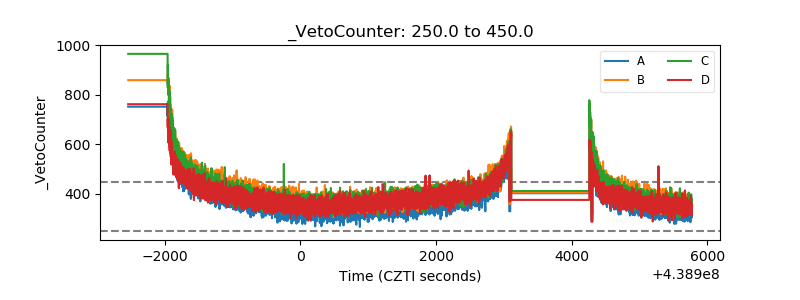 |