| Param | Original file | Final file |
|---|---|---|
| Filename | modeM0/AS1A13_079T01_9000005956_44173cztM0_level2.fits | modeM0/AS1A13_079T01_9000005956_44173cztM0_level2_quad_clean.evt |
| Size (bytes) | 1,011,404,160 | 196,683,840 |
| Size | 964.6 MB | 187.6 MB |
| Events in quadrant A | 8,864,999 | 1,374,432 |
| Events in quadrant B | 7,972,052 | 1,311,103 |
| Events in quadrant C | 5,850,790 | 1,348,281 |
| Events in quadrant D | 13,771,021 | 1,045,917 |
| Mode M9 | |||
|---|---|---|---|
| Quadrant | BADHDUFLAG | Total packets | Discarded packets |
| A | 0 | 19 | 0 |
| B | 0 | 19 | 0 |
| C | 0 | 20 | 0 |
| D | 0 | 20 | 0 |
| Mode M0 | |||
|---|---|---|---|
| Quadrant | BADHDUFLAG | Total packets | Discarded packets |
| A | 0 | 35696 | 3 |
| B | 0 | 32575 | 3 |
| C | 0 | 26489 | 4 |
| D | 0 | 49918 | 3 |
| Mode SS | |||
|---|---|---|---|
| Quadrant | BADHDUFLAG | Total packets | Discarded packets |
| A | 0 | 256 | 0 |
| B | 0 | 256 | 0 |
| C | 0 | 256 | 0 |
| D | 0 | 256 | 0 |
| Quadrant | Total seconds | Saturated seconds | Saturation percentage |
|---|---|---|---|
| A | 12668 | 206 | 1.626145% |
| B | 12668 | 979 | 7.728134% |
| C | 12667 | 38 | 0.299992% |
| D | 12667 | 2073 | 16.365359% |
Noise dominated data is calculated using 1-second bins in cleaned event files. If a bin has >2000 counts, and if more than 50% of those come from <1% of pixels, then it is considered to be noise-dominated and hence unusable.
| Quadrant | # 1 sec bins | Bins with >0 counts | Bins with >2000 counts | High rate bins dominated by noise | Noise dominated (total time) | Noise dominated (detector-on time) | Marked lightcurve |
|---|---|---|---|---|---|---|---|
| A | 13978 | 12671 | 33 | 33 | 0.24% | 0.26% | 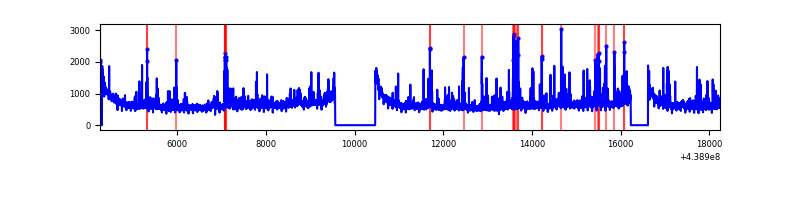 |
| B | 13978 | 12671 | 577 | 577 | 4.13% | 4.55% | 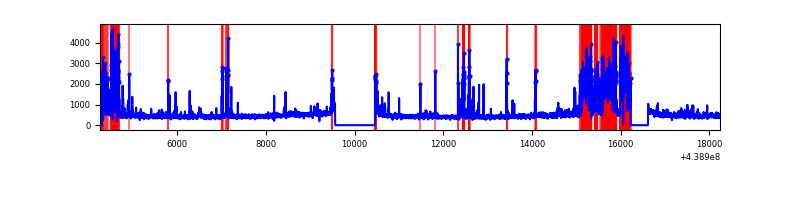 |
| C | 13977 | 12670 | 17 | 17 | 0.12% | 0.13% | 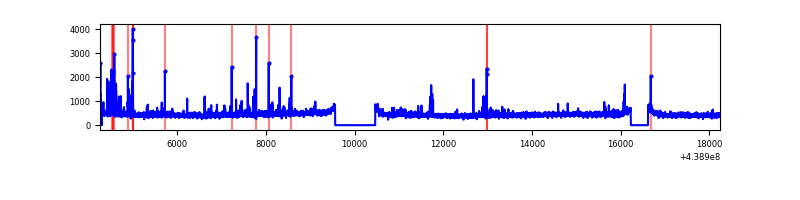 |
| D | 13977 | 12670 | 1866 | 1866 | 13.35% | 14.73% | 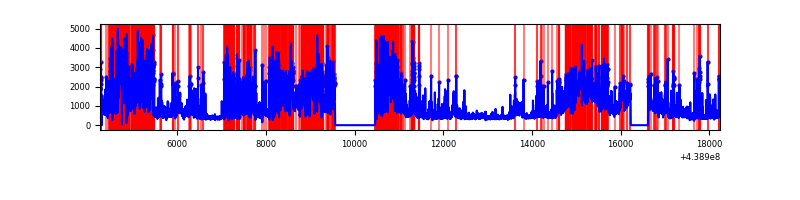 |
Top three noisy pixels from each quadrant. If the there are fewer than three noisy pixels in the level2.evt file, extra rows are filled as -1
| Pixel properties | Quadrant properties | ||||||
|---|---|---|---|---|---|---|---|
| Quadrant | DetID | PixID | Counts | Sigma | Mean | Median | Sigma |
| A | 10 | 83 | 2522812 | 8710.83 | 1402 | 1371 | 289.5 |
| A | 15 | 223 | 561147 | 1933.86 | 1402 | 1371 | 289.5 |
| A | 7 | 3 | 198610 | 681.4 | 1402 | 1371 | 289.5 |
| B | 5 | 172 | 2218450 | 8343.31 | 1361 | 1317 | 265.7 |
| B | 0 | 189 | 128264 | 477.72 | 1361 | 1317 | 265.7 |
| B | 0 | 219 | 72540 | 268.02 | 1361 | 1317 | 265.7 |
| C | 14 | 254 | 219480 | 671.22 | 1382 | 1391 | 324.9 |
| C | 9 | 54 | 142366 | 433.88 | 1382 | 1391 | 324.9 |
| C | 1 | 16 | 47636 | 142.33 | 1382 | 1391 | 324.9 |
| D | 13 | 187 | 6136610 | 18907.66 | 1282 | 1244 | 324.5 |
| D | 13 | 249 | 642310 | 1975.6 | 1282 | 1244 | 324.5 |
| D | 1 | 52 | 626774 | 1927.73 | 1282 | 1244 | 324.5 |
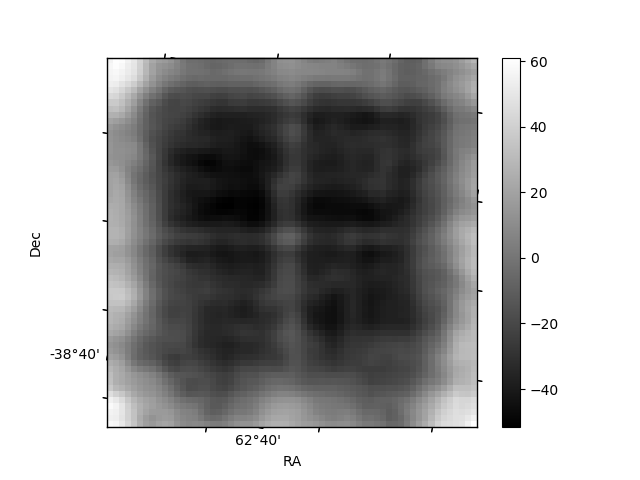
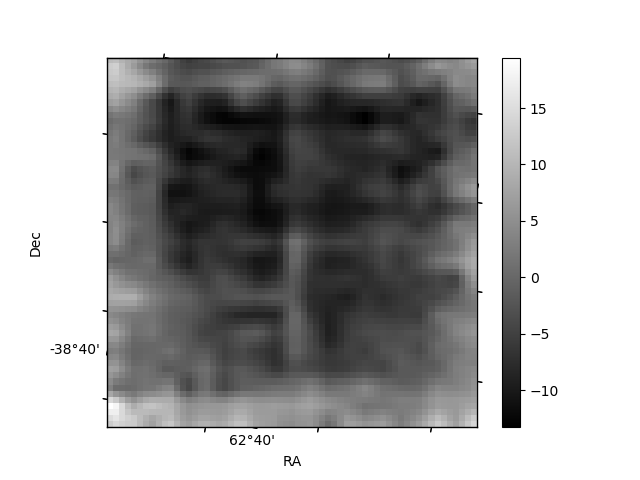
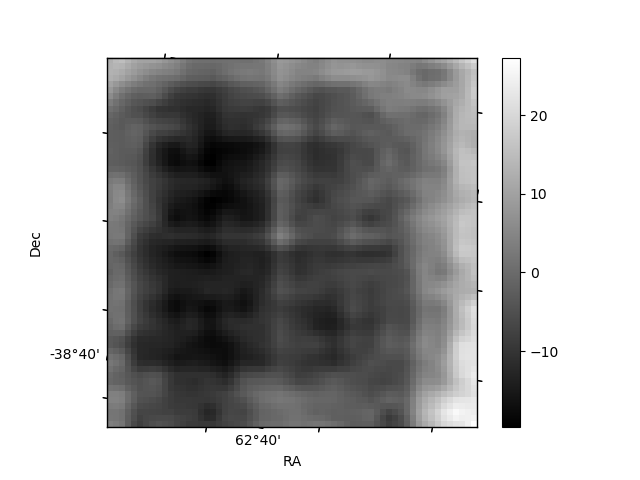
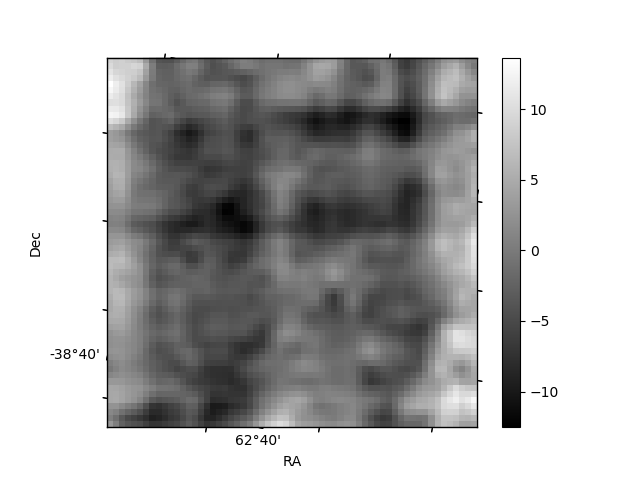
Histogram calculated using DETX and DETY for each event in the final _common_clean file
| Quadrant A | 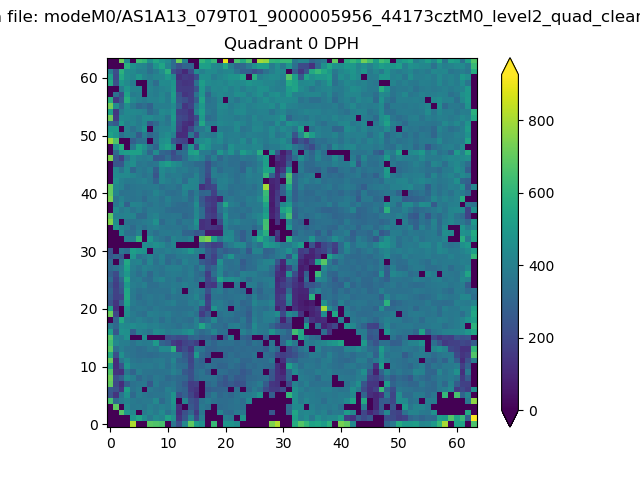 |
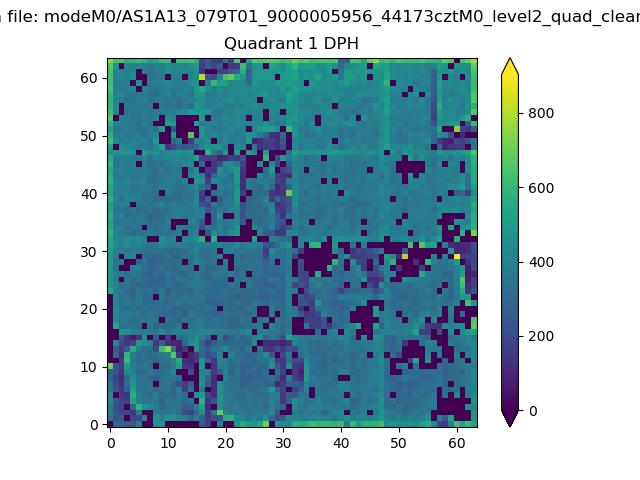 |
Quadrant B |
|---|---|---|---|
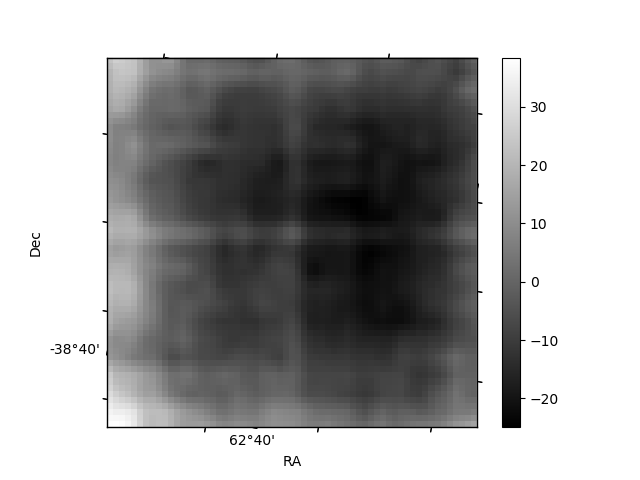
| Quadrant D | 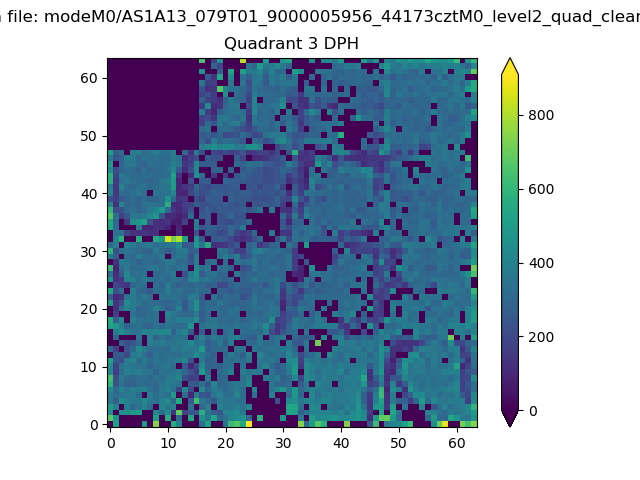 |
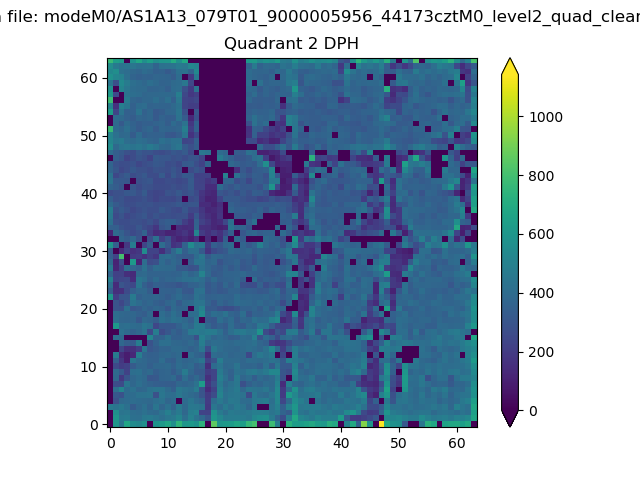 |
Quadrant C |
| Plot type | Count rate plots | Images |
|---|---|---|
| Comparison with Poisson distribution Blue bars denote a histogram of data divided into 1 sec bins. Red curve is a Poisson curve with rate = median count rate of data. |
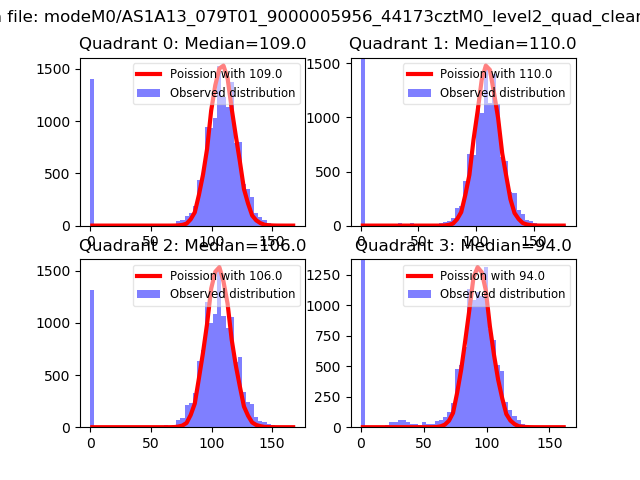 |
 |
| Quadrant-wise count rates Data is divided into 100 sec bins |
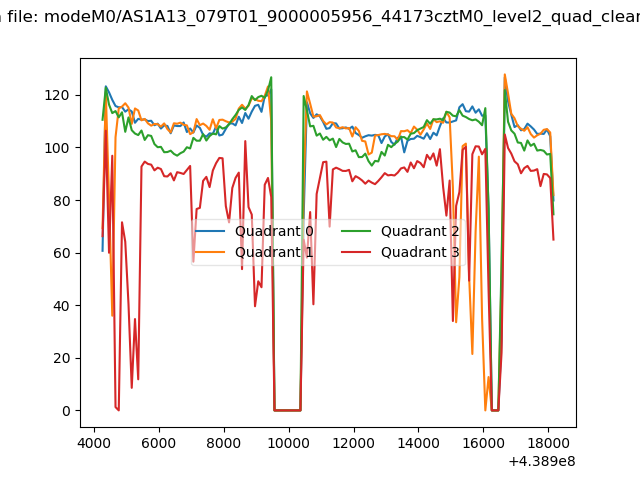 |
|
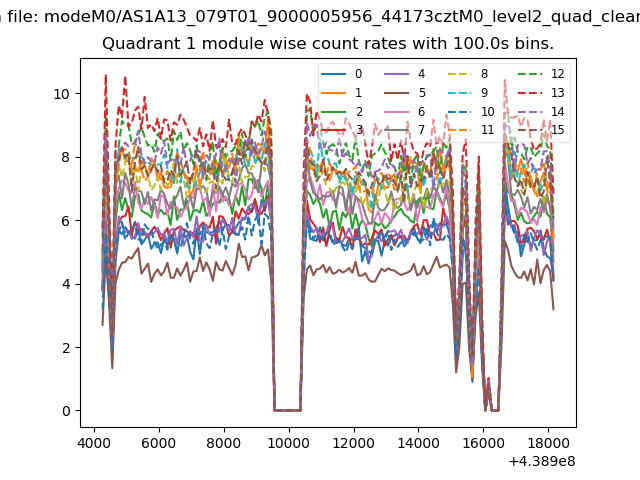
| Module-wise count rates for Quadrant A Data is divided into 100 sec bins |
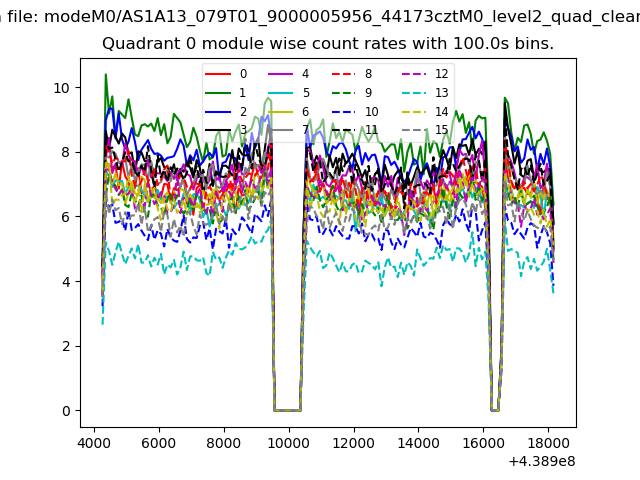 |
 |
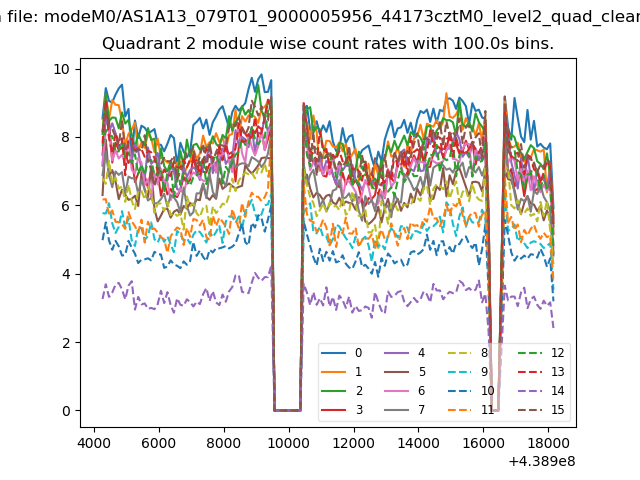
| Module-wise count rates for Quadrant B Data is divided into 100 sec bins |
 |
 |
| Module-wise count rates for Quadrant C Data is divided into 100 sec bins |
 |
 |
| Module-wise count rates for Quadrant D Data is divided into 100 sec bins |
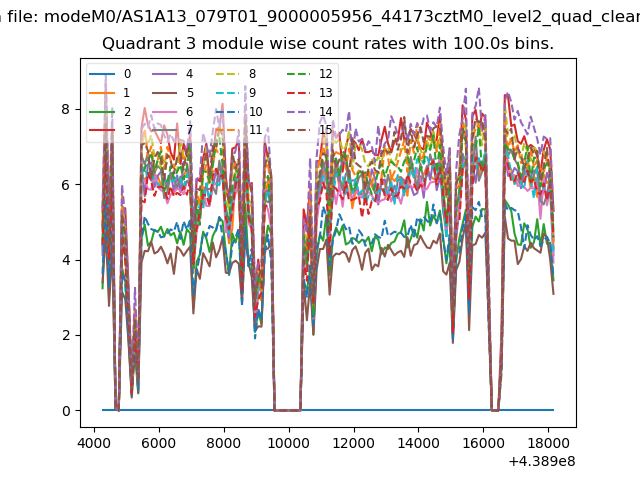 |
 |
| Parameter | Plot |
|---|---|
| CZT HV Monitor | 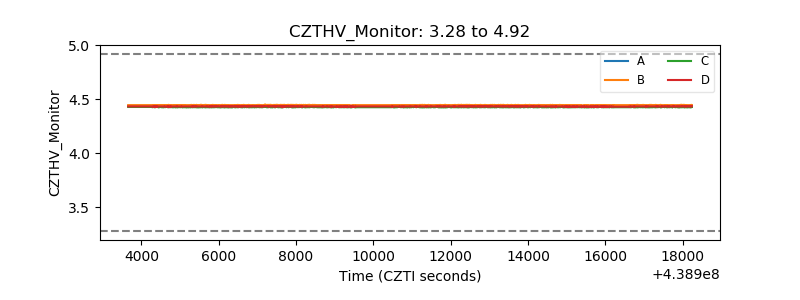 |
| D_VDD | 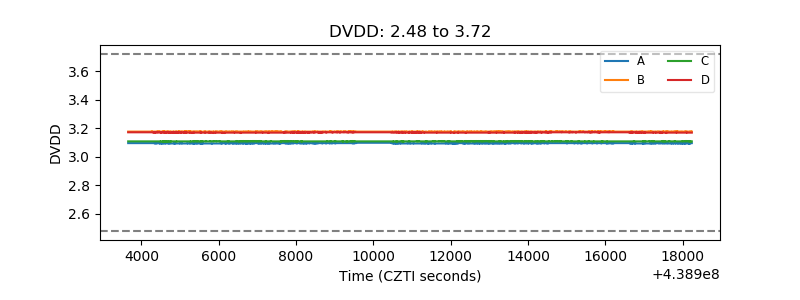 |
| Temperature 1 | 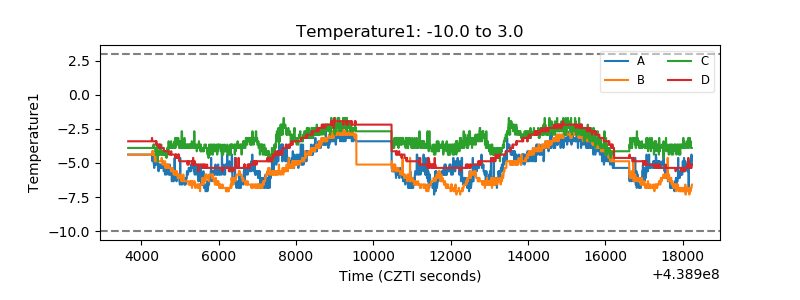 |
| Veto HV Monitor | 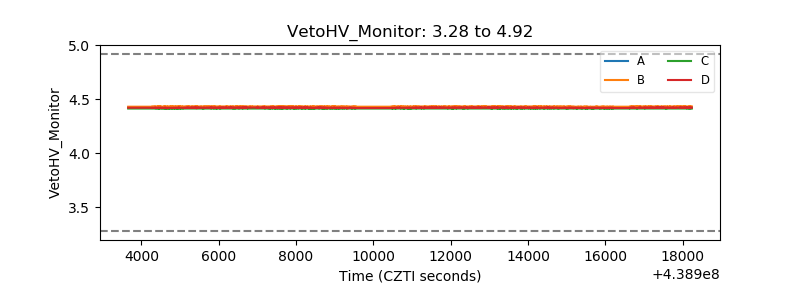 |
| Veto LLD | 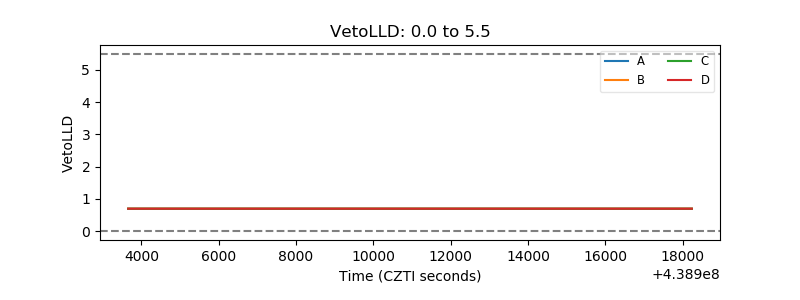 |
| Alpha Counter | 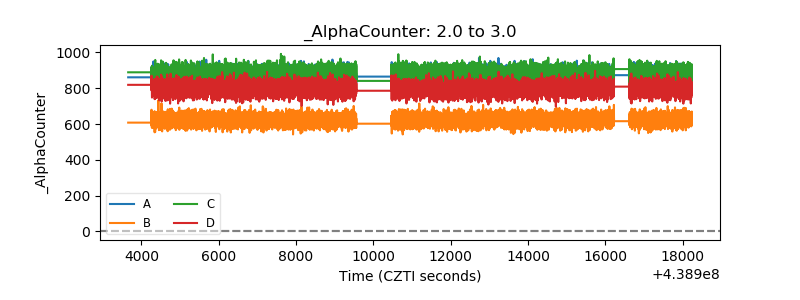 |
| _CPM_Rate | 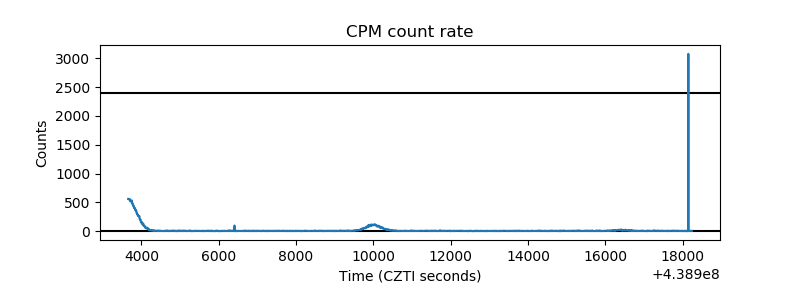 |
| CZT Counter | 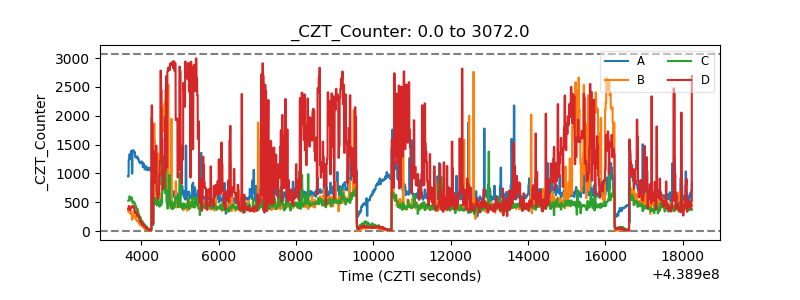 |
| +2.5 Volts monitor |  |
| +5 Volts monitor | 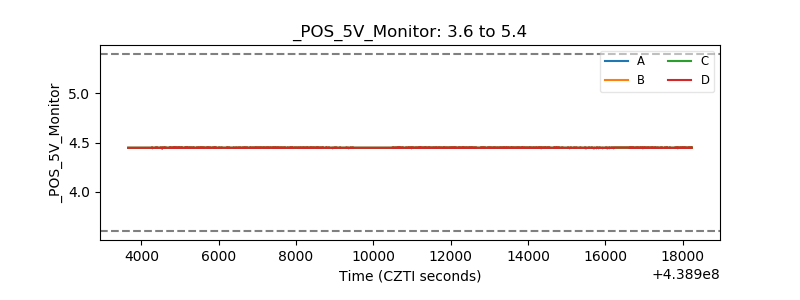 |
| _ROLL_ROT | 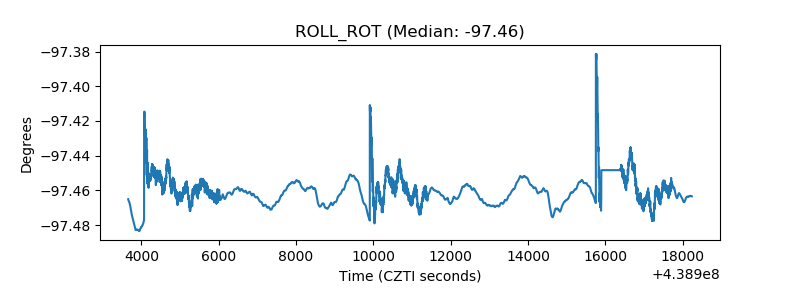 |
| _Roll_DEC | 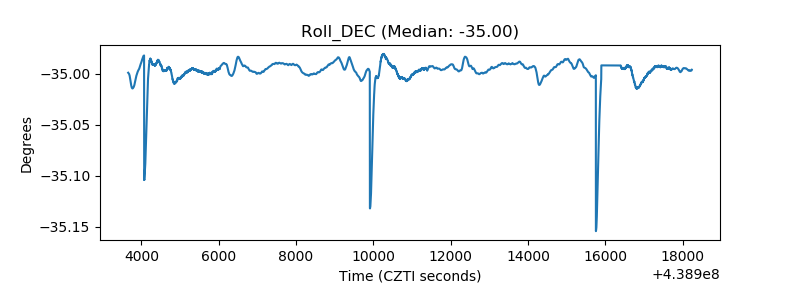 |
| _Roll_RA | 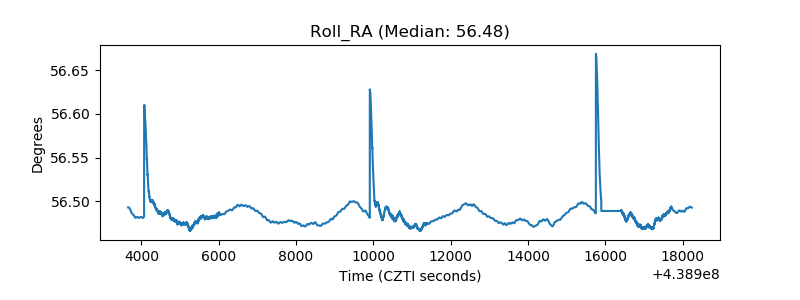 |
| Veto Counter | 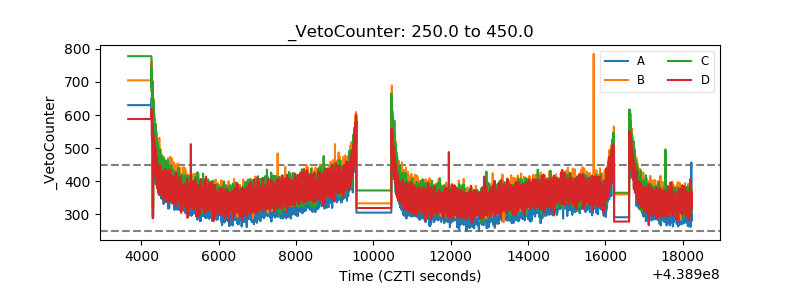 |