| Param | Original file | Final file |
|---|---|---|
| Filename | modeM0/AS1A13_079T01_9000005956_44174cztM0_level2.fits | modeM0/AS1A13_079T01_9000005956_44174cztM0_level2_quad_clean.evt |
| Size (bytes) | 533,292,480 | 107,112,960 |
| Size | 508.6 MB | 102.2 MB |
| Events in quadrant A | 4,712,320 | 732,378 |
| Events in quadrant B | 3,637,063 | 755,003 |
| Events in quadrant C | 3,153,301 | 715,659 |
| Events in quadrant D | 7,697,935 | 554,945 |
| Mode M0 | |||
|---|---|---|---|
| Quadrant | BADHDUFLAG | Total packets | Discarded packets |
| A | 0 | 19394 | 594 |
| B | 0 | 15979 | 429 |
| C | 0 | 14939 | 383 |
| D | 0 | 29116 | 1410 |
| Mode SS | |||
|---|---|---|---|
| Quadrant | BADHDUFLAG | Total packets | Discarded packets |
| A | 0 | 142 | 2 |
| B | 0 | 143 | 1 |
| C | 0 | 143 | 1 |
| D | 0 | 142 | 0 |
| Quadrant | Total seconds | Saturated seconds | Saturation percentage |
|---|---|---|---|
| A | 6964 | 102 | 1.464675% |
| B | 6968 | 86 | 1.234214% |
| C | 6973 | 9 | 0.129069% |
| D | 6925 | 1186 | 17.126354% |
Noise dominated data is calculated using 1-second bins in cleaned event files. If a bin has >2000 counts, and if more than 50% of those come from <1% of pixels, then it is considered to be noise-dominated and hence unusable.
| Quadrant | # 1 sec bins | Bins with >0 counts | Bins with >2000 counts | High rate bins dominated by noise | Noise dominated (total time) | Noise dominated (detector-on time) | Marked lightcurve |
|---|---|---|---|---|---|---|---|
| A | 7567 | 7012 | 79 | 79 | 1.04% | 1.13% | 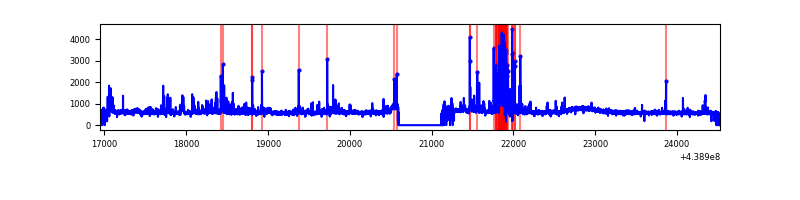 |
| B | 7563 | 7013 | 57 | 57 | 0.75% | 0.81% | 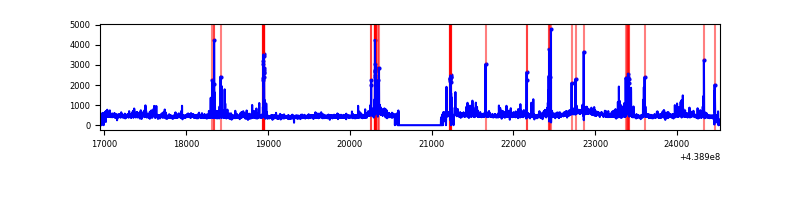 |
| C | 7572 | 7024 | 9 | 9 | 0.12% | 0.13% | 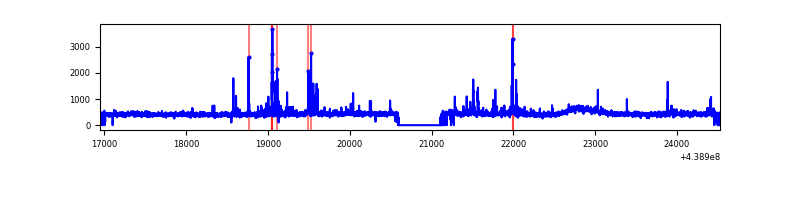 |
| D | 7576 | 6985 | 1134 | 1134 | 14.97% | 16.23% | 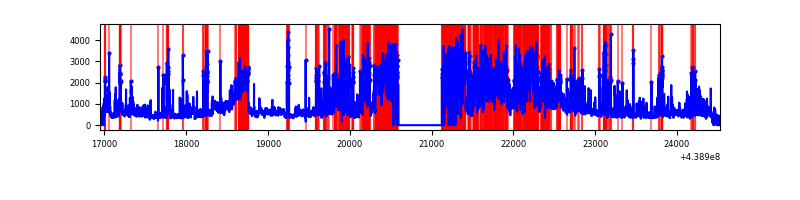 |
Top three noisy pixels from each quadrant. If the there are fewer than three noisy pixels in the level2.evt file, extra rows are filled as -1
| Pixel properties | Quadrant properties | ||||||
|---|---|---|---|---|---|---|---|
| Quadrant | DetID | PixID | Counts | Sigma | Mean | Median | Sigma |
| A | 10 | 83 | 1165113 | 7431.72 | 753 | 737 | 156.7 |
| A | 15 | 223 | 457351 | 2914.38 | 753 | 737 | 156.7 |
| A | 7 | 3 | 128554 | 815.8 | 753 | 737 | 156.7 |
| B | 5 | 172 | 246958 | 1664.94 | 756 | 733 | 147.9 |
| B | 0 | 189 | 122385 | 822.59 | 756 | 733 | 147.9 |
| B | 5 | 255 | 108514 | 728.8 | 756 | 733 | 147.9 |
| C | 14 | 254 | 144716 | 814.62 | 746 | 750 | 176.7 |
| C | 3 | 233 | 35929 | 199.06 | 746 | 750 | 176.7 |
| C | 9 | 54 | 23562 | 129.08 | 746 | 750 | 176.7 |
| D | 13 | 187 | 2758884 | 16066.97 | 678 | 660 | 171.7 |
| D | 1 | 52 | 1022698 | 5953.49 | 678 | 660 | 171.7 |
| D | 12 | 233 | 616974 | 3590.1 | 678 | 660 | 171.7 |
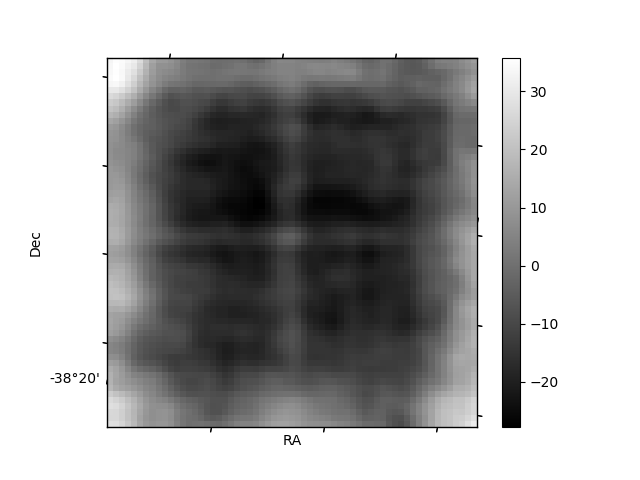
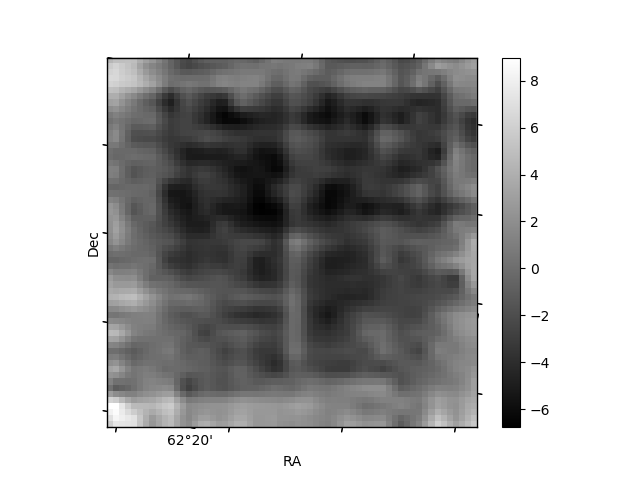
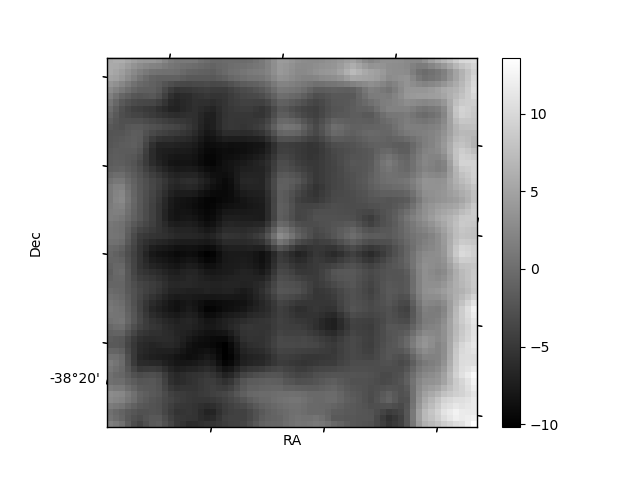
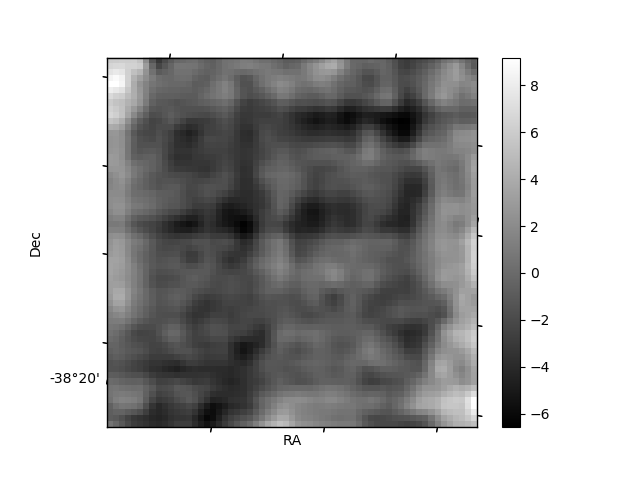
Histogram calculated using DETX and DETY for each event in the final _common_clean file
| Quadrant A | 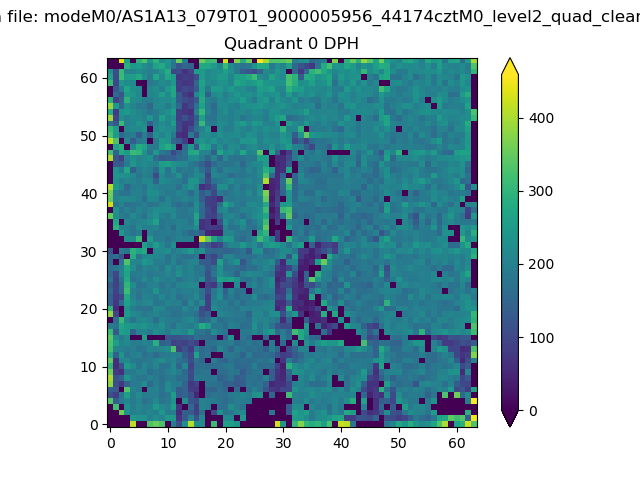 |
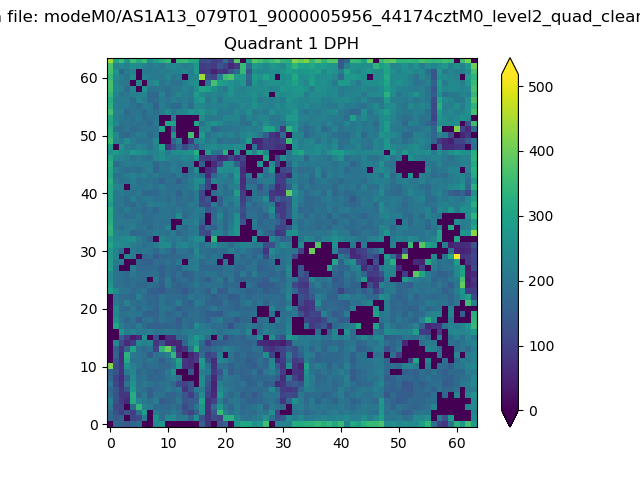 |
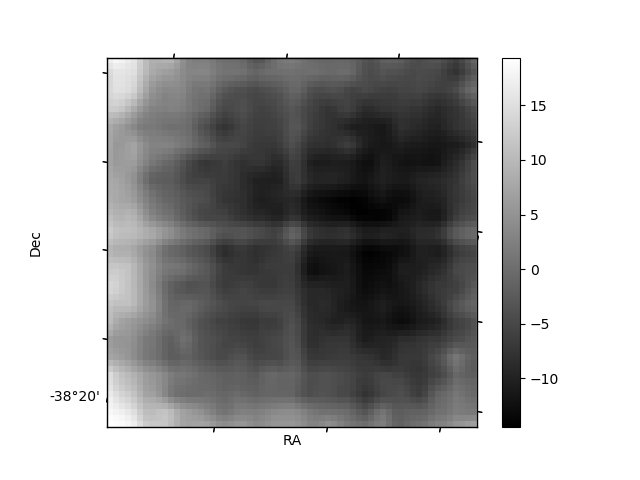
Quadrant B |
|---|---|---|---|
| Quadrant D | 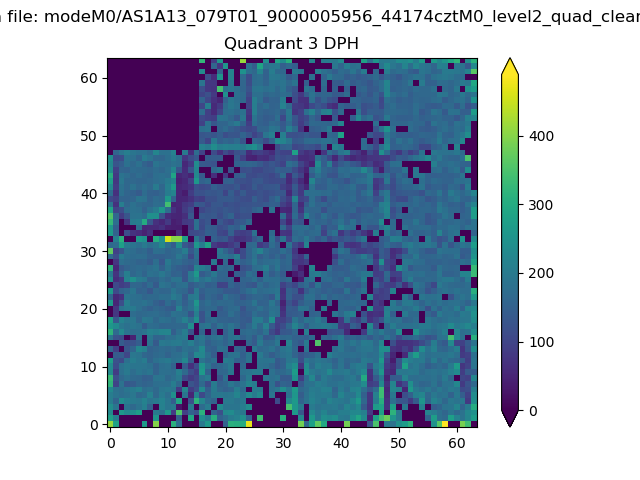 |
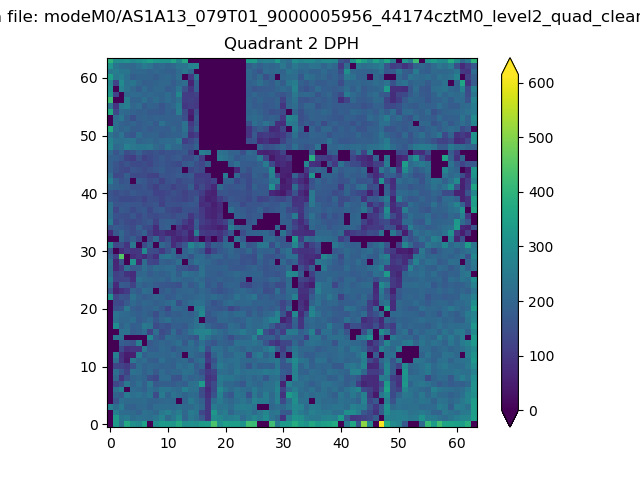 |
Quadrant C |
| Plot type | Count rate plots | Images |
|---|---|---|
| Comparison with Poisson distribution Blue bars denote a histogram of data divided into 1 sec bins. Red curve is a Poisson curve with rate = median count rate of data. |
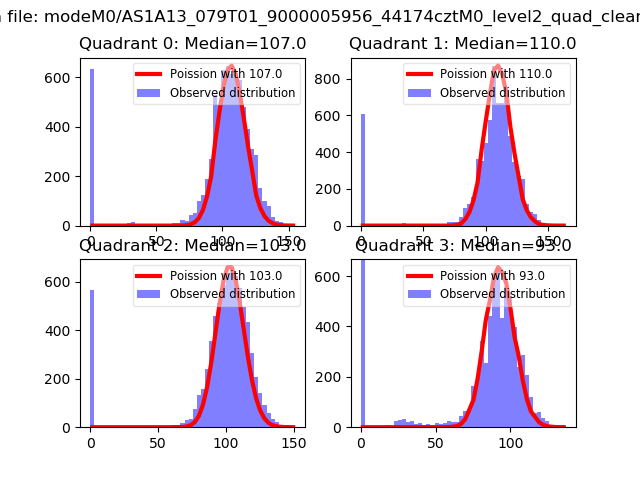 |
 |
| Quadrant-wise count rates Data is divided into 100 sec bins |
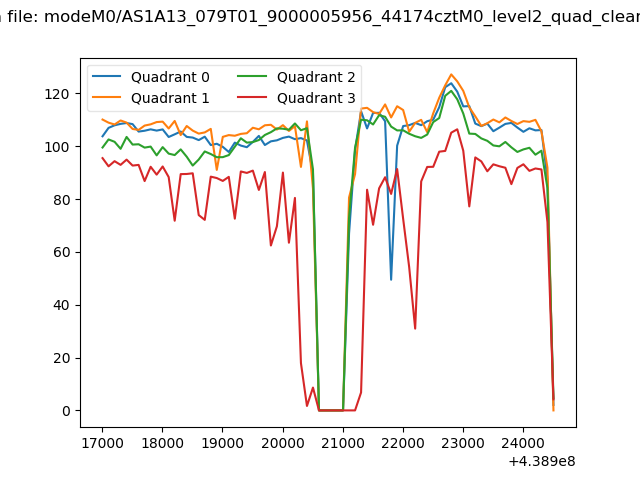 |
|
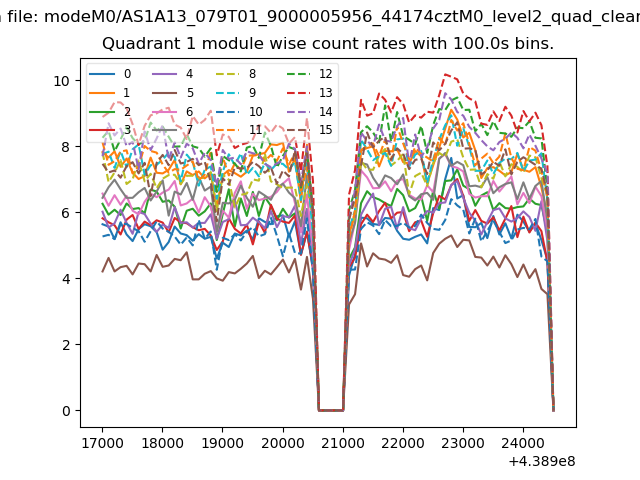
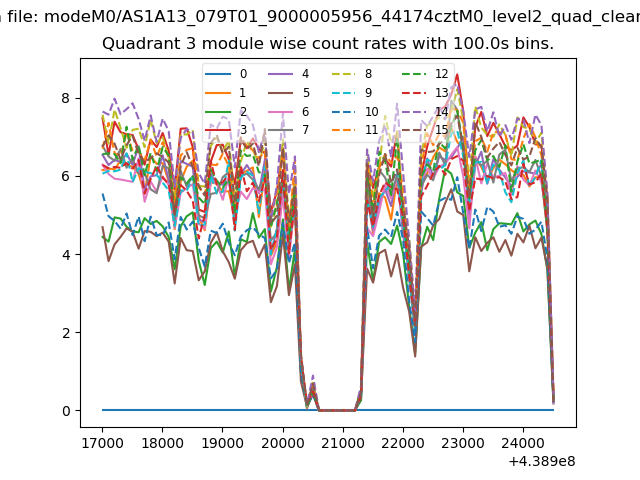
| Module-wise count rates for Quadrant A Data is divided into 100 sec bins |
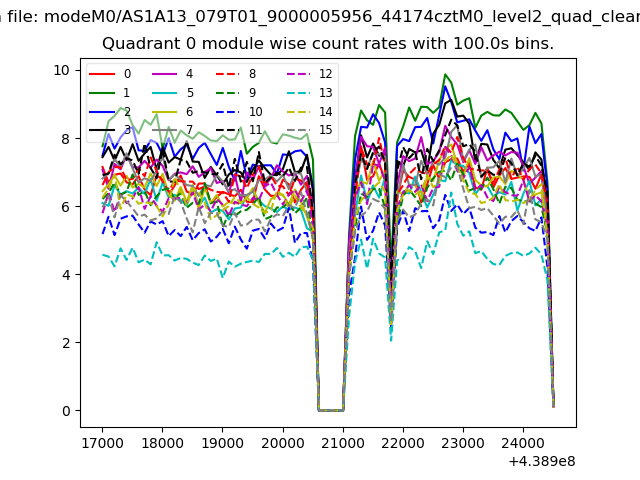 |
 |
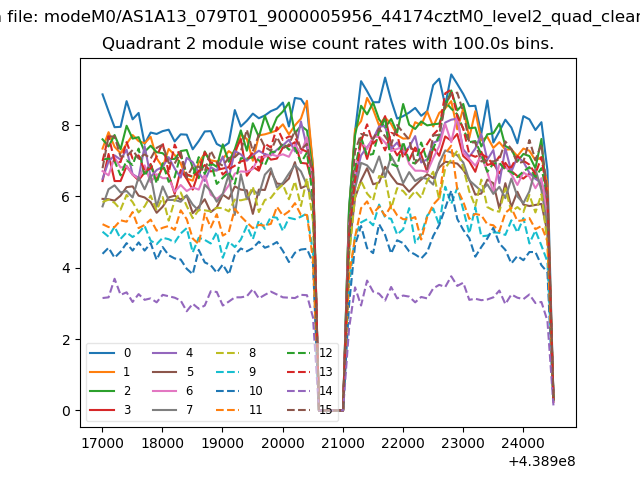
| Module-wise count rates for Quadrant B Data is divided into 100 sec bins |
 |
 |
| Module-wise count rates for Quadrant C Data is divided into 100 sec bins |
 |
 |
| Module-wise count rates for Quadrant D Data is divided into 100 sec bins |
 |
 |
| Parameter | Plot |
|---|---|
| CZT HV Monitor |  |
| D_VDD | 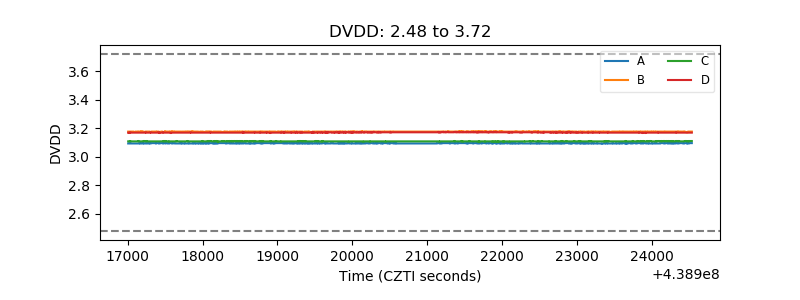 |
| Temperature 1 | 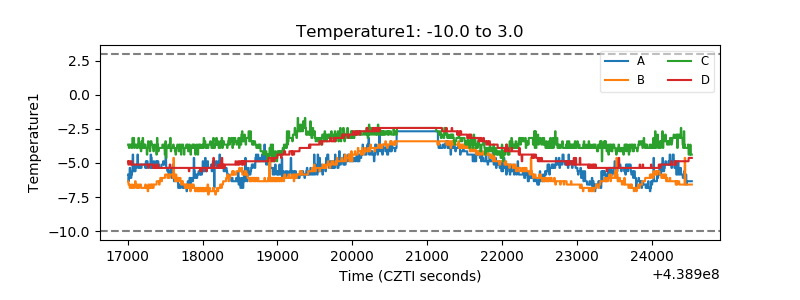 |
| Veto HV Monitor | 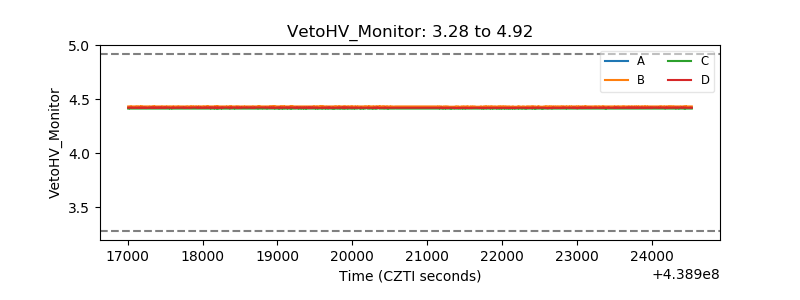 |
| Veto LLD | 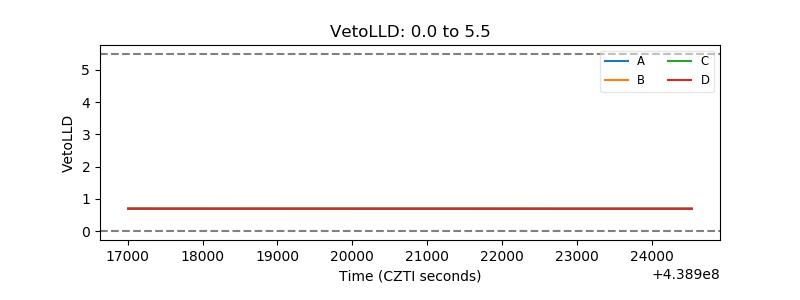 |
| Alpha Counter | 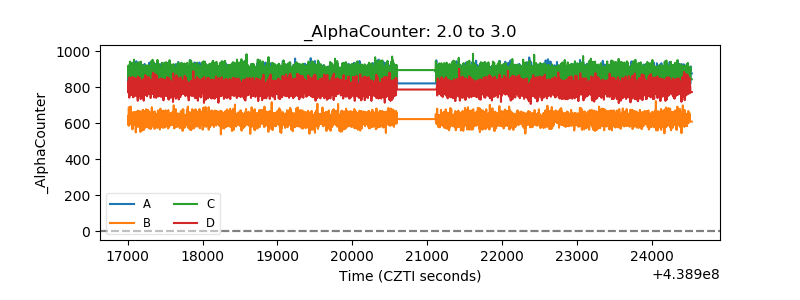 |
| _CPM_Rate | 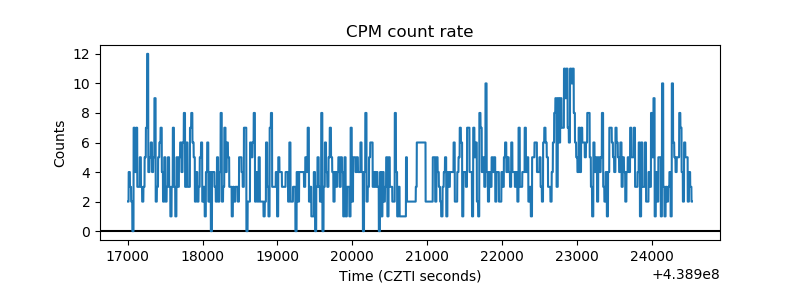 |
| CZT Counter | 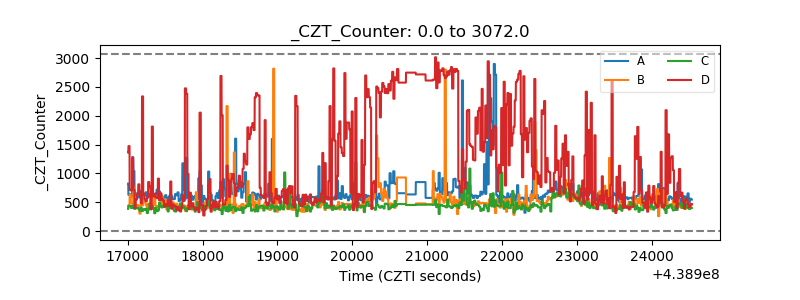 |
| +2.5 Volts monitor | 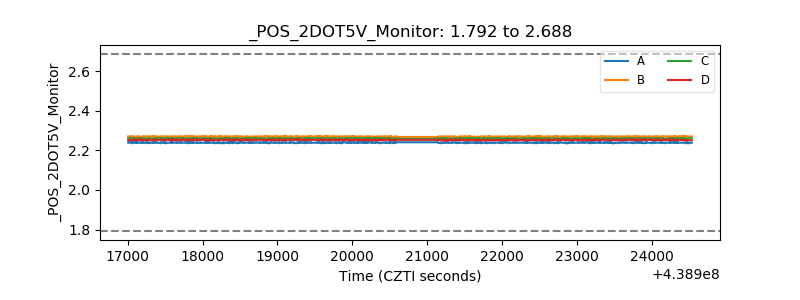 |
| +5 Volts monitor | 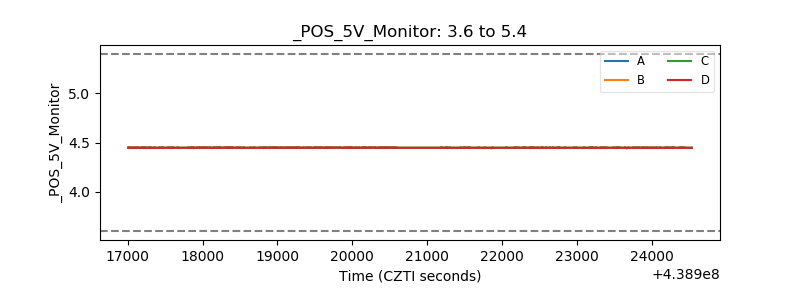 |
| _ROLL_ROT | 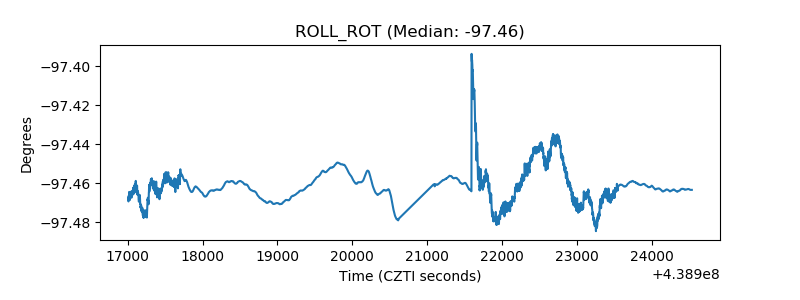 |
| _Roll_DEC | 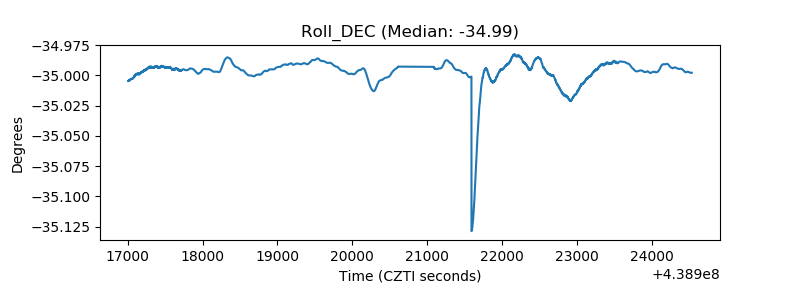 |
| _Roll_RA | 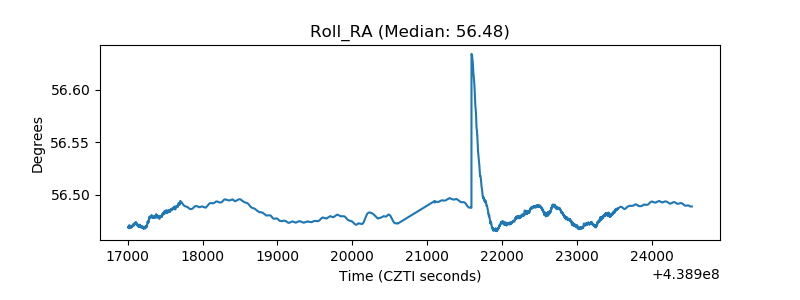 |
| Veto Counter | 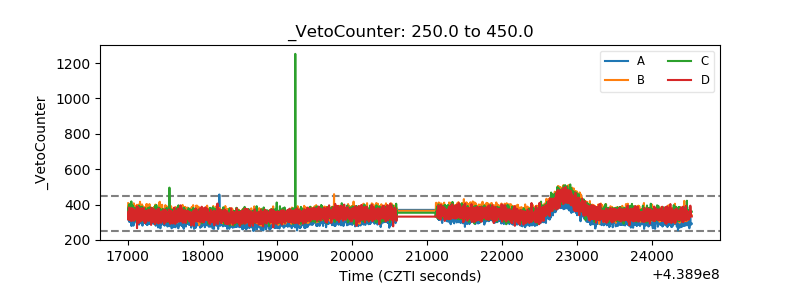 |