| Param | Original file | Final file |
|---|---|---|
| Filename | modeM0/AS1A13_079T01_9000005956_44175cztM0_level2.fits | modeM0/AS1A13_079T01_9000005956_44175cztM0_level2_quad_clean.evt |
| Size (bytes) | 137,185,920 | 31,812,480 |
| Size | 130.8 MB | 30.3 MB |
| Events in quadrant A | 1,260,269 | 217,479 |
| Events in quadrant B | 1,438,594 | 202,576 |
| Events in quadrant C | 1,023,132 | 208,177 |
| Events in quadrant D | 1,199,381 | 190,950 |
| Mode M9 | |||
|---|---|---|---|
| Quadrant | BADHDUFLAG | Total packets | Discarded packets |
| A | 0 | 6 | 6 |
| B | 0 | 5 | 5 |
| C | 0 | 2 | 2 |
| D | 0 | 9 | 9 |
| Mode M0 | |||
|---|---|---|---|
| Quadrant | BADHDUFLAG | Total packets | Discarded packets |
| A | 0 | 6691 | 1664 |
| B | 0 | 7140 | 1476 |
| C | 0 | 6003 | 1532 |
| D | 0 | 7284 | 2378 |
| Mode SS | |||
|---|---|---|---|
| Quadrant | BADHDUFLAG | Total packets | Discarded packets |
| A | 0 | 58 | 18 |
| B | 0 | 55 | 15 |
| C | 0 | 54 | 14 |
| D | 0 | 53 | 13 |
| Quadrant | Total seconds | Saturated seconds | Saturation percentage |
|---|---|---|---|
| A | 1976 | 11 | 0.556680% |
| B | 1990 | 221 | 11.105528% |
| C | 1982 | 5 | 0.252270% |
| D | 1981 | 34 | 1.716305% |
Noise dominated data is calculated using 1-second bins in cleaned event files. If a bin has >2000 counts, and if more than 50% of those come from <1% of pixels, then it is considered to be noise-dominated and hence unusable.
| Quadrant | # 1 sec bins | Bins with >0 counts | Bins with >2000 counts | High rate bins dominated by noise | Noise dominated (total time) | Noise dominated (detector-on time) | Marked lightcurve |
|---|---|---|---|---|---|---|---|
| A | 2102 | 1997 | 0 | 0 | 0.00% | 0.00% | 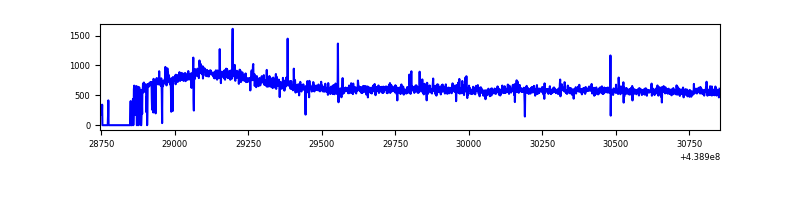 |
| B | 2109 | 2013 | 144 | 144 | 6.83% | 7.15% | 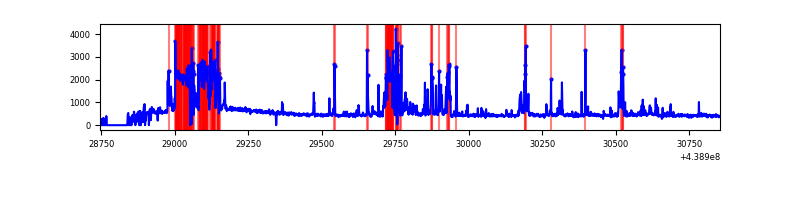 |
| C | 2103 | 2006 | 3 | 3 | 0.14% | 0.15% | 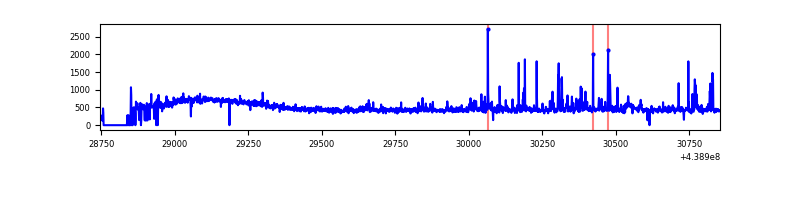 |
| D | 2086 | 2003 | 31 | 31 | 1.49% | 1.55% | 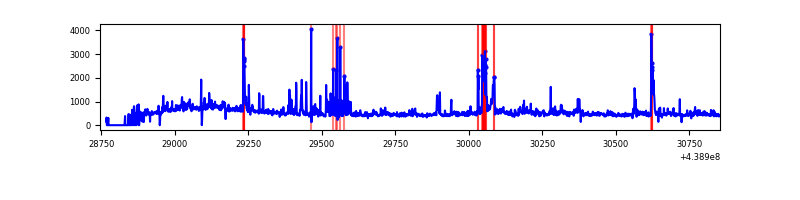 |
Top three noisy pixels from each quadrant. If the there are fewer than three noisy pixels in the level2.evt file, extra rows are filled as -1
| Pixel properties | Quadrant properties | ||||||
|---|---|---|---|---|---|---|---|
| Quadrant | DetID | PixID | Counts | Sigma | Mean | Median | Sigma |
| A | 10 | 83 | 327544 | 6400.6 | 235 | 229 | 51.1 |
| A | 15 | 223 | 19367 | 374.24 | 235 | 229 | 51.1 |
| A | 7 | 3 | 3780 | 69.44 | 235 | 229 | 51.1 |
| B | 5 | 172 | 519142 | 11303.61 | 218 | 211 | 45.9 |
| B | 0 | 189 | 13399 | 287.27 | 218 | 211 | 45.9 |
| B | 4 | 158 | 10983 | 234.64 | 218 | 211 | 45.9 |
| C | 14 | 254 | 80075 | 1382.57 | 236 | 237 | 57.7 |
| C | 8 | 13 | 8360 | 140.67 | 236 | 237 | 57.7 |
| C | 3 | 233 | 4370 | 71.57 | 236 | 237 | 57.7 |
| D | 2 | 249 | 68888 | 1141.21 | 232 | 224 | 60.2 |
| D | 13 | 187 | 63940 | 1058.98 | 232 | 224 | 60.2 |
| D | 13 | 171 | 54811 | 907.25 | 232 | 224 | 60.2 |
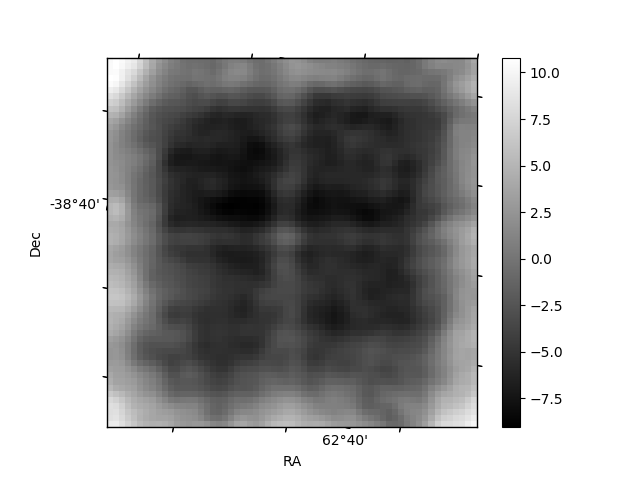
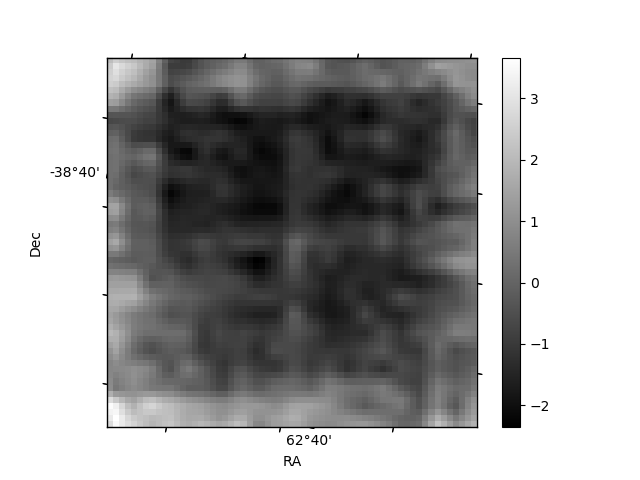
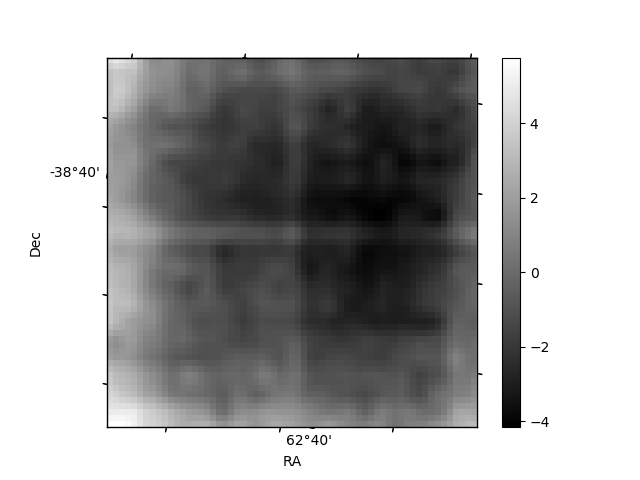
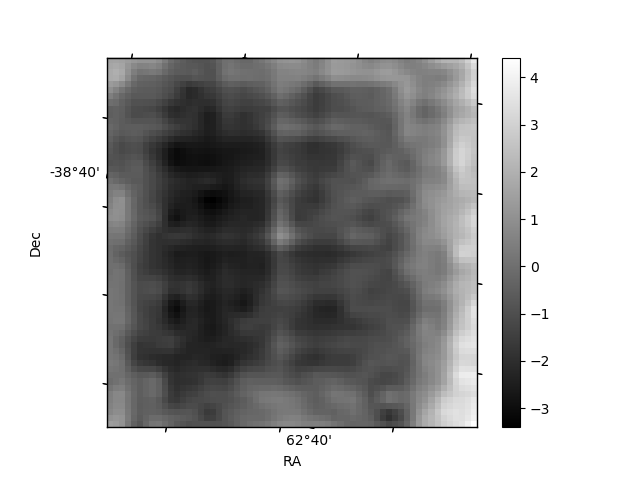
Histogram calculated using DETX and DETY for each event in the final _common_clean file
| Quadrant A | 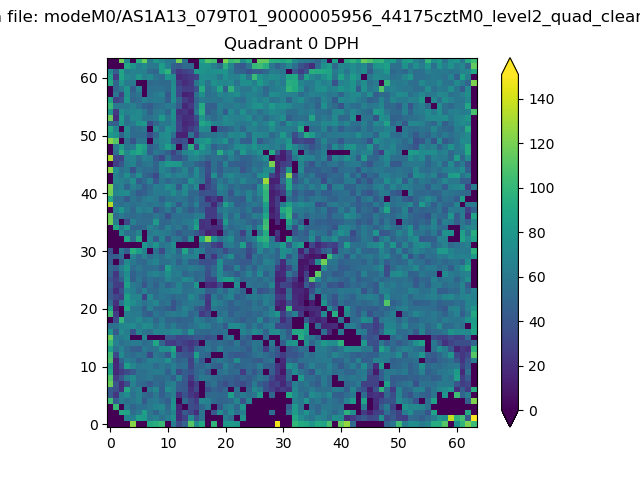 |
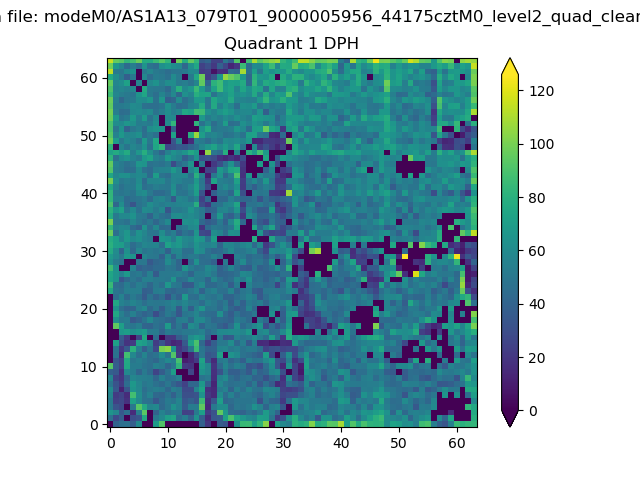 |
Quadrant B |
|---|---|---|---|
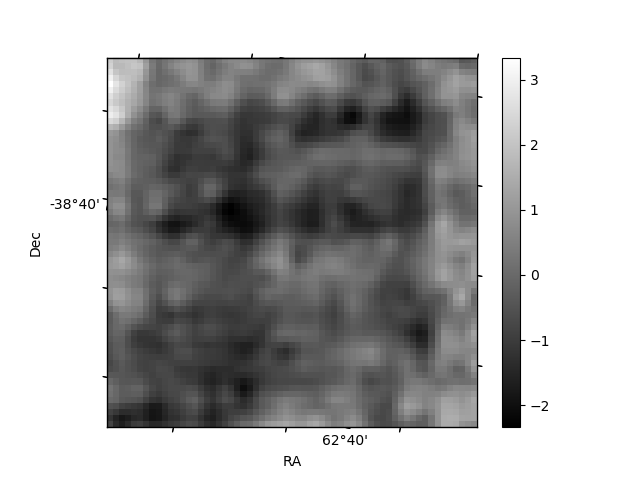
| Quadrant D | 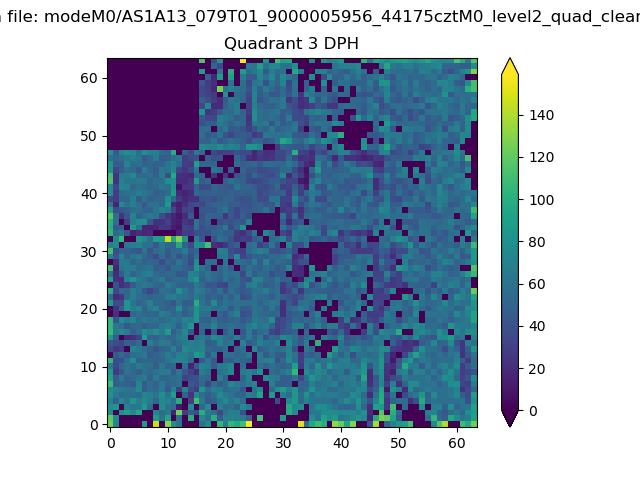 |
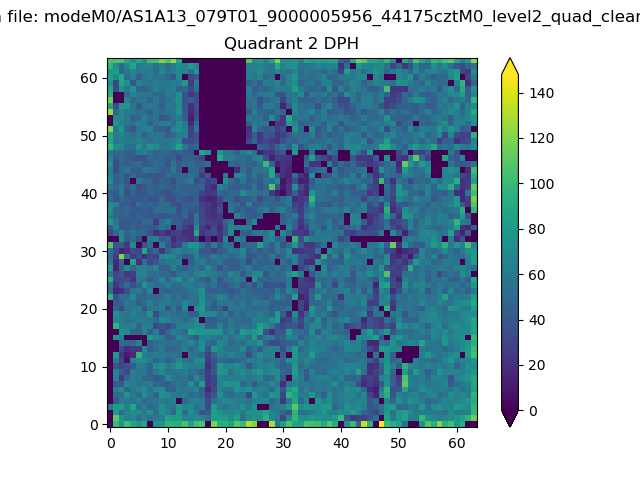 |
Quadrant C |
| Plot type | Count rate plots | Images |
|---|---|---|
| Comparison with Poisson distribution Blue bars denote a histogram of data divided into 1 sec bins. Red curve is a Poisson curve with rate = median count rate of data. |
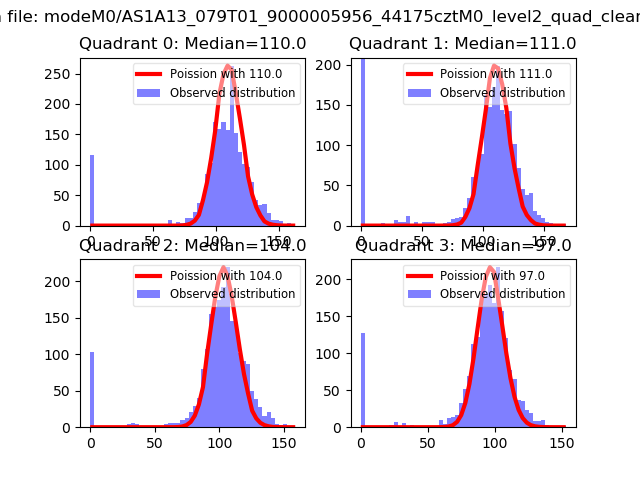 |
 |
| Quadrant-wise count rates Data is divided into 100 sec bins |
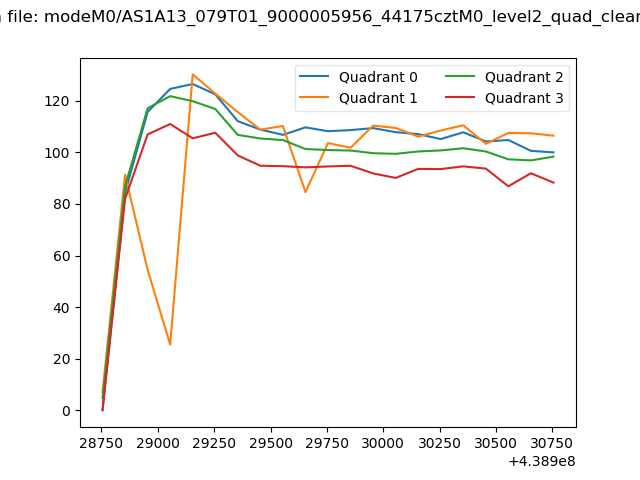 |
|
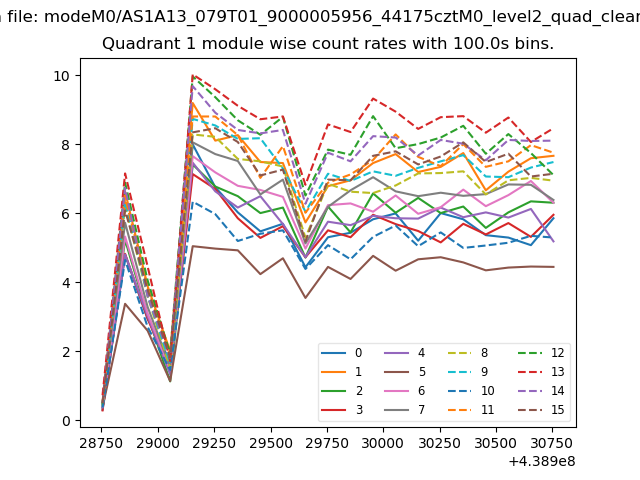
| Module-wise count rates for Quadrant A Data is divided into 100 sec bins |
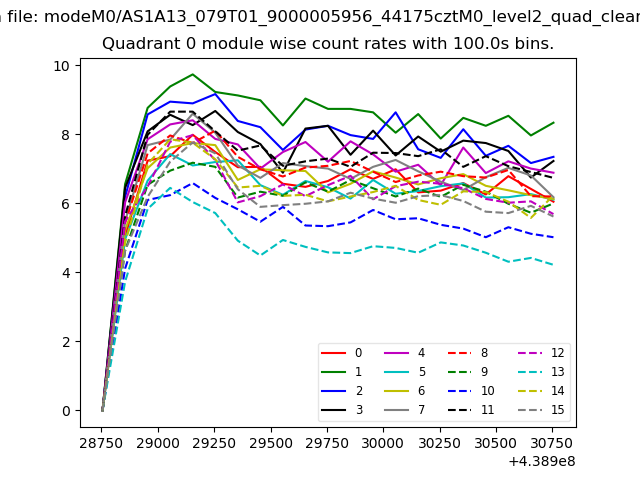 |
 |
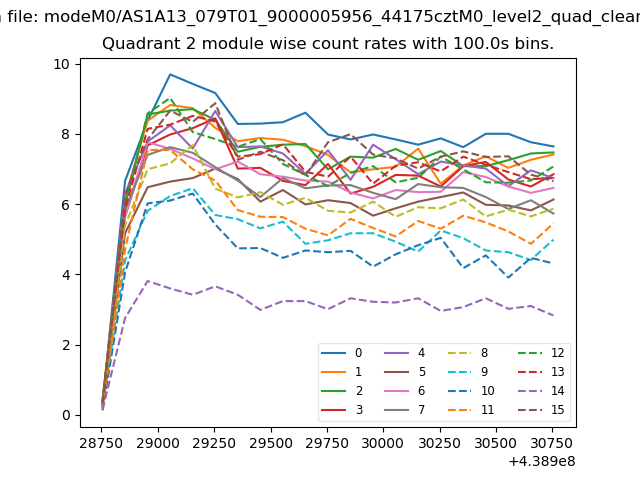
| Module-wise count rates for Quadrant B Data is divided into 100 sec bins |
 |
 |
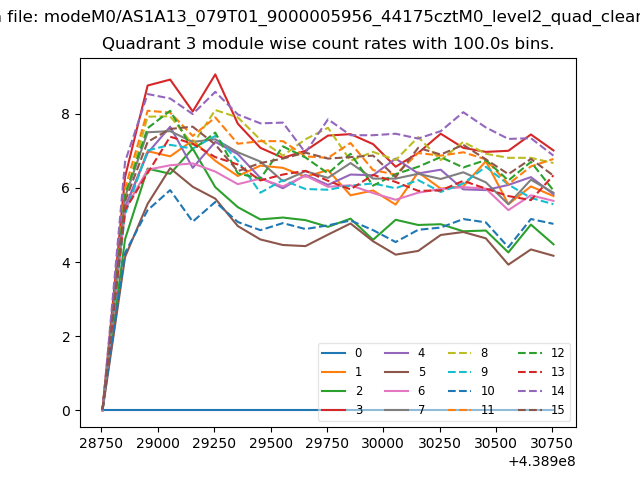
| Module-wise count rates for Quadrant C Data is divided into 100 sec bins |
 |
 |
| Module-wise count rates for Quadrant D Data is divided into 100 sec bins |
 |
 |
| Parameter | Plot |
|---|---|
| CZT HV Monitor | 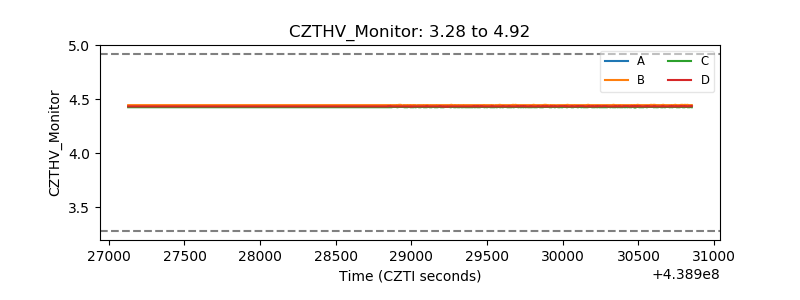 |
| D_VDD | 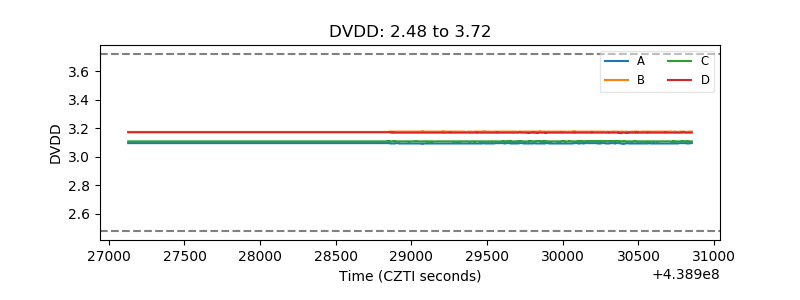 |
| Temperature 1 | 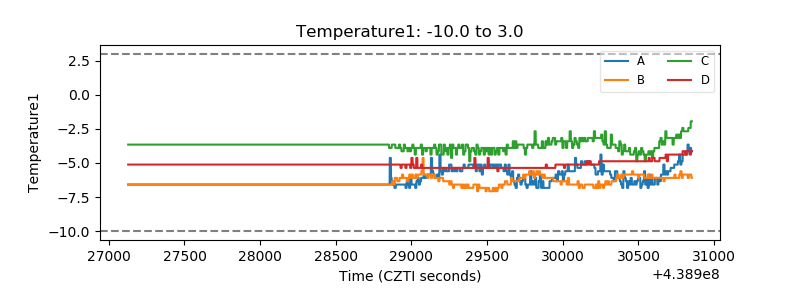 |
| Veto HV Monitor | 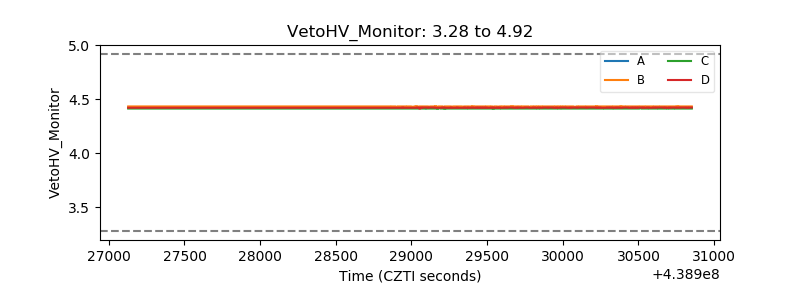 |
| Veto LLD | 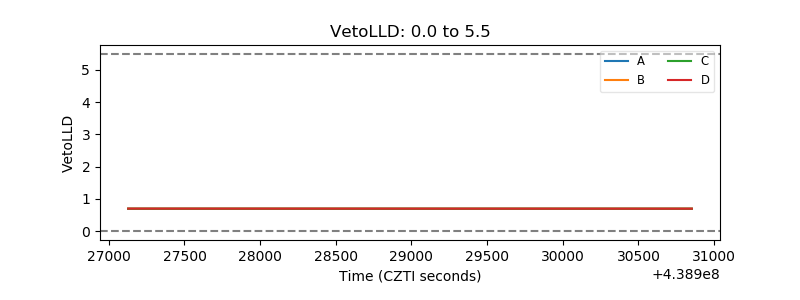 |
| Alpha Counter | 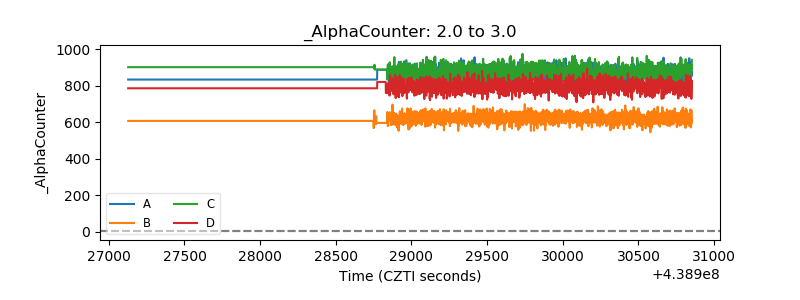 |
| _CPM_Rate | 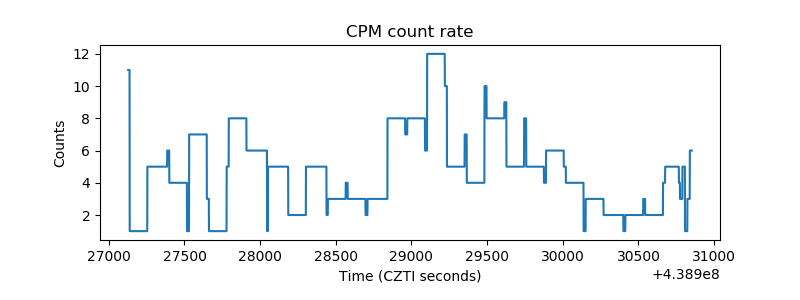 |
| CZT Counter | 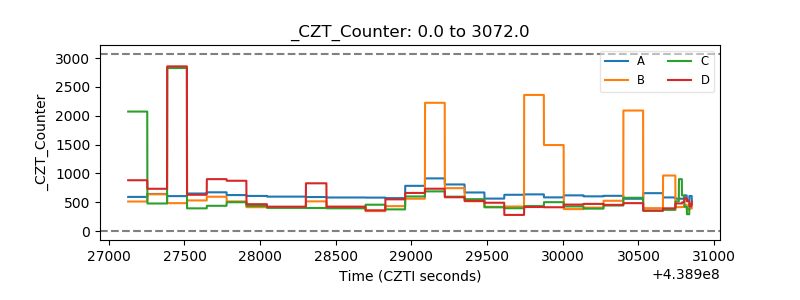 |
| +2.5 Volts monitor | 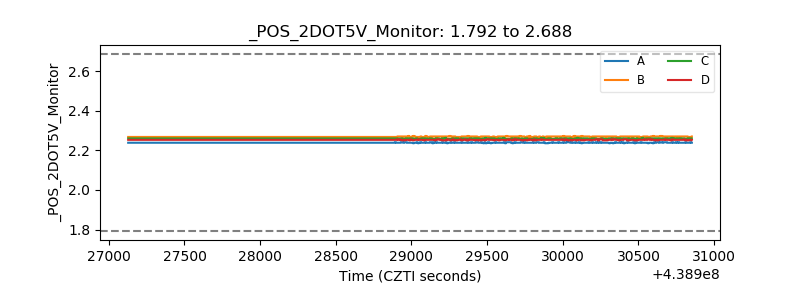 |
| +5 Volts monitor | 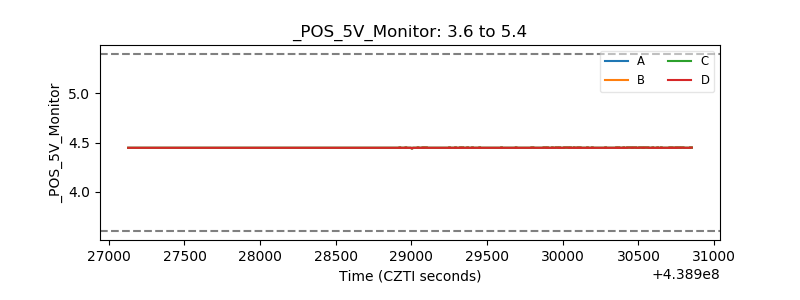 |
| _ROLL_ROT | 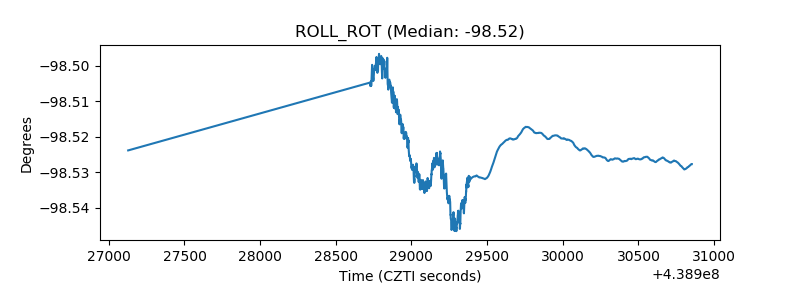 |
| _Roll_DEC | 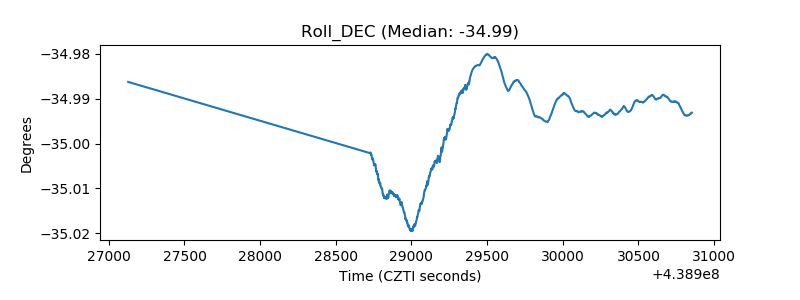 |
| _Roll_RA | 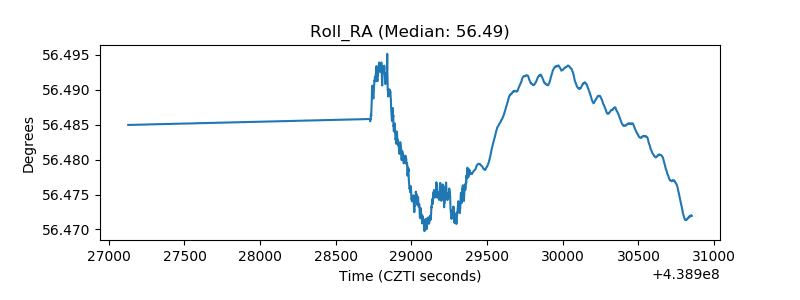 |
| Veto Counter | 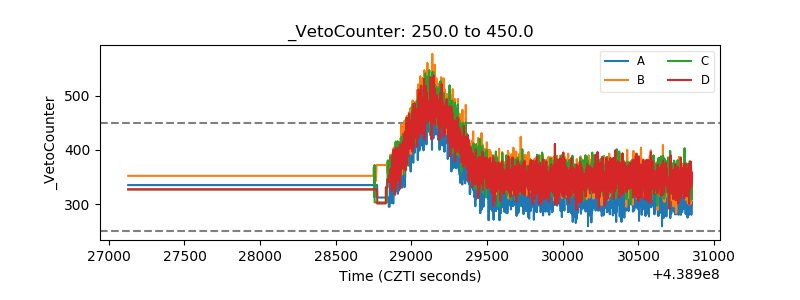 |