| Param | Original file | Final file |
|---|---|---|
| Filename | modeM0/AS1A13_079T01_9000005956_44178cztM0_level2.fits | modeM0/AS1A13_079T01_9000005956_44178cztM0_level2_quad_clean.evt |
| Size (bytes) | 992,874,240 | 215,858,880 |
| Size | 946.9 MB | 205.9 MB |
| Events in quadrant A | 9,363,276 | 1,435,161 |
| Events in quadrant B | 8,268,964 | 1,429,480 |
| Events in quadrant C | 7,478,153 | 1,415,039 |
| Events in quadrant D | 10,499,887 | 1,237,969 |
| Mode M9 | |||
|---|---|---|---|
| Quadrant | BADHDUFLAG | Total packets | Discarded packets |
| A | 0 | 4 | 0 |
| B | 0 | 6 | 2 |
| C | 0 | 4 | 0 |
| D | 0 | 4 | 0 |
| Mode M0 | |||
|---|---|---|---|
| Quadrant | BADHDUFLAG | Total packets | Discarded packets |
| A | 0 | 37977 | 238 |
| B | 0 | 34904 | 200 |
| C | 0 | 33197 | 201 |
| D | 0 | 41716 | 342 |
| Mode SS | |||
|---|---|---|---|
| Quadrant | BADHDUFLAG | Total packets | Discarded packets |
| A | 0 | 296 | 0 |
| B | 0 | 296 | 2 |
| C | 0 | 296 | 0 |
| D | 0 | 297 | 3 |
| Quadrant | Total seconds | Saturated seconds | Saturation percentage |
|---|---|---|---|
| A | 14751 | 488 | 3.308250% |
| B | 14756 | 882 | 5.977230% |
| C | 14752 | 461 | 3.125000% |
| D | 14743 | 1081 | 7.332293% |
Noise dominated data is calculated using 1-second bins in cleaned event files. If a bin has >2000 counts, and if more than 50% of those come from <1% of pixels, then it is considered to be noise-dominated and hence unusable.
| Quadrant | # 1 sec bins | Bins with >0 counts | Bins with >2000 counts | High rate bins dominated by noise | Noise dominated (total time) | Noise dominated (detector-on time) | Marked lightcurve |
|---|---|---|---|---|---|---|---|
| A | 16887 | 14778 | 20 | 20 | 0.12% | 0.14% | 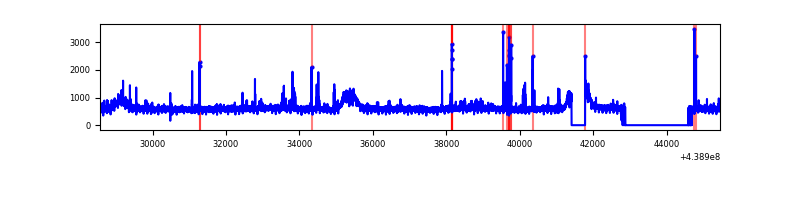 |
| B | 16887 | 14787 | 241 | 241 | 1.43% | 1.63% | 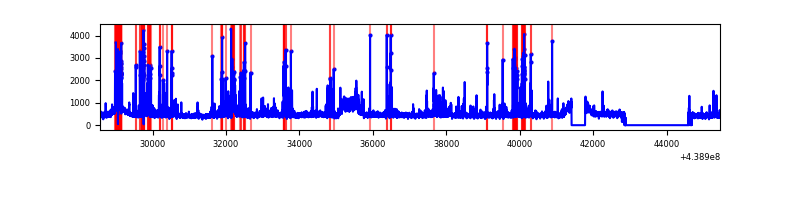 |
| C | 16887 | 14781 | 74 | 74 | 0.44% | 0.50% | 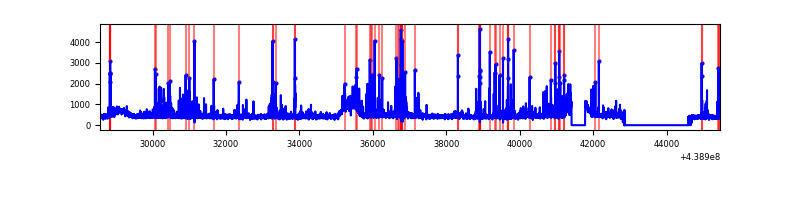 |
| D | 16887 | 14770 | 649 | 649 | 3.84% | 4.39% | 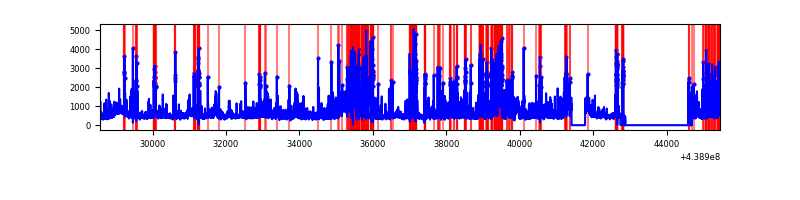 |
Top three noisy pixels from each quadrant. If the there are fewer than three noisy pixels in the level2.evt file, extra rows are filled as -1
| Pixel properties | Quadrant properties | ||||||
|---|---|---|---|---|---|---|---|
| Quadrant | DetID | PixID | Counts | Sigma | Mean | Median | Sigma |
| A | 10 | 83 | 2532888 | 7109.3 | 1692 | 1653 | 356.0 |
| A | 15 | 223 | 117610 | 325.68 | 1692 | 1653 | 356.0 |
| A | 7 | 3 | 104902 | 289.99 | 1692 | 1653 | 356.0 |
| B | 5 | 172 | 952697 | 2876.62 | 1656 | 1602 | 330.6 |
| B | 0 | 200 | 275176 | 827.43 | 1656 | 1602 | 330.6 |
| B | 0 | 189 | 235611 | 707.77 | 1656 | 1602 | 330.6 |
| C | 14 | 254 | 726033 | 1835.13 | 1667 | 1679 | 394.7 |
| C | 9 | 54 | 68834 | 170.14 | 1667 | 1679 | 394.7 |
| C | 3 | 233 | 58778 | 144.66 | 1667 | 1679 | 394.7 |
| D | 13 | 249 | 1600578 | 3892.93 | 1616 | 1562 | 410.7 |
| D | 1 | 52 | 1217184 | 2959.53 | 1616 | 1562 | 410.7 |
| D | 1 | 47 | 429682 | 1042.29 | 1616 | 1562 | 410.7 |
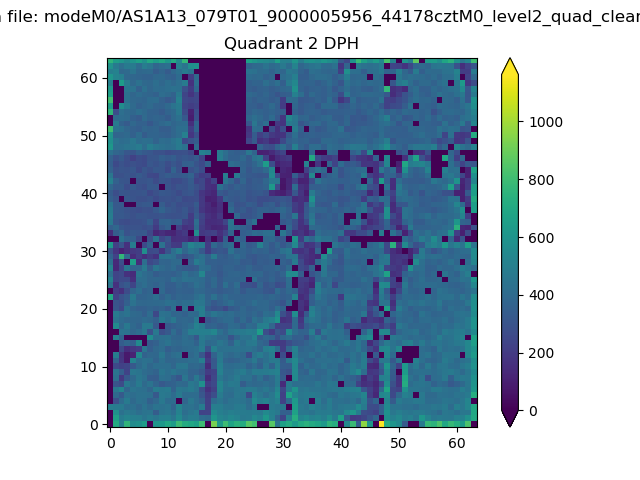
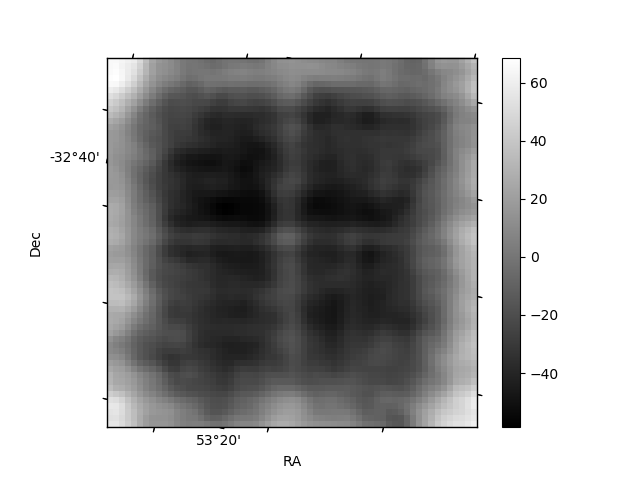
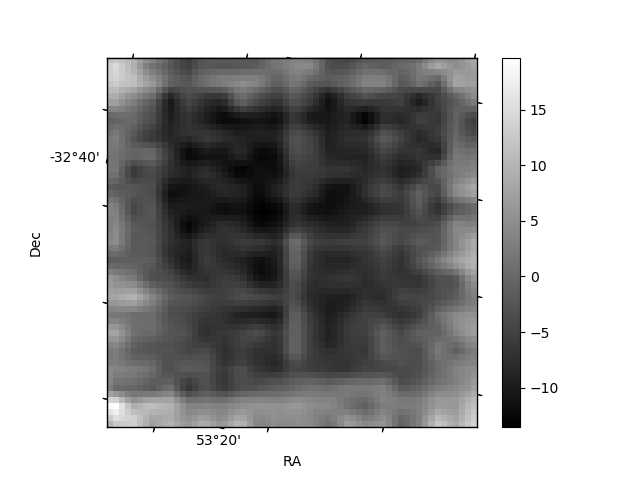
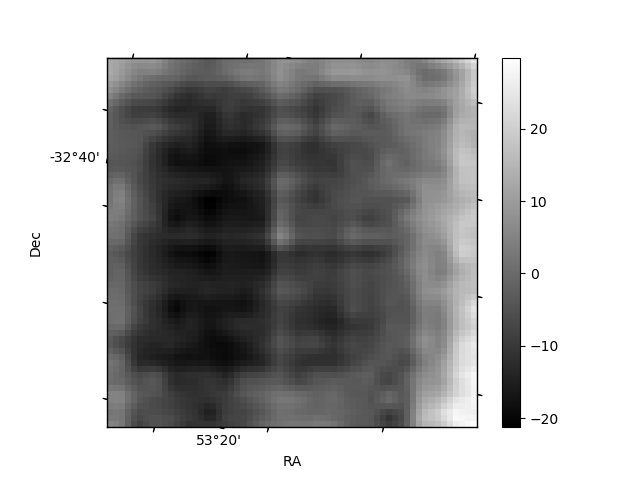
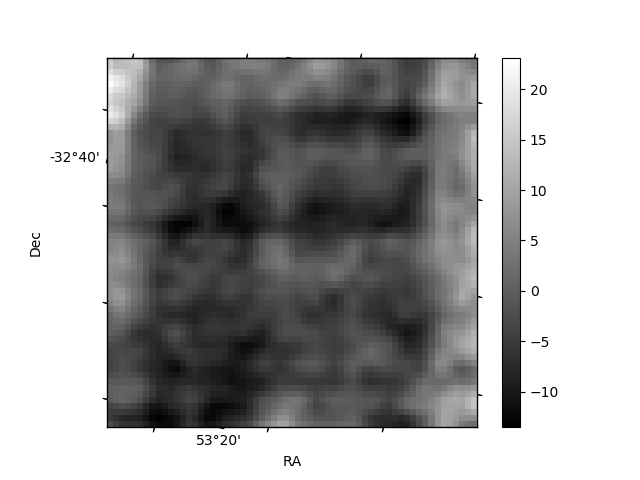
Histogram calculated using DETX and DETY for each event in the final _common_clean file
| Quadrant A | 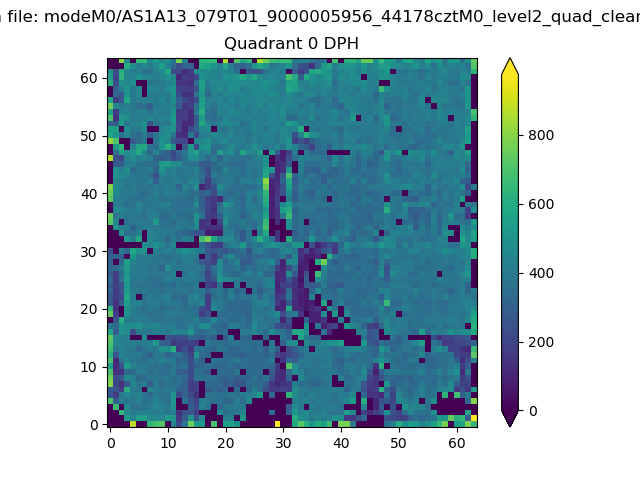 |
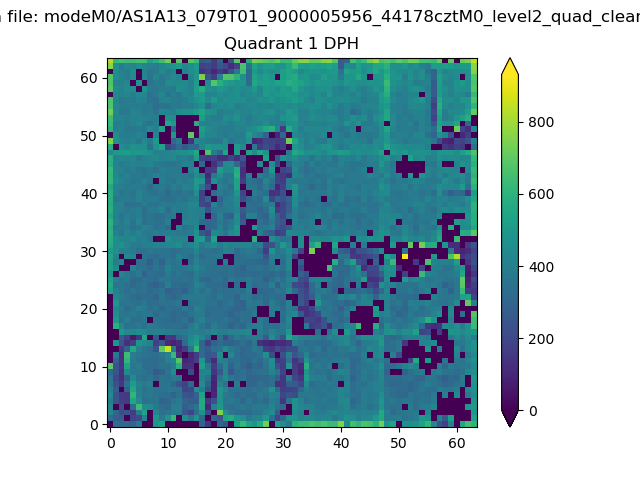 |
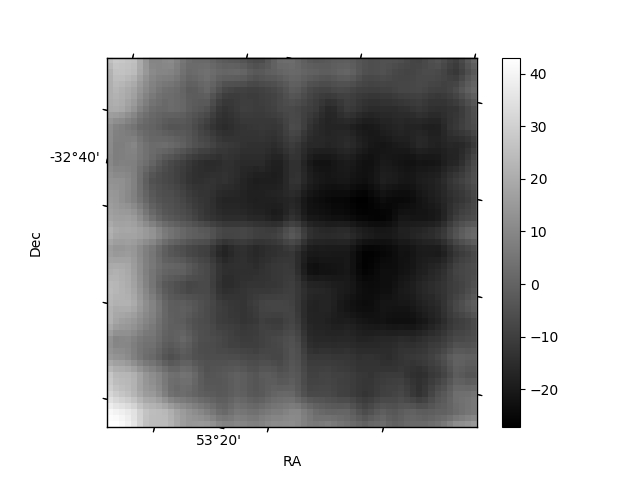
Quadrant B |
|---|---|---|---|
| Quadrant D | 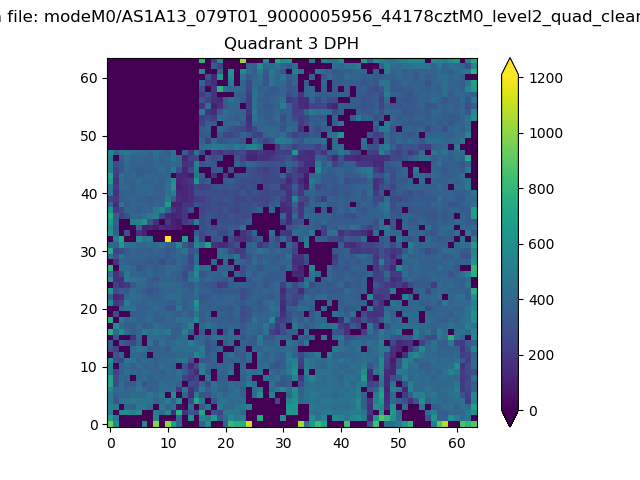 |
 |
Quadrant C |
| Plot type | Count rate plots | Images |
|---|---|---|
| Comparison with Poisson distribution Blue bars denote a histogram of data divided into 1 sec bins. Red curve is a Poisson curve with rate = median count rate of data. |
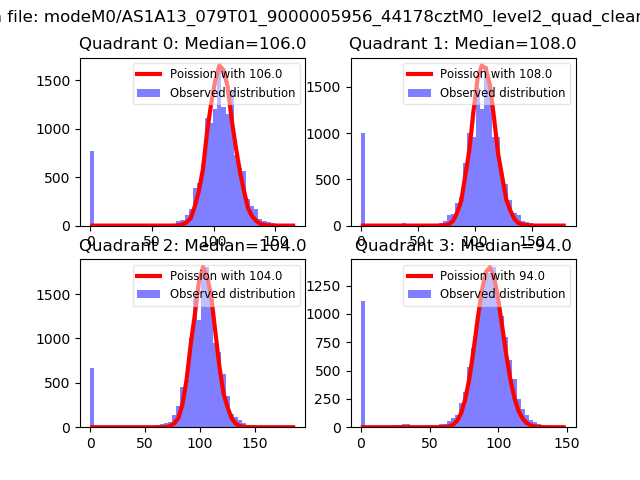 |
 |
| Quadrant-wise count rates Data is divided into 100 sec bins |
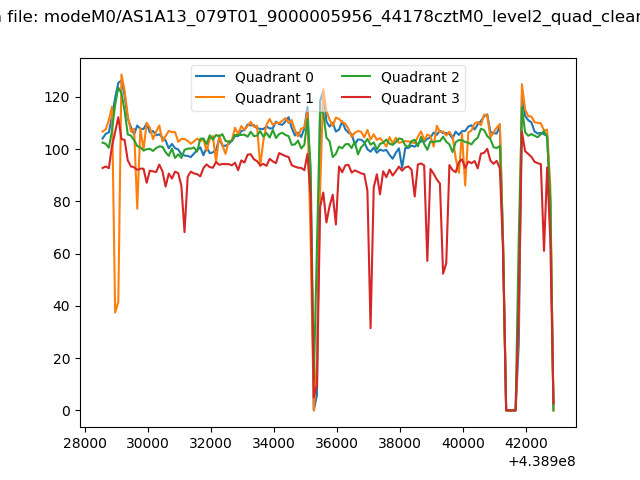 |
|
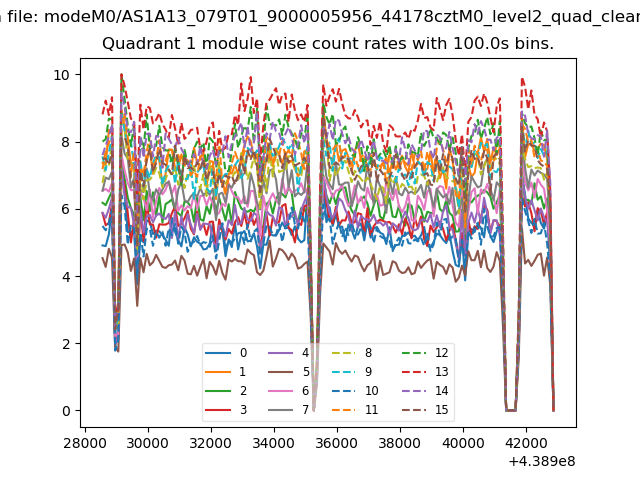
| Module-wise count rates for Quadrant A Data is divided into 100 sec bins |
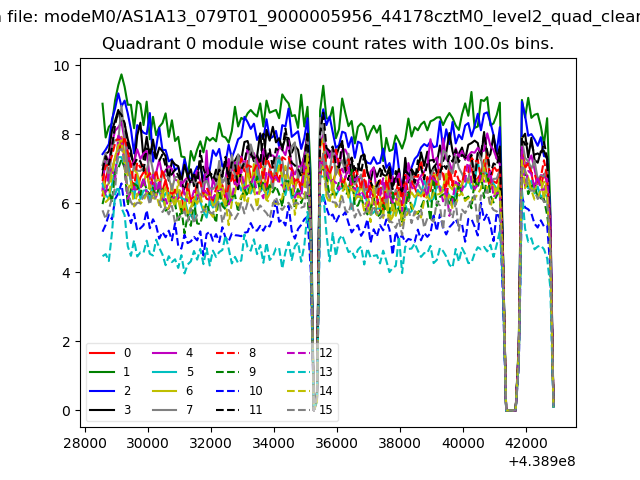 |
 |
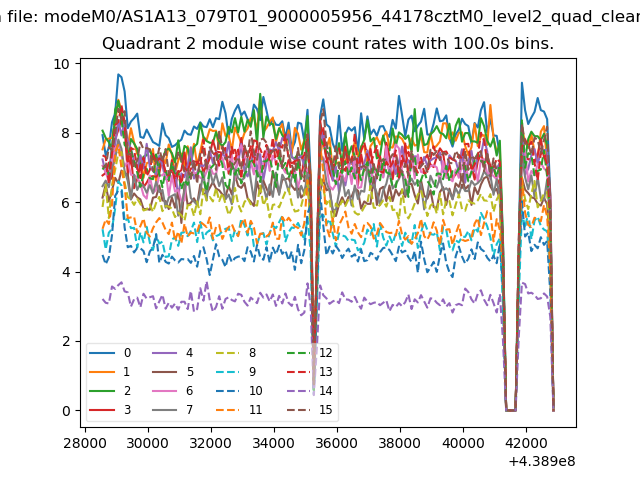
| Module-wise count rates for Quadrant B Data is divided into 100 sec bins |
 |
 |
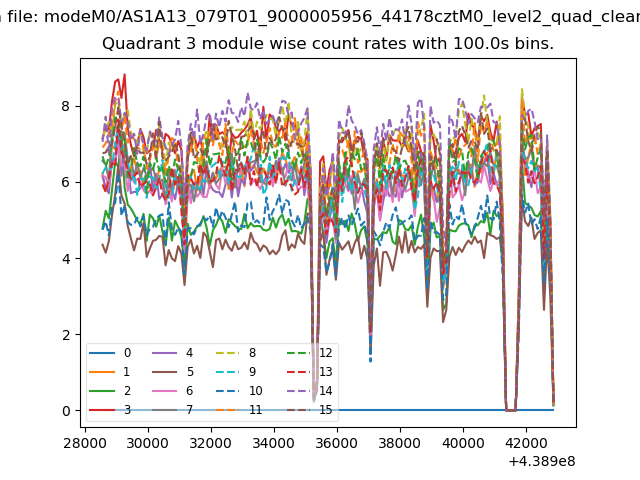
| Module-wise count rates for Quadrant C Data is divided into 100 sec bins |
 |
 |
| Module-wise count rates for Quadrant D Data is divided into 100 sec bins |
 |
 |
| Parameter | Plot |
|---|---|
| CZT HV Monitor | 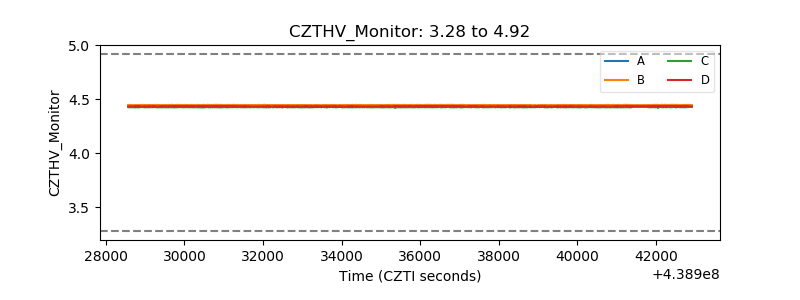 |
| D_VDD | 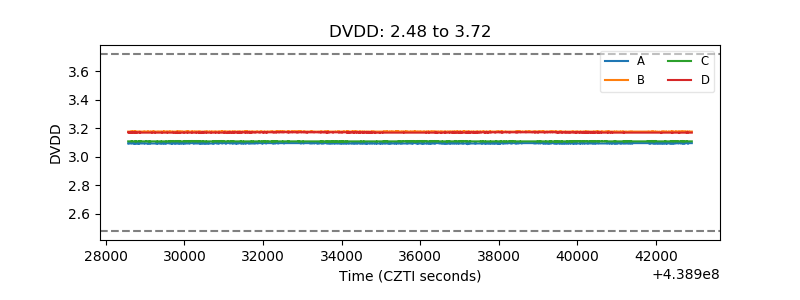 |
| Temperature 1 | 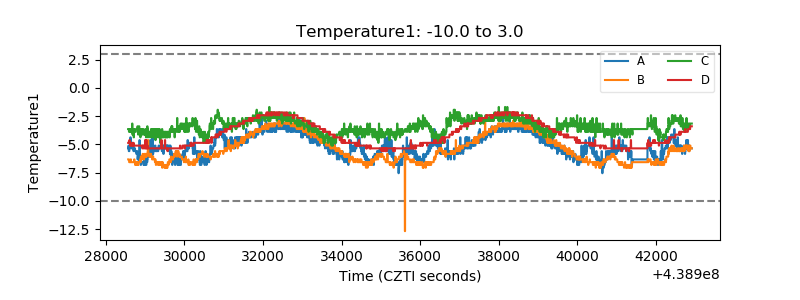 |
| Veto HV Monitor | 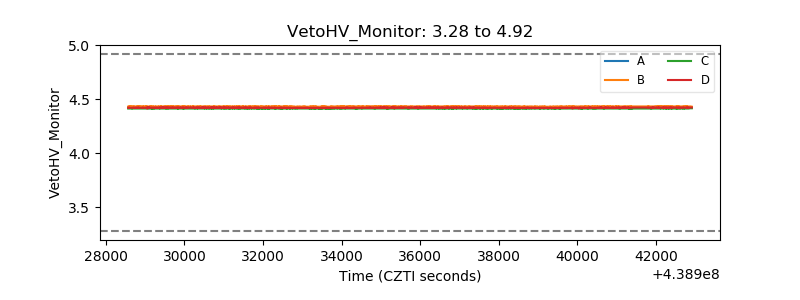 |
| Veto LLD | 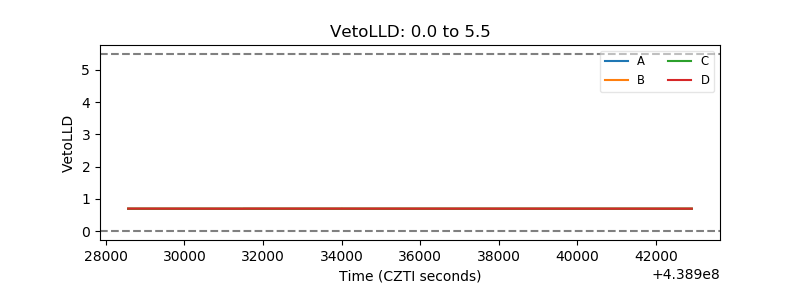 |
| Alpha Counter | 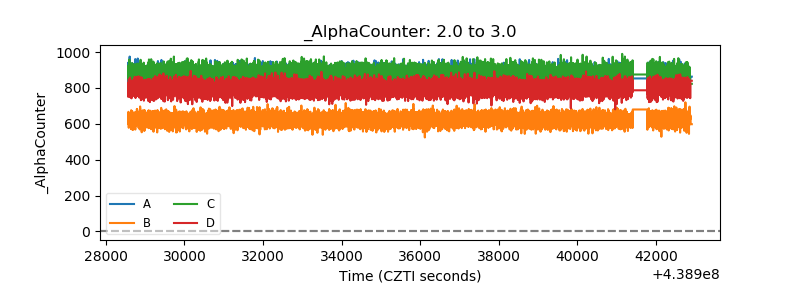 |
| _CPM_Rate | 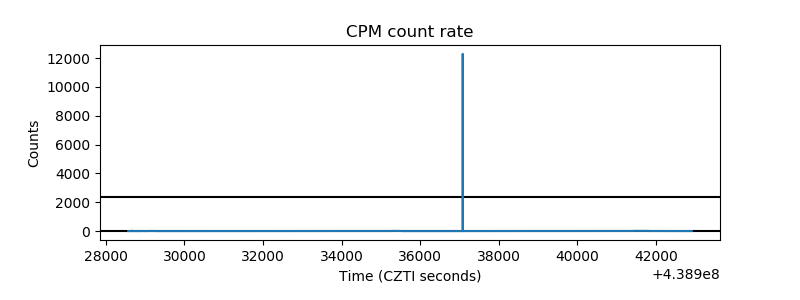 |
| CZT Counter | 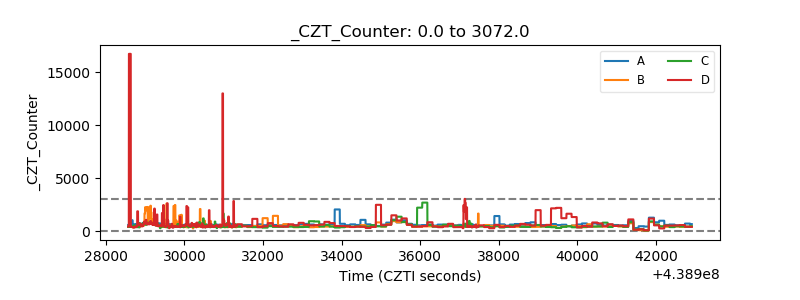 |
| +2.5 Volts monitor | 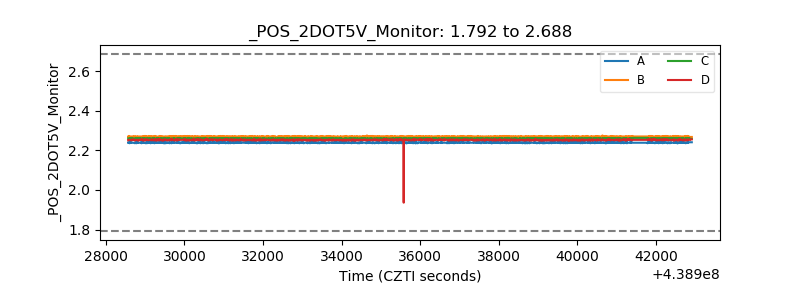 |
| +5 Volts monitor | 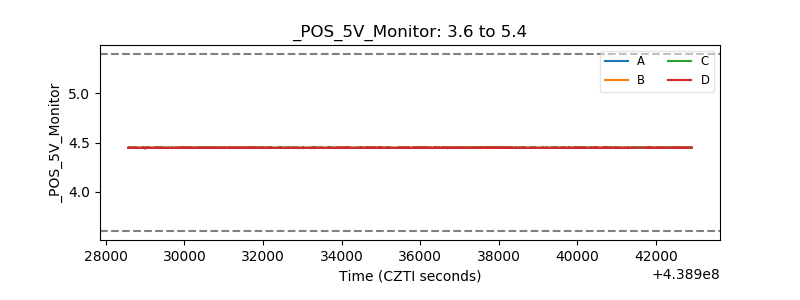 |
| _ROLL_ROT | 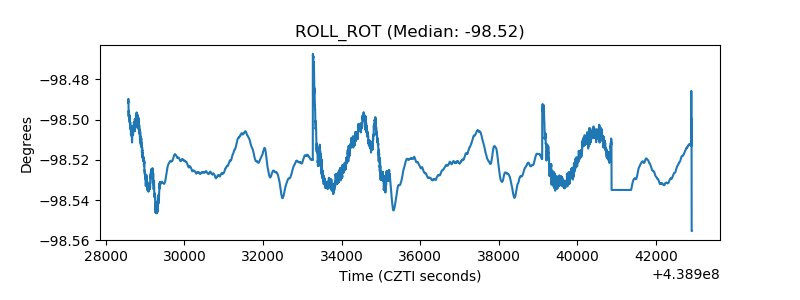 |
| _Roll_DEC | 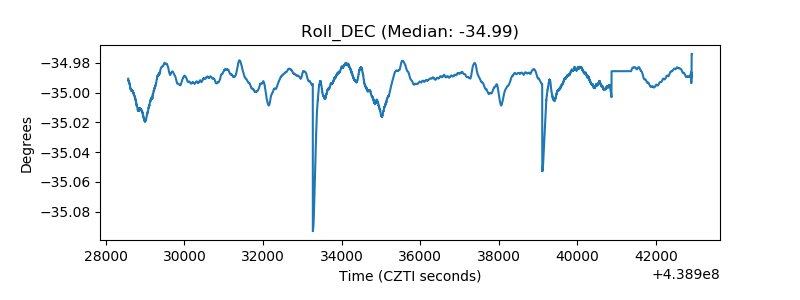 |
| _Roll_RA | 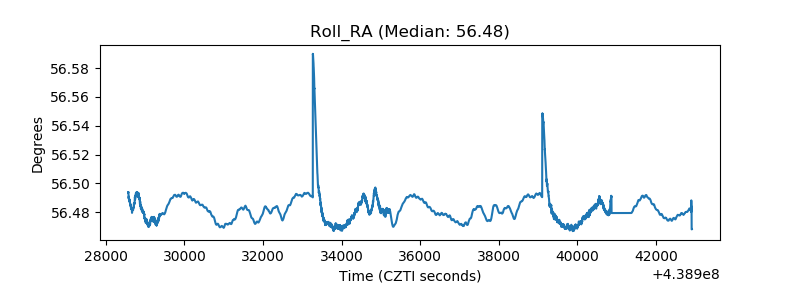 |
| Veto Counter | 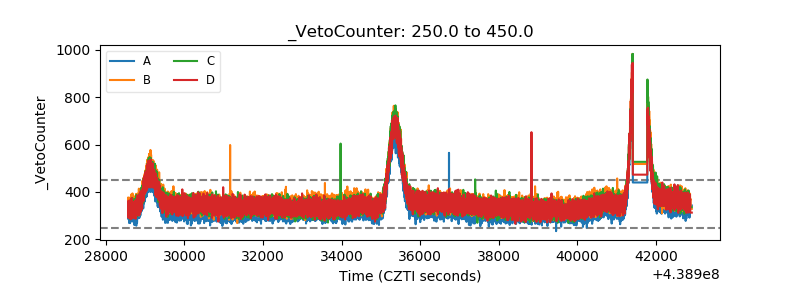 |