| Param | Original file | Final file |
|---|---|---|
| Filename | modeM0/AS1A13_074T04_9000005962_44185cztM0_level2.fits | modeM0/AS1A13_074T04_9000005962_44185cztM0_level2_quad_clean.evt |
| Size (bytes) | 337,314,240 | 63,570,240 |
| Size | 321.7 MB | 60.6 MB |
| Events in quadrant A | 4,160,569 | 387,312 |
| Events in quadrant B | 2,155,930 | 463,497 |
| Events in quadrant C | 2,067,451 | 440,603 |
| Events in quadrant D | 3,800,064 | 359,771 |
| Mode SS | |||
|---|---|---|---|
| Quadrant | BADHDUFLAG | Total packets | Discarded packets |
| A | 0 | 80 | 0 |
| B | 0 | 80 | 0 |
| C | 0 | 80 | 0 |
| D | 0 | 80 | 0 |
| Mode M0 | |||
|---|---|---|---|
| Quadrant | BADHDUFLAG | Total packets | Discarded packets |
| A | 0 | 15248 | 1 |
| B | 0 | 8945 | 1 |
| C | 0 | 8752 | 2 |
| D | 0 | 13922 | 1 |
| Mode M9 | |||
|---|---|---|---|
| Quadrant | BADHDUFLAG | Total packets | Discarded packets |
| A | 0 | 12 | 0 |
| B | 0 | 12 | 0 |
| C | 0 | 12 | 0 |
| D | 0 | 12 | 0 |
| Quadrant | Total seconds | Saturated seconds | Saturation percentage |
|---|---|---|---|
| A | 3876 | 696 | 17.956656% |
| B | 3876 | 131 | 3.379773% |
| C | 3875 | 75 | 1.935484% |
| D | 3875 | 580 | 14.967742% |
Noise dominated data is calculated using 1-second bins in cleaned event files. If a bin has >2000 counts, and if more than 50% of those come from <1% of pixels, then it is considered to be noise-dominated and hence unusable.
| Quadrant | # 1 sec bins | Bins with >0 counts | Bins with >2000 counts | High rate bins dominated by noise | Noise dominated (total time) | Noise dominated (detector-on time) | Marked lightcurve |
|---|---|---|---|---|---|---|---|
| A | 5047 | 3877 | 475 | 475 | 9.41% | 12.25% | 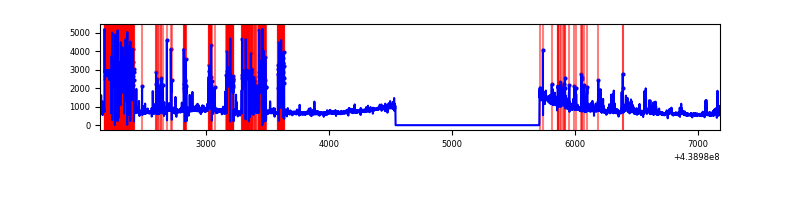 |
| B | 5047 | 3877 | 17 | 17 | 0.34% | 0.44% | 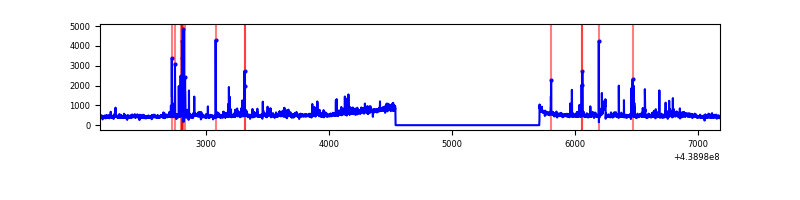 |
| C | 5046 | 3876 | 17 | 17 | 0.34% | 0.44% | 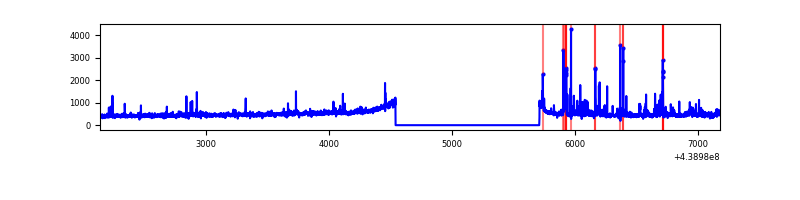 |
| D | 5046 | 3876 | 452 | 452 | 8.96% | 11.66% | 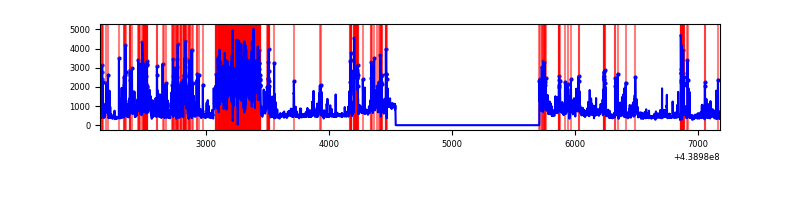 |
Top three noisy pixels from each quadrant. If the there are fewer than three noisy pixels in the level2.evt file, extra rows are filled as -1
| Pixel properties | Quadrant properties | ||||||
|---|---|---|---|---|---|---|---|
| Quadrant | DetID | PixID | Counts | Sigma | Mean | Median | Sigma |
| A | 15 | 223 | 1766653 | 19905.48 | 421 | 412 | 88.7 |
| A | 10 | 83 | 745540 | 8397.57 | 421 | 412 | 88.7 |
| A | 7 | 3 | 18248 | 201.01 | 421 | 412 | 88.7 |
| B | 5 | 172 | 113577 | 1215.23 | 466 | 452 | 93.1 |
| B | 0 | 200 | 85461 | 913.2 | 466 | 452 | 93.1 |
| B | 5 | 255 | 40269 | 427.73 | 466 | 452 | 93.1 |
| C | 14 | 254 | 126748 | 1148.15 | 460 | 462 | 110.0 |
| C | 3 | 233 | 67354 | 608.16 | 460 | 462 | 110.0 |
| C | 15 | 208 | 48706 | 438.62 | 460 | 462 | 110.0 |
| D | 1 | 52 | 1018443 | 9499.75 | 426 | 413 | 107.2 |
| D | 1 | 47 | 358600 | 3342.42 | 426 | 413 | 107.2 |
| D | 2 | 249 | 296615 | 2764.01 | 426 | 413 | 107.2 |
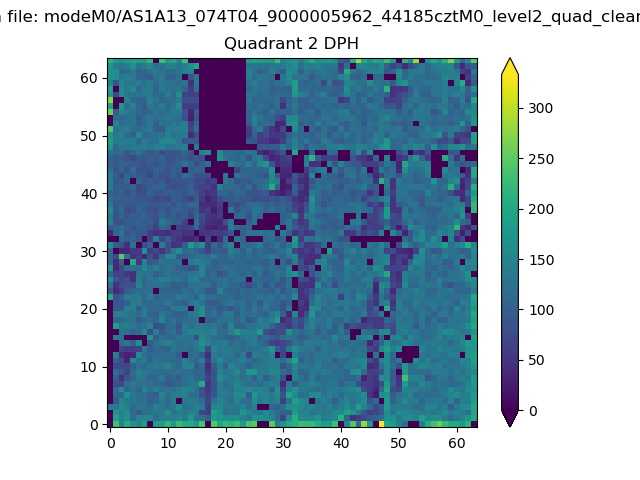
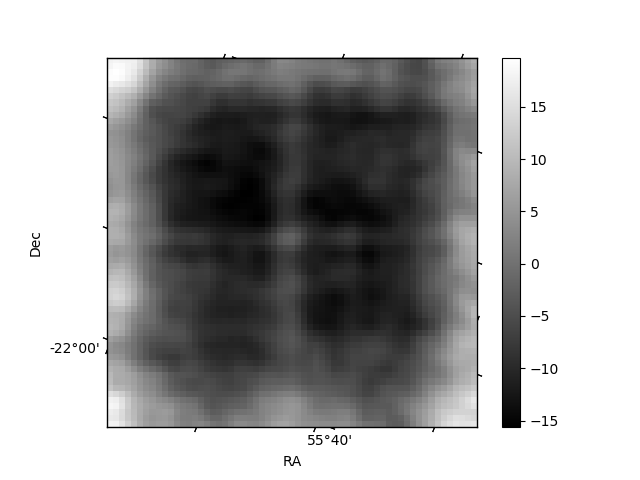
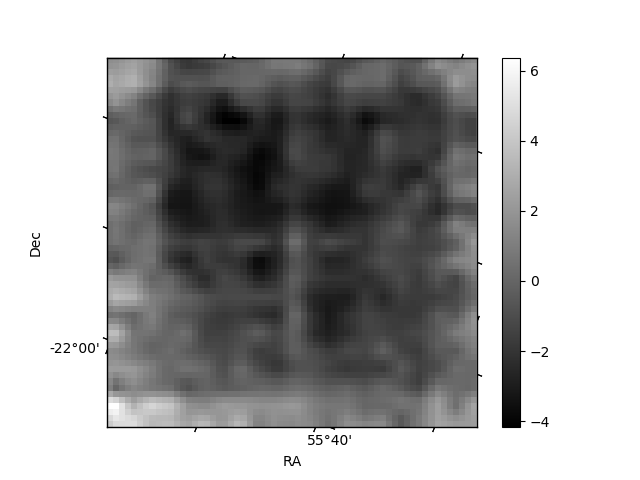
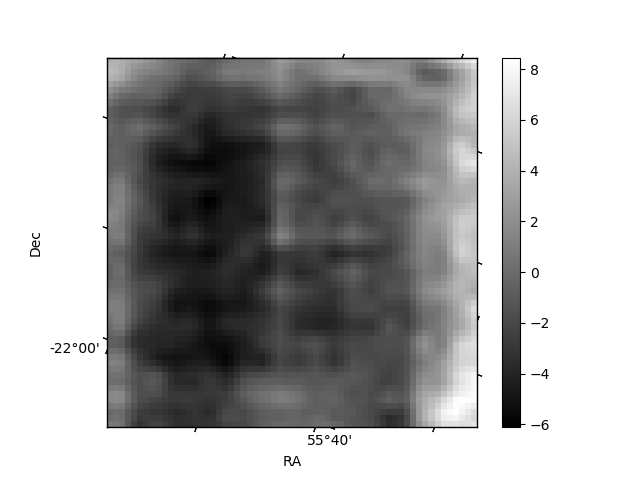
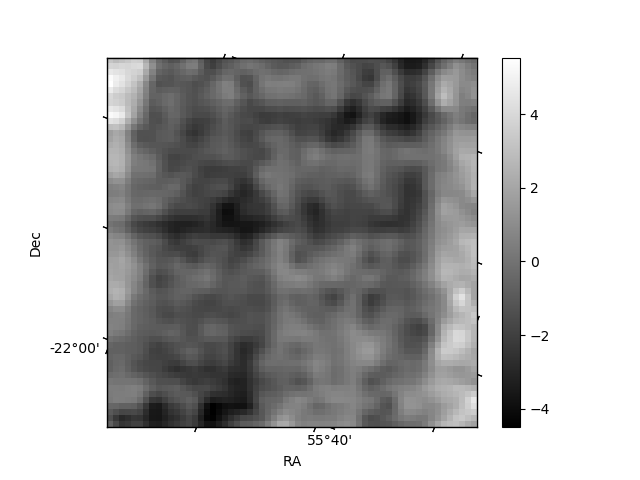
Histogram calculated using DETX and DETY for each event in the final _common_clean file
| Quadrant A | 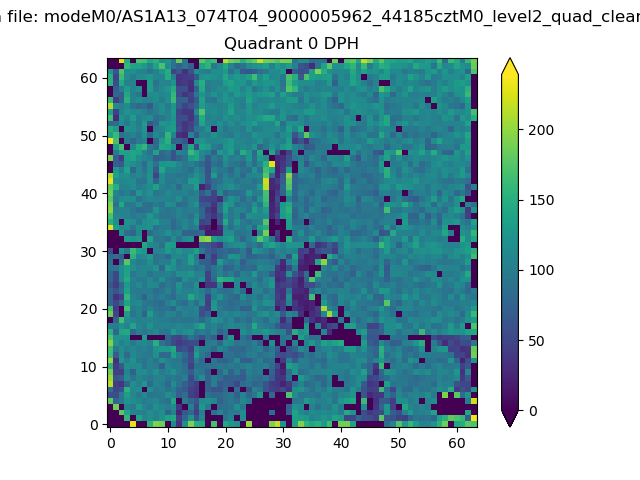 |
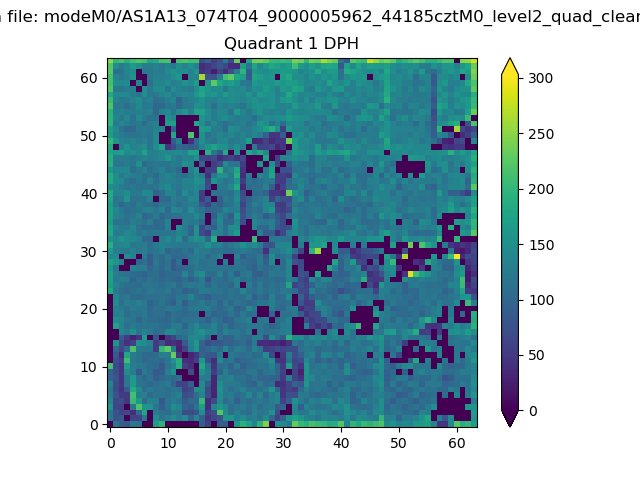 |
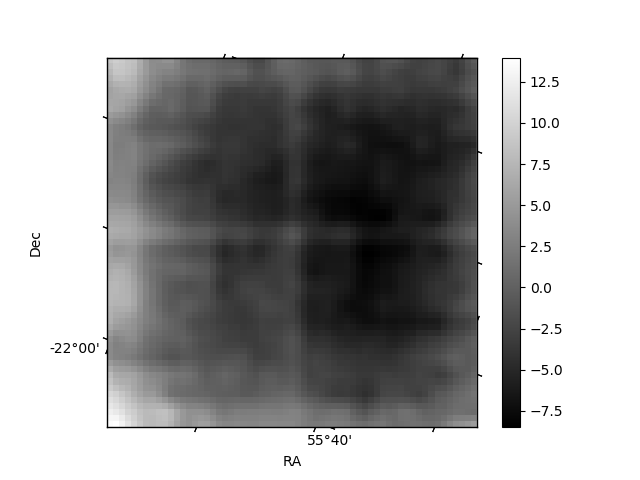
Quadrant B |
|---|---|---|---|
| Quadrant D | 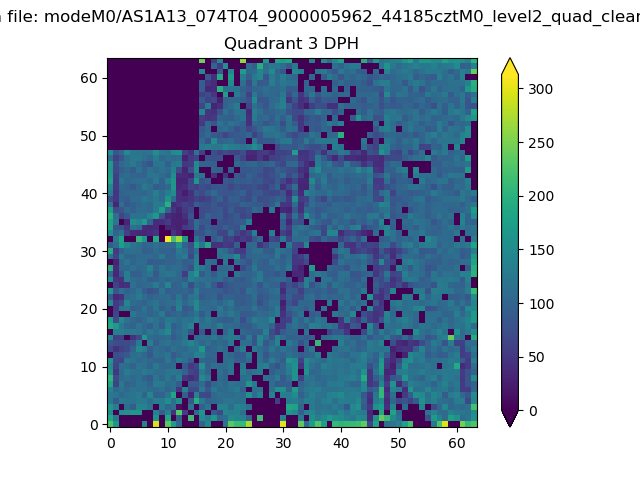 |
 |
Quadrant C |
| Plot type | Count rate plots | Images |
|---|---|---|
| Comparison with Poisson distribution Blue bars denote a histogram of data divided into 1 sec bins. Red curve is a Poisson curve with rate = median count rate of data. |
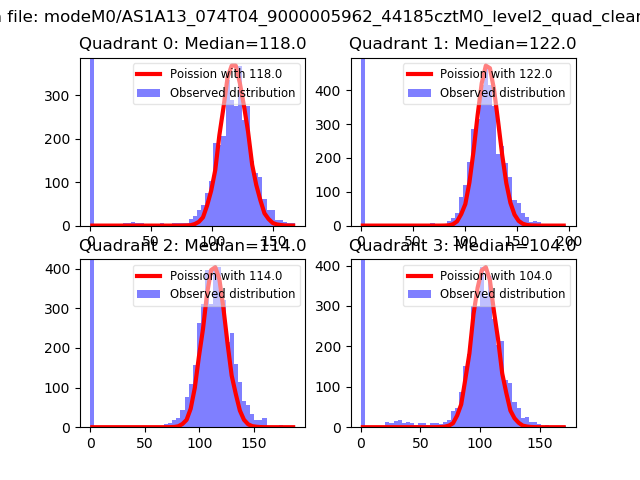 |
 |
| Quadrant-wise count rates Data is divided into 100 sec bins |
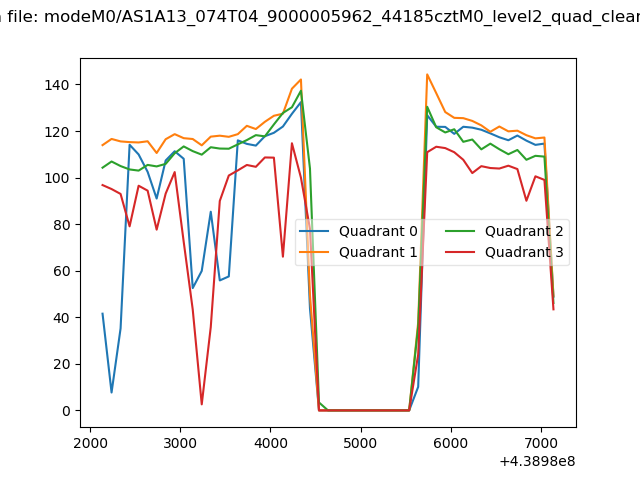 |
|
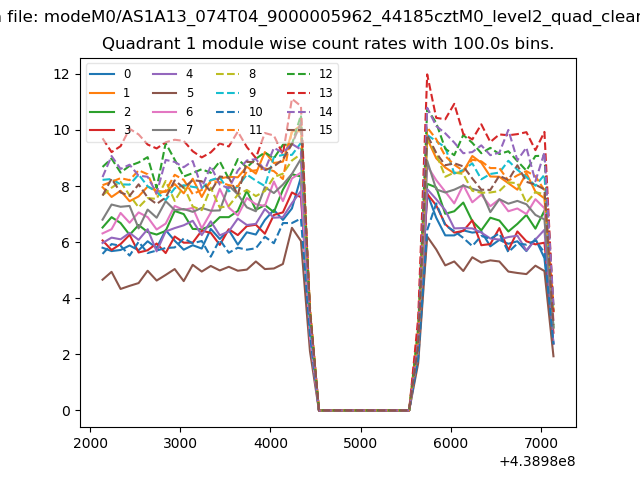
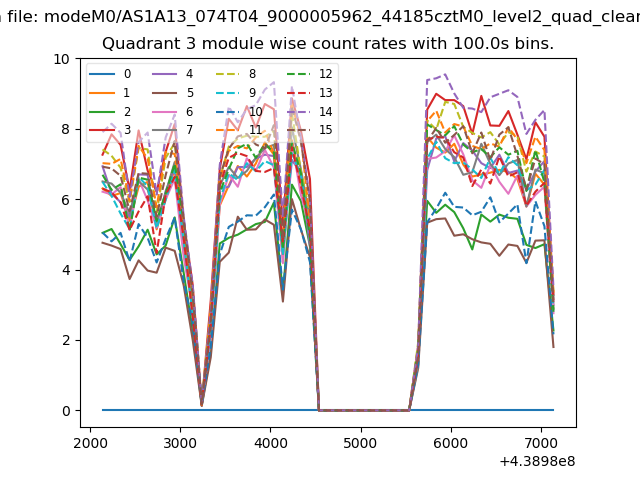
| Module-wise count rates for Quadrant A Data is divided into 100 sec bins |
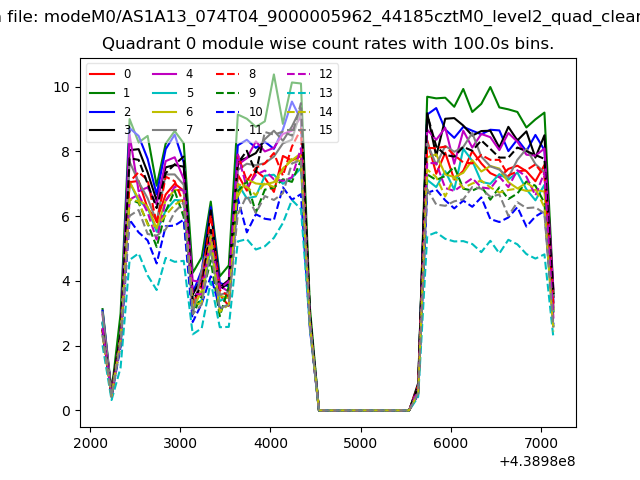 |
 |
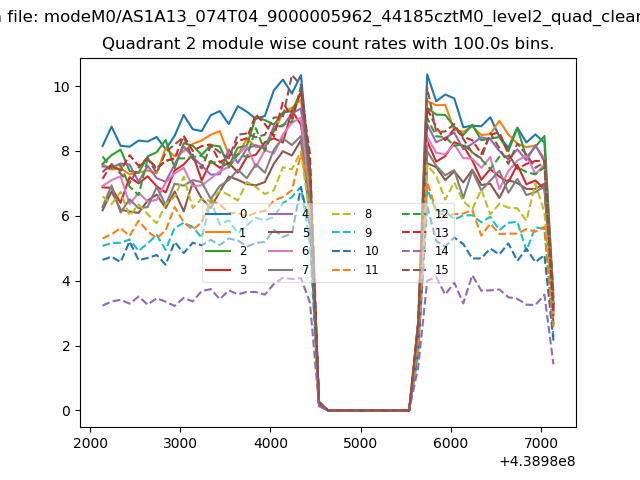
| Module-wise count rates for Quadrant B Data is divided into 100 sec bins |
 |
 |
| Module-wise count rates for Quadrant C Data is divided into 100 sec bins |
 |
 |
| Module-wise count rates for Quadrant D Data is divided into 100 sec bins |
 |
 |
| Parameter | Plot |
|---|---|
| CZT HV Monitor | 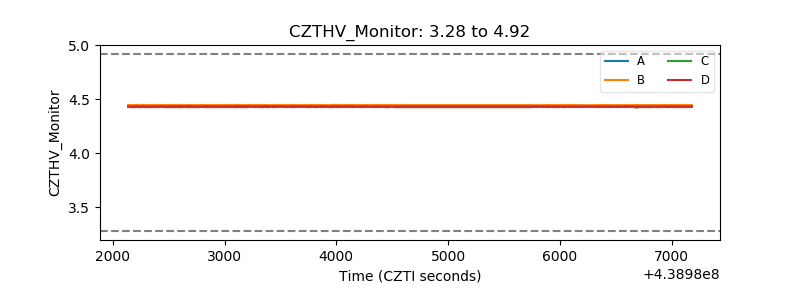 |
| D_VDD | 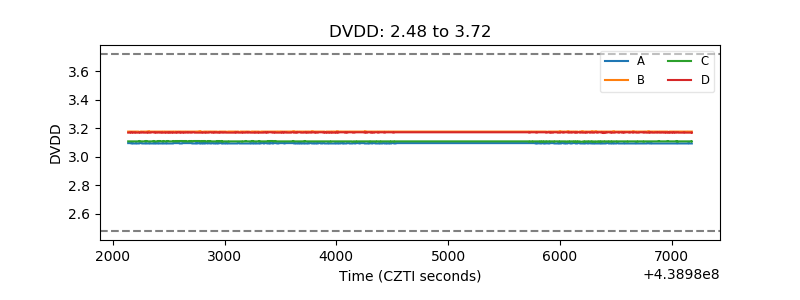 |
| Temperature 1 | 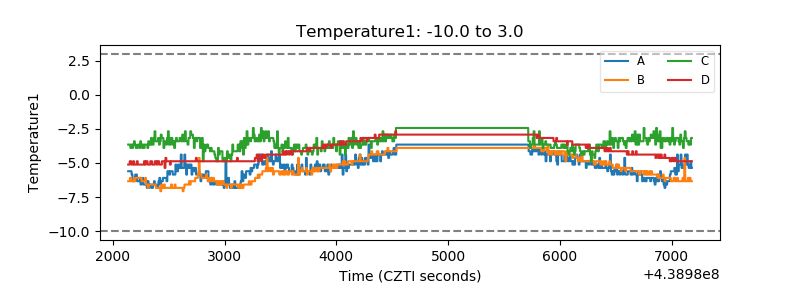 |
| Veto HV Monitor | 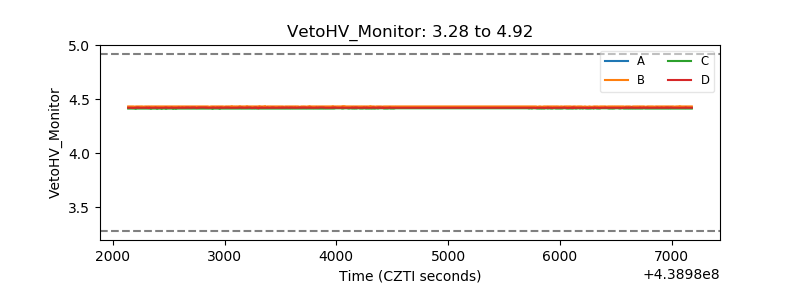 |
| Veto LLD | 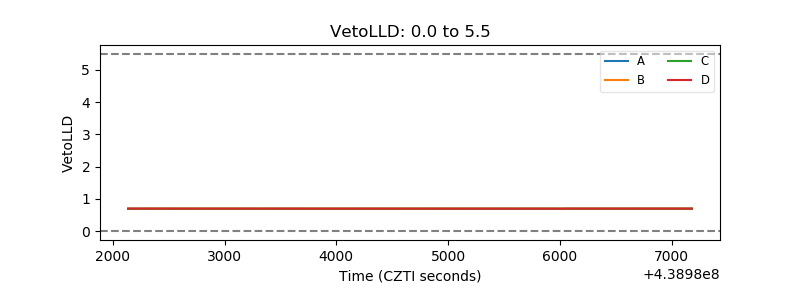 |
| Alpha Counter | 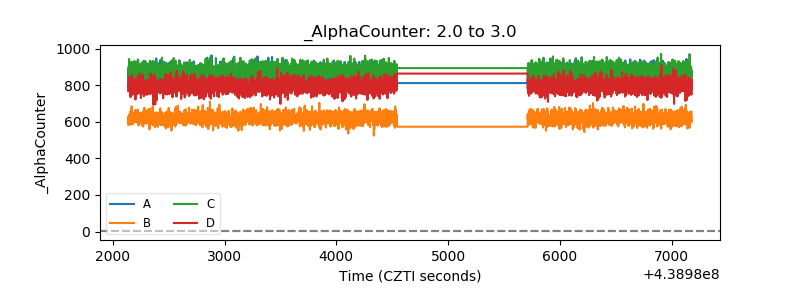 |
| _CPM_Rate | 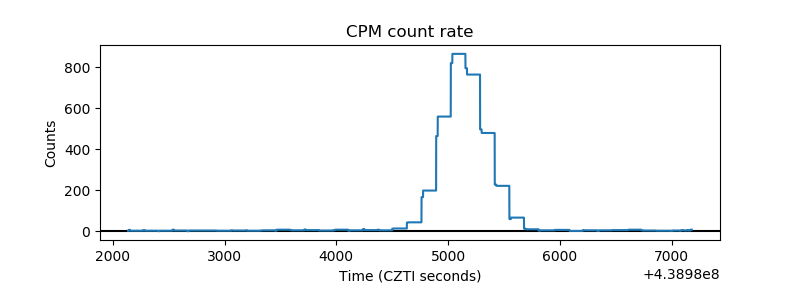 |
| CZT Counter | 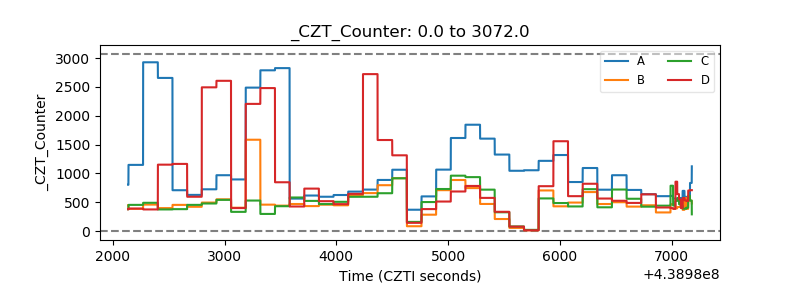 |
| +2.5 Volts monitor | 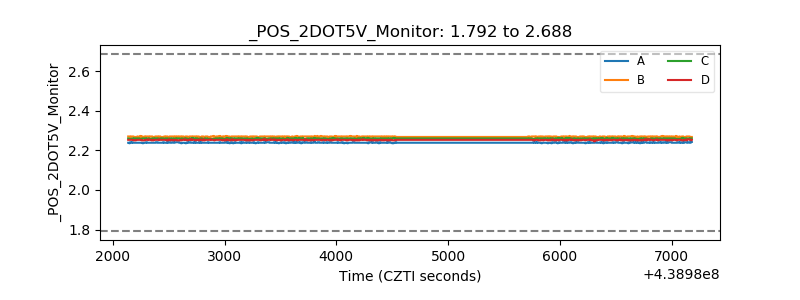 |
| +5 Volts monitor | 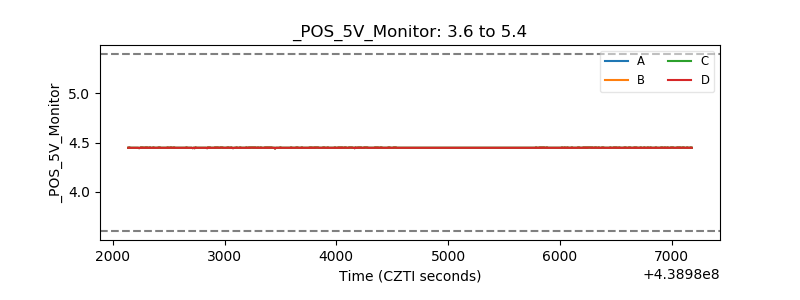 |
| _ROLL_ROT | 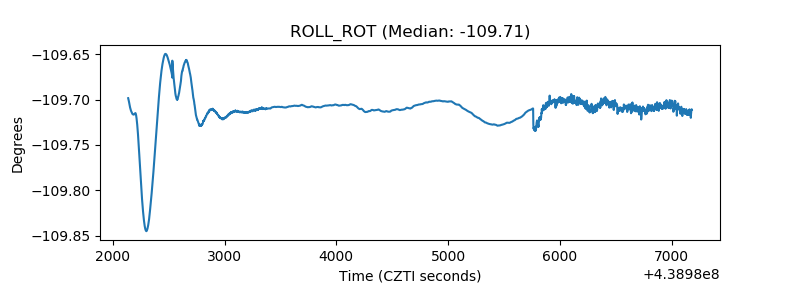 |
| _Roll_DEC | 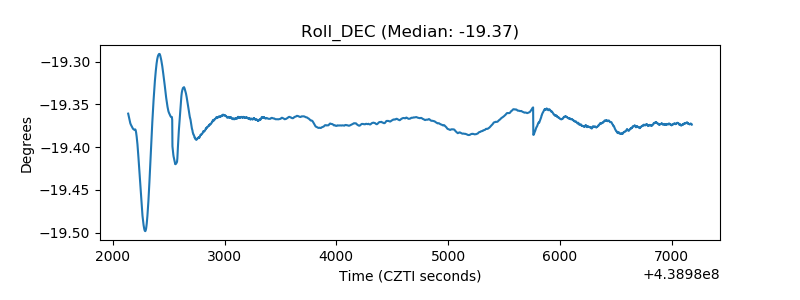 |
| _Roll_RA | 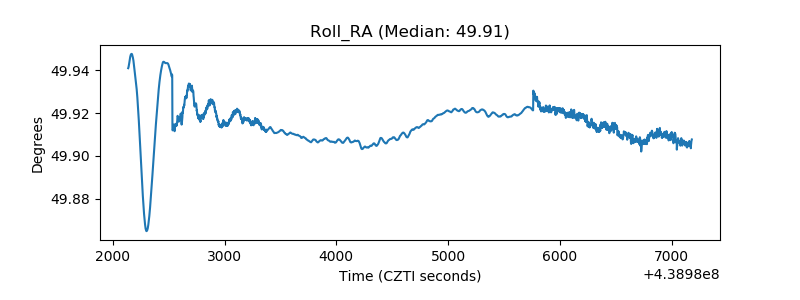 |
| Veto Counter | 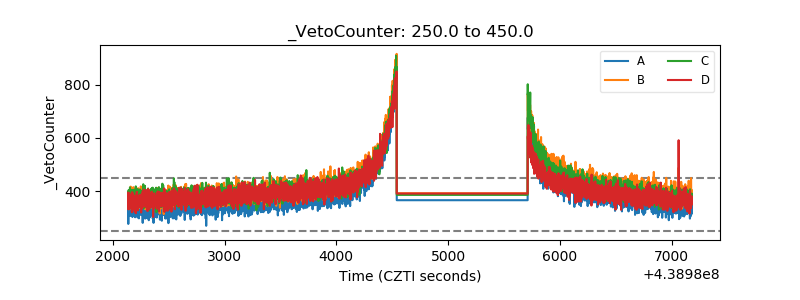 |