| Param | Original file | Final file |
|---|---|---|
| Filename | modeM0/AS1A13_074T04_9000005962_44187cztM0_level2.fits | modeM0/AS1A13_074T04_9000005962_44187cztM0_level2_quad_clean.evt |
| Size (bytes) | 470,332,800 | 116,337,600 |
| Size | 448.5 MB | 110.9 MB |
| Events in quadrant A | 5,720,803 | 772,395 |
| Events in quadrant B | 3,688,096 | 805,582 |
| Events in quadrant C | 3,376,502 | 758,137 |
| Events in quadrant D | 4,073,398 | 692,247 |
| Mode SS | |||
|---|---|---|---|
| Quadrant | BADHDUFLAG | Total packets | Discarded packets |
| A | 0 | 144 | 0 |
| B | 0 | 144 | 0 |
| C | 0 | 144 | 0 |
| D | 0 | 144 | 0 |
| Mode M0 | |||
|---|---|---|---|
| Quadrant | BADHDUFLAG | Total packets | Discarded packets |
| A | 0 | 22185 | 2 |
| B | 0 | 15914 | 2 |
| C | 0 | 15102 | 2 |
| D | 0 | 17323 | 2 |
| Mode M9 | |||
|---|---|---|---|
| Quadrant | BADHDUFLAG | Total packets | Discarded packets |
| A | 0 | 7 | 0 |
| B | 0 | 8 | 0 |
| C | 0 | 8 | 0 |
| D | 0 | 8 | 0 |
| Quadrant | Total seconds | Saturated seconds | Saturation percentage |
|---|---|---|---|
| A | 7102 | 224 | 3.154041% |
| B | 7102 | 95 | 1.337651% |
| C | 7101 | 46 | 0.647796% |
| D | 7101 | 156 | 2.196874% |
Noise dominated data is calculated using 1-second bins in cleaned event files. If a bin has >2000 counts, and if more than 50% of those come from <1% of pixels, then it is considered to be noise-dominated and hence unusable.
| Quadrant | # 1 sec bins | Bins with >0 counts | Bins with >2000 counts | High rate bins dominated by noise | Noise dominated (total time) | Noise dominated (detector-on time) | Marked lightcurve |
|---|---|---|---|---|---|---|---|
| A | 7732 | 7103 | 124 | 124 | 1.60% | 1.75% | 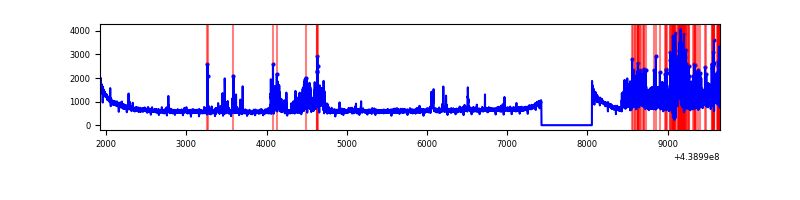 |
| B | 7732 | 7103 | 22 | 22 | 0.28% | 0.31% | 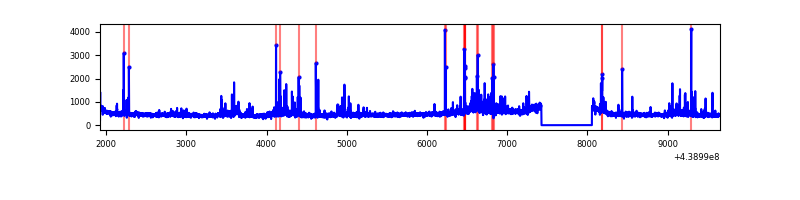 |
| C | 7731 | 7102 | 19 | 19 | 0.25% | 0.27% | 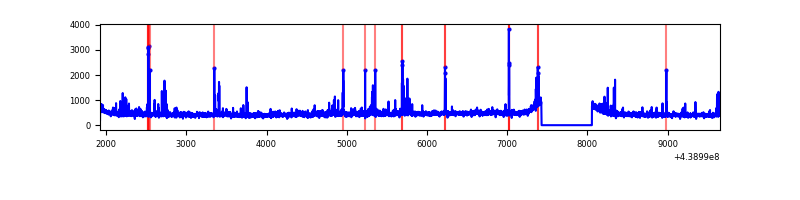 |
| D | 7731 | 7102 | 133 | 133 | 1.72% | 1.87% | 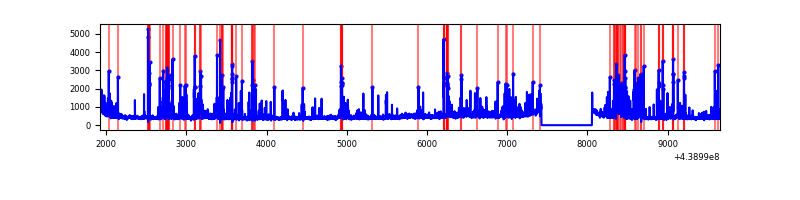 |
Top three noisy pixels from each quadrant. If the there are fewer than three noisy pixels in the level2.evt file, extra rows are filled as -1
| Pixel properties | Quadrant properties | ||||||
|---|---|---|---|---|---|---|---|
| Quadrant | DetID | PixID | Counts | Sigma | Mean | Median | Sigma |
| A | 10 | 83 | 1462921 | 8908.57 | 793 | 776 | 164.1 |
| A | 15 | 223 | 1090110 | 6637.11 | 793 | 776 | 164.1 |
| A | 7 | 3 | 63021 | 379.25 | 793 | 776 | 164.1 |
| B | 4 | 170 | 125647 | 786.34 | 797 | 771 | 158.8 |
| B | 0 | 189 | 96184 | 600.81 | 797 | 771 | 158.8 |
| B | 5 | 172 | 88214 | 550.62 | 797 | 771 | 158.8 |
| C | 14 | 254 | 191683 | 1026.91 | 781 | 785 | 185.9 |
| C | 9 | 54 | 47299 | 250.21 | 781 | 785 | 185.9 |
| C | 3 | 233 | 43378 | 229.12 | 781 | 785 | 185.9 |
| D | 2 | 249 | 600477 | 3074.01 | 774 | 751 | 195.1 |
| D | 13 | 249 | 221536 | 1131.67 | 774 | 751 | 195.1 |
| D | 1 | 52 | 76330 | 387.39 | 774 | 751 | 195.1 |
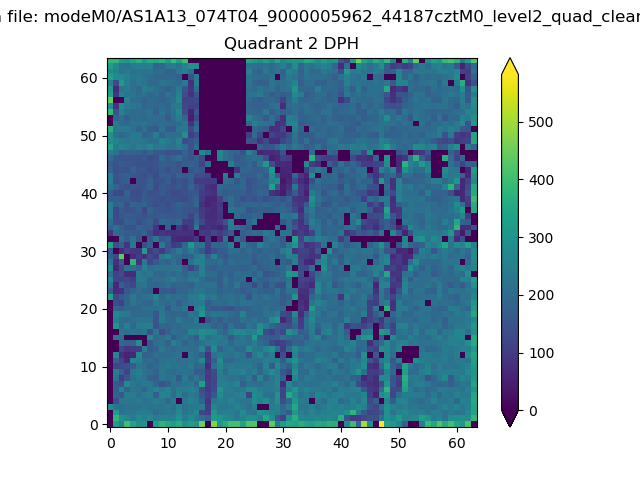
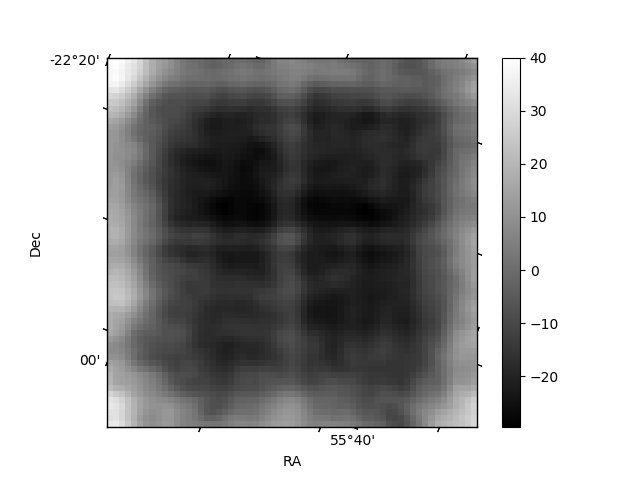
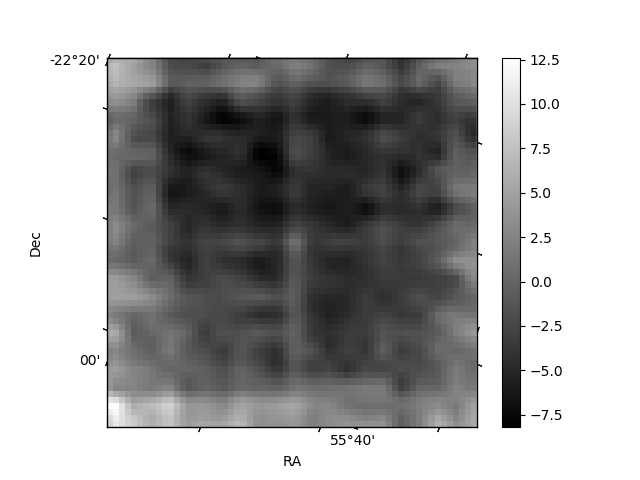
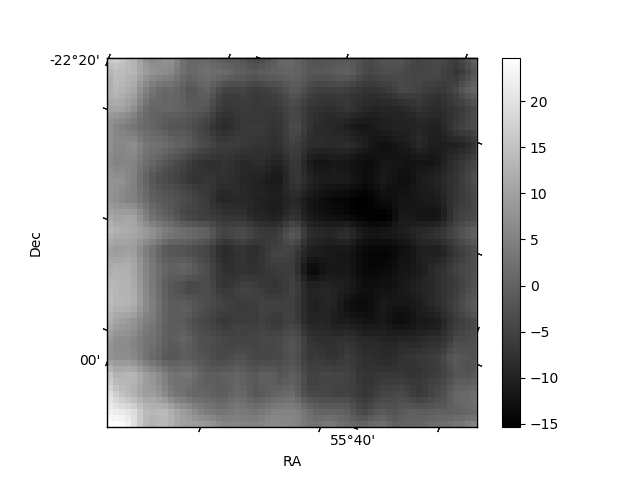
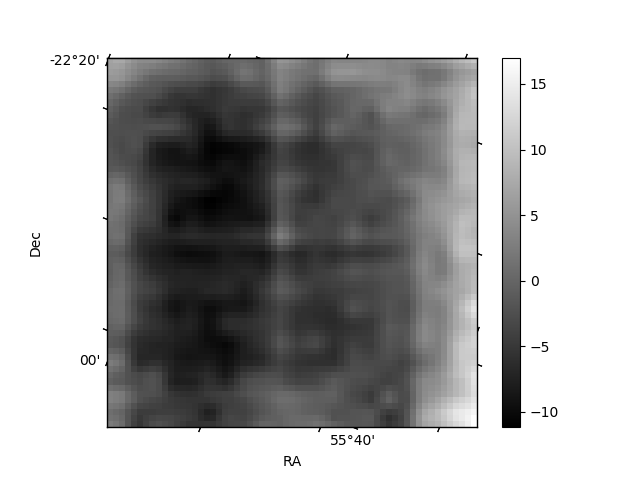
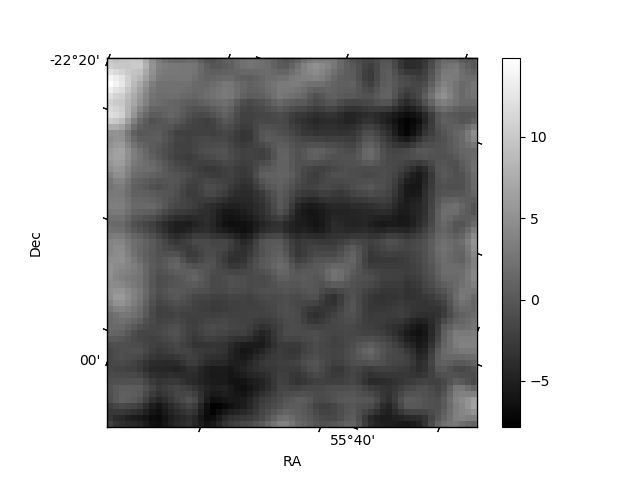
Histogram calculated using DETX and DETY for each event in the final _common_clean file
| Quadrant A | 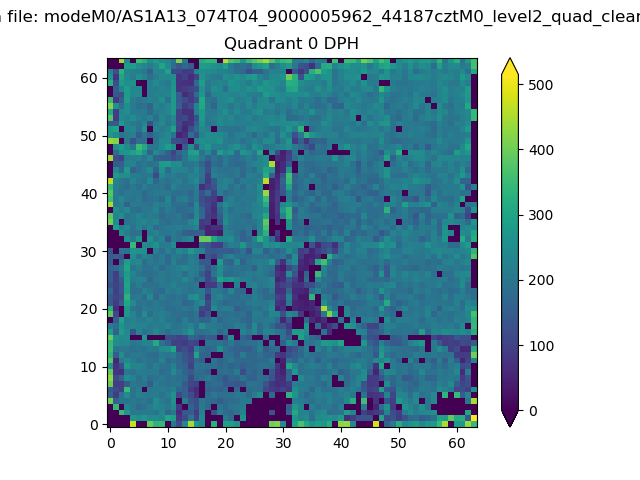 |
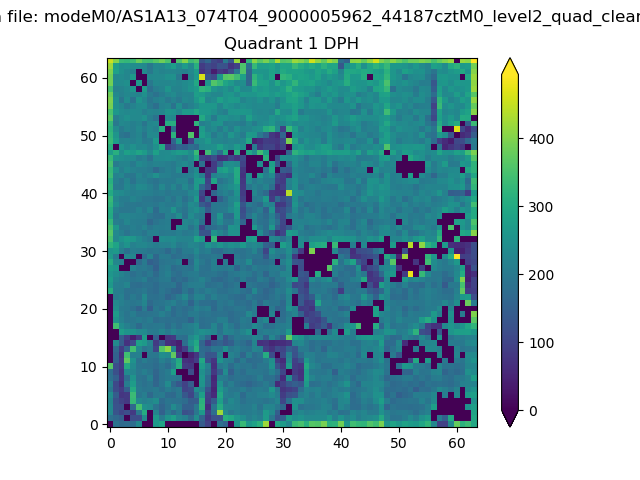 |
Quadrant B |
|---|---|---|---|
| Quadrant D | 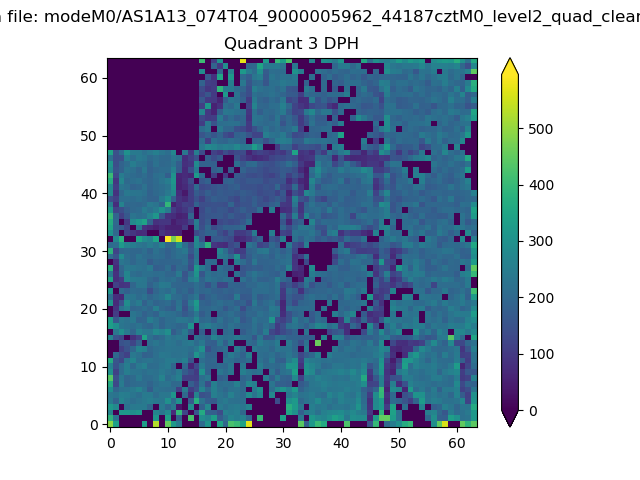 |
 |
Quadrant C |
| Plot type | Count rate plots | Images |
|---|---|---|
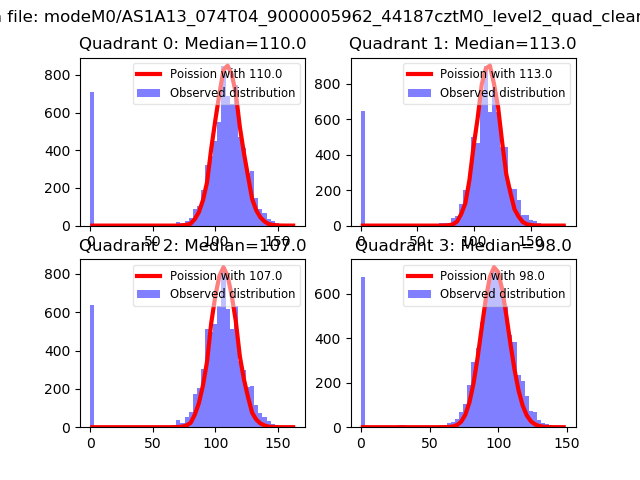
| Comparison with Poisson distribution Blue bars denote a histogram of data divided into 1 sec bins. Red curve is a Poisson curve with rate = median count rate of data. |
 |
 |
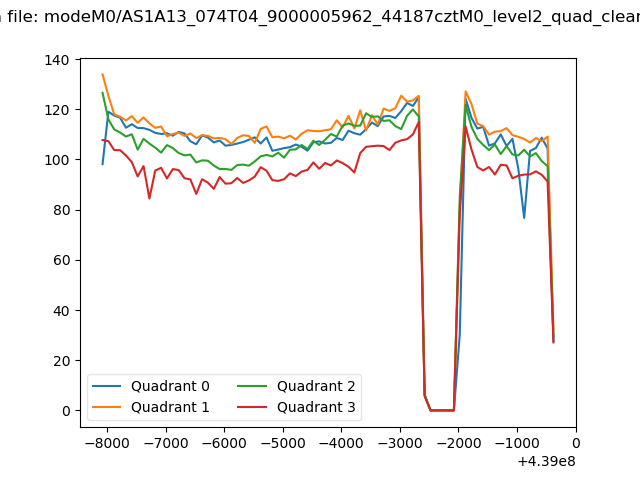
| Quadrant-wise count rates Data is divided into 100 sec bins |
 |
|
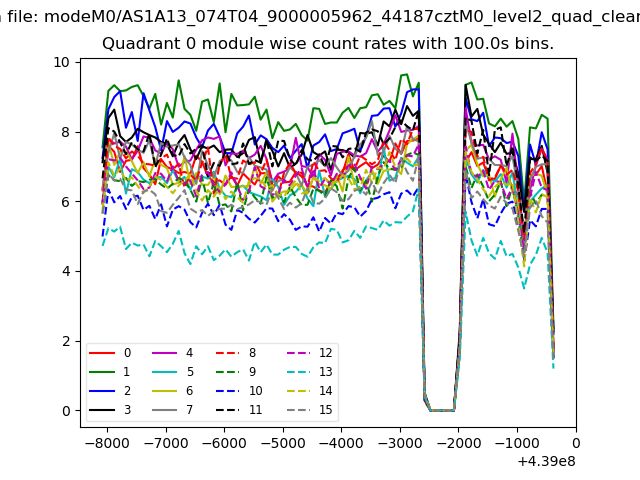
| Module-wise count rates for Quadrant A Data is divided into 100 sec bins |
 |
 |
| Module-wise count rates for Quadrant B Data is divided into 100 sec bins |
 |
 |
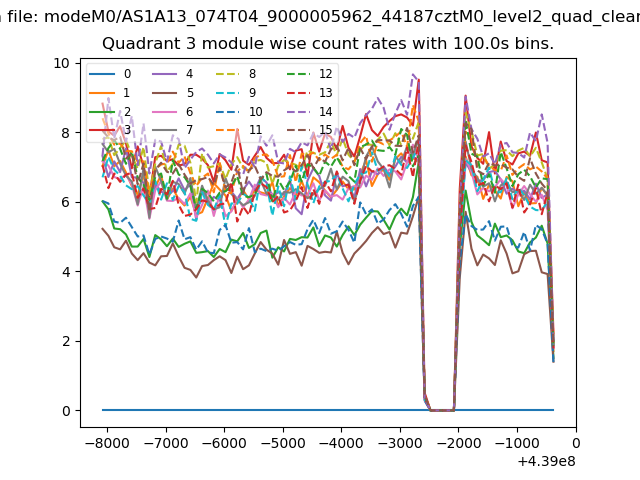
| Module-wise count rates for Quadrant C Data is divided into 100 sec bins |
 |
 |
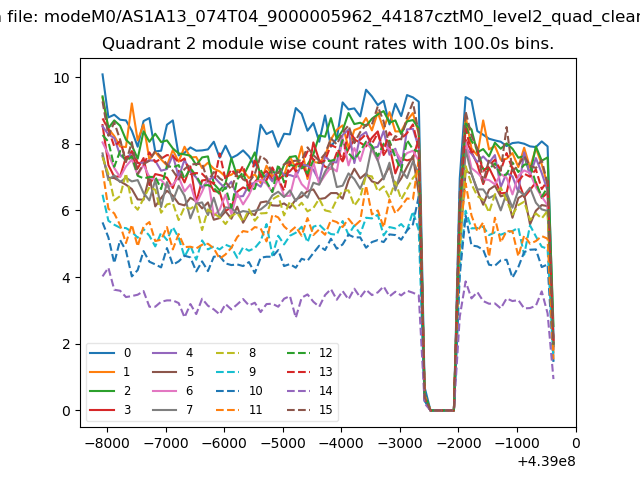
| Module-wise count rates for Quadrant D Data is divided into 100 sec bins |
 |
 |
| Parameter | Plot |
|---|---|
| CZT HV Monitor |  |
| D_VDD | 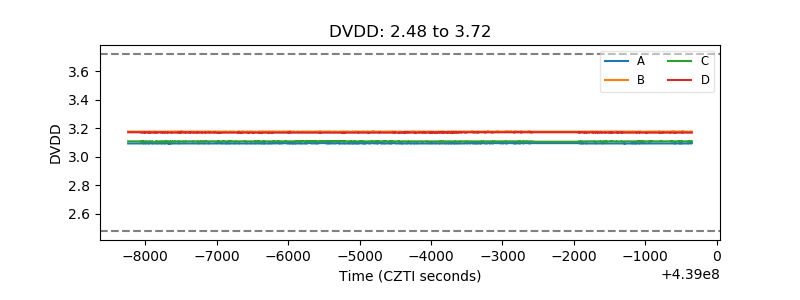 |
| Temperature 1 | 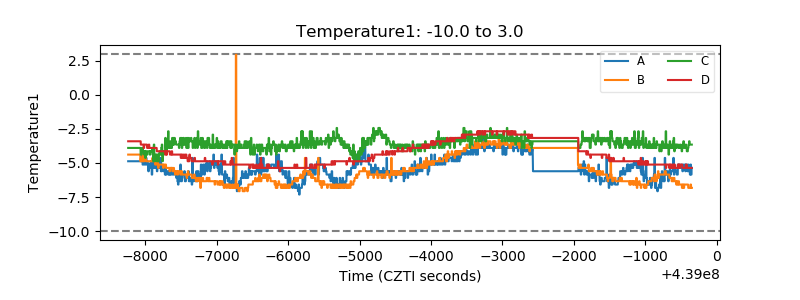 |
| Veto HV Monitor | 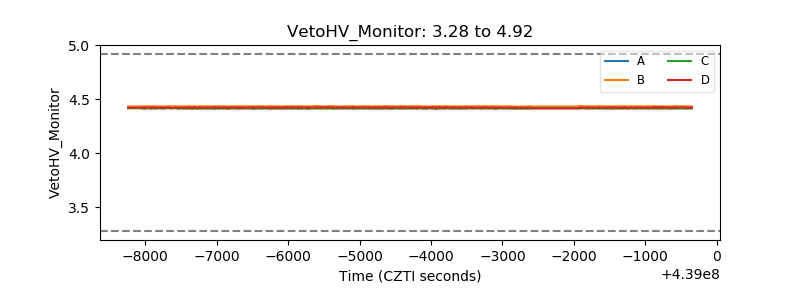 |
| Veto LLD | 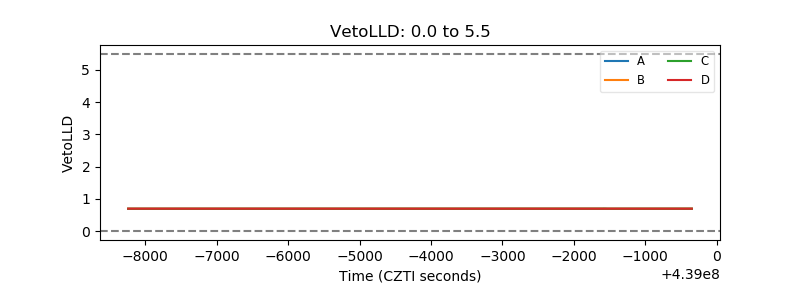 |
| Alpha Counter | 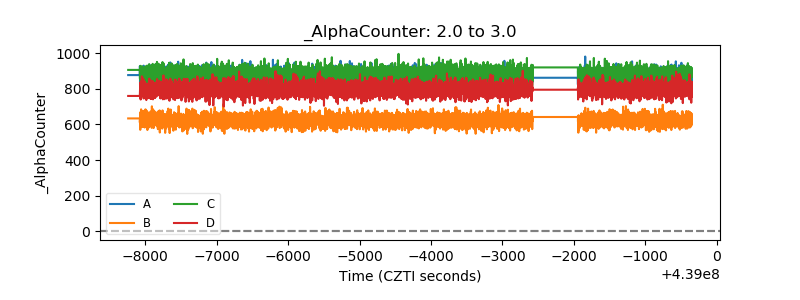 |
| _CPM_Rate | 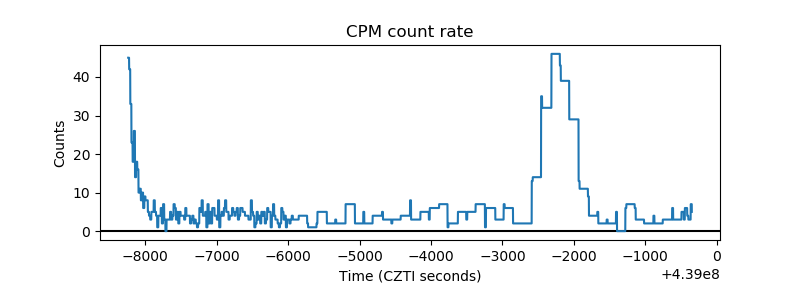 |
| CZT Counter | 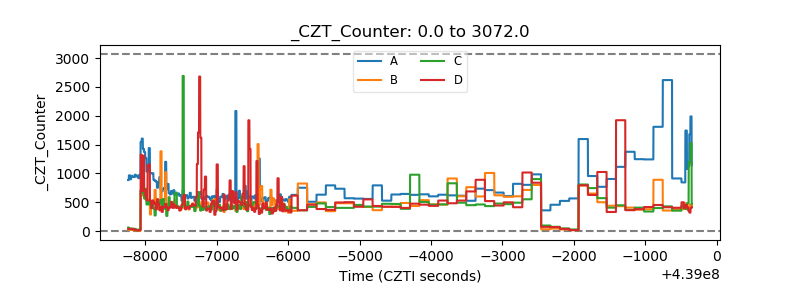 |
| +2.5 Volts monitor | 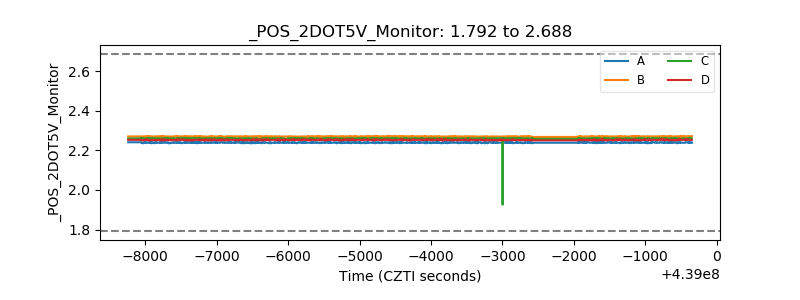 |
| +5 Volts monitor | 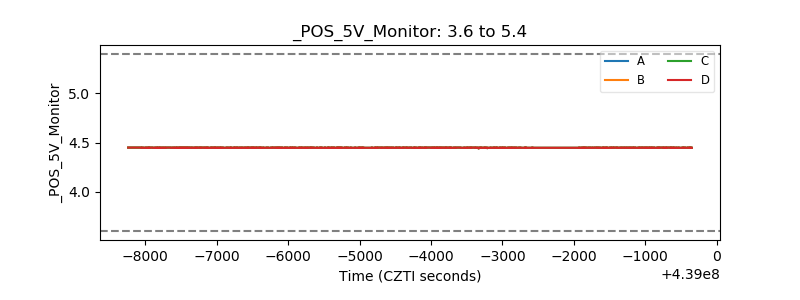 |
| _ROLL_ROT | 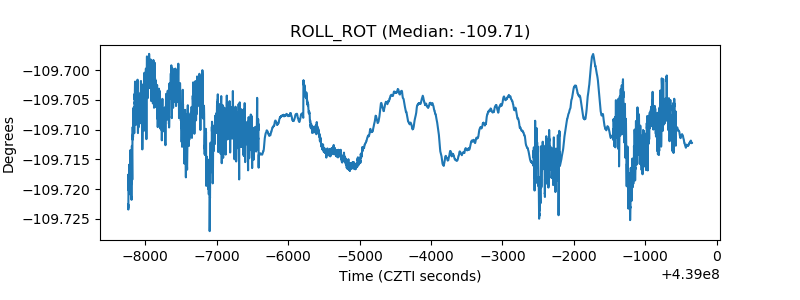 |
| _Roll_DEC | 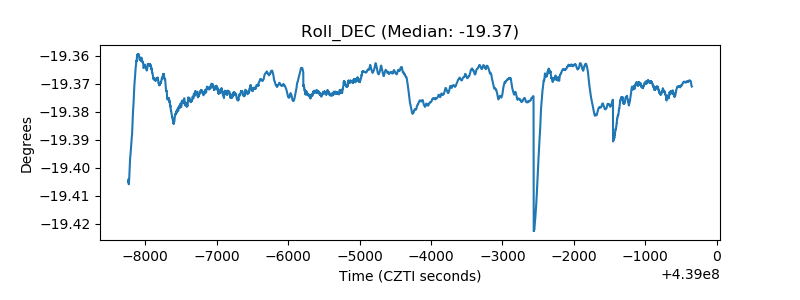 |
| _Roll_RA | 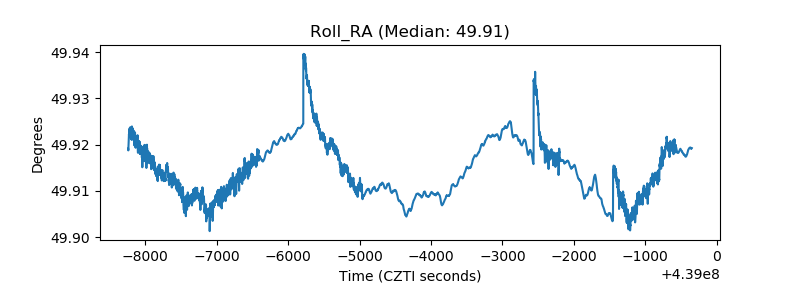 |
| Veto Counter | 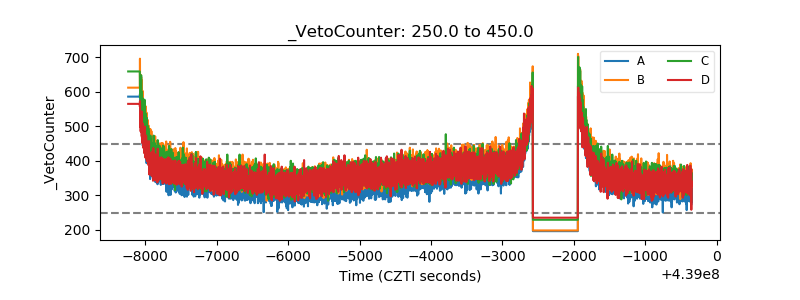 |