| Param | Original file | Final file |
|---|---|---|
| Filename | modeM0/AS1A13_074T04_9000005962_44188cztM0_level2.fits | modeM0/AS1A13_074T04_9000005962_44188cztM0_level2_quad_clean.evt |
| Size (bytes) | 628,194,240 | 115,568,640 |
| Size | 599.1 MB | 110.2 MB |
| Events in quadrant A | 9,550,381 | 674,181 |
| Events in quadrant B | 4,252,220 | 827,676 |
| Events in quadrant C | 3,770,400 | 781,115 |
| Events in quadrant D | 5,105,798 | 699,993 |
| Mode SS | |||
|---|---|---|---|
| Quadrant | BADHDUFLAG | Total packets | Discarded packets |
| A | 0 | 150 | 0 |
| B | 0 | 150 | 0 |
| C | 0 | 150 | 0 |
| D | 0 | 150 | 0 |
| Mode M0 | |||
|---|---|---|---|
| Quadrant | BADHDUFLAG | Total packets | Discarded packets |
| A | 0 | 33716 | 2 |
| B | 0 | 17766 | 2 |
| C | 0 | 16516 | 2 |
| D | 0 | 20657 | 2 |
| Mode M9 | |||
|---|---|---|---|
| Quadrant | BADHDUFLAG | Total packets | Discarded packets |
| A | 0 | 6 | 0 |
| B | 0 | 6 | 0 |
| C | 0 | 6 | 0 |
| D | 0 | 6 | 0 |
| Quadrant | Total seconds | Saturated seconds | Saturation percentage |
|---|---|---|---|
| A | 7417 | 1603 | 21.612512% |
| B | 7417 | 199 | 2.683025% |
| C | 7418 | 96 | 1.294149% |
| D | 7418 | 363 | 4.893502% |
Noise dominated data is calculated using 1-second bins in cleaned event files. If a bin has >2000 counts, and if more than 50% of those come from <1% of pixels, then it is considered to be noise-dominated and hence unusable.
| Quadrant | # 1 sec bins | Bins with >0 counts | Bins with >2000 counts | High rate bins dominated by noise | Noise dominated (total time) | Noise dominated (detector-on time) | Marked lightcurve |
|---|---|---|---|---|---|---|---|
| A | 8062 | 7419 | 1085 | 1085 | 13.46% | 14.62% | 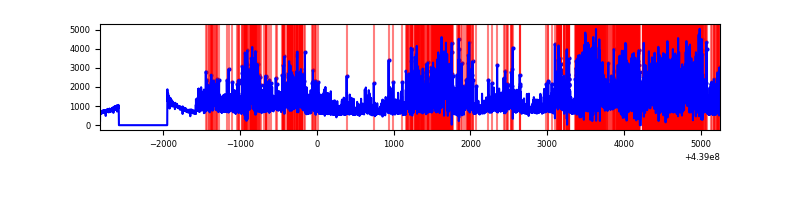 |
| B | 8062 | 7419 | 57 | 57 | 0.71% | 0.77% | 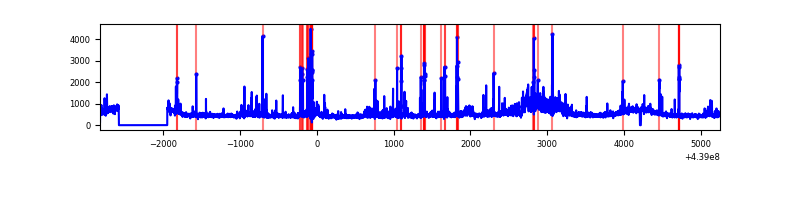 |
| C | 8063 | 7420 | 51 | 51 | 0.63% | 0.69% | 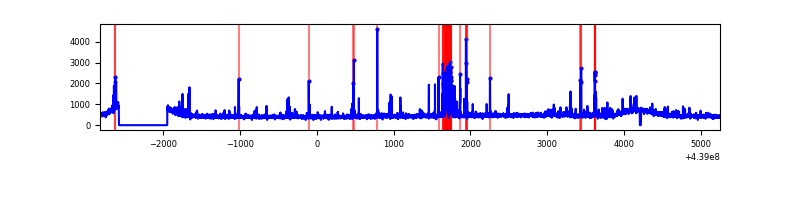 |
| D | 8063 | 7420 | 286 | 286 | 3.55% | 3.85% | 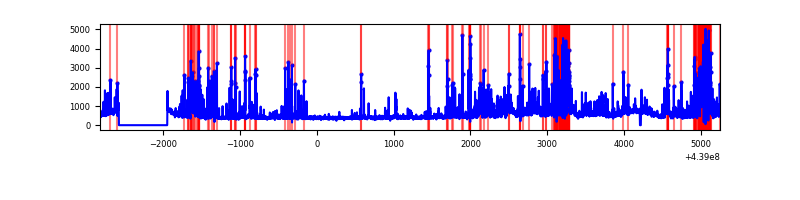 |
Top three noisy pixels from each quadrant. If the there are fewer than three noisy pixels in the level2.evt file, extra rows are filled as -1
| Pixel properties | Quadrant properties | ||||||
|---|---|---|---|---|---|---|---|
| Quadrant | DetID | PixID | Counts | Sigma | Mean | Median | Sigma |
| A | 15 | 223 | 5220001 | 31996.99 | 785 | 768 | 163.1 |
| A | 10 | 83 | 1290614 | 7907.52 | 785 | 768 | 163.1 |
| A | 3 | 137 | 9092 | 51.03 | 785 | 768 | 163.1 |
| B | 4 | 170 | 188611 | 1104.78 | 851 | 822 | 170.0 |
| B | 0 | 219 | 174252 | 1020.3 | 851 | 822 | 170.0 |
| B | 0 | 230 | 169480 | 992.23 | 851 | 822 | 170.0 |
| C | 14 | 254 | 362456 | 1818.51 | 838 | 846 | 198.8 |
| C | 9 | 54 | 64832 | 321.78 | 838 | 846 | 198.8 |
| C | 3 | 233 | 44116 | 217.6 | 838 | 846 | 198.8 |
| D | 1 | 52 | 1061798 | 5148.17 | 820 | 793 | 206.1 |
| D | 2 | 249 | 492785 | 2387.23 | 820 | 793 | 206.1 |
| D | 13 | 249 | 189992 | 918.03 | 820 | 793 | 206.1 |
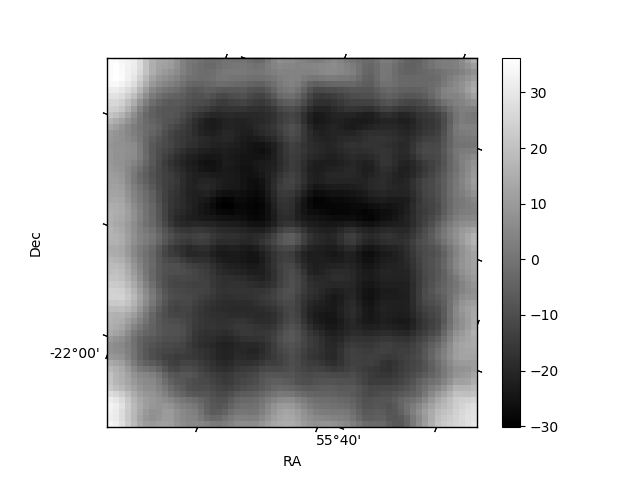
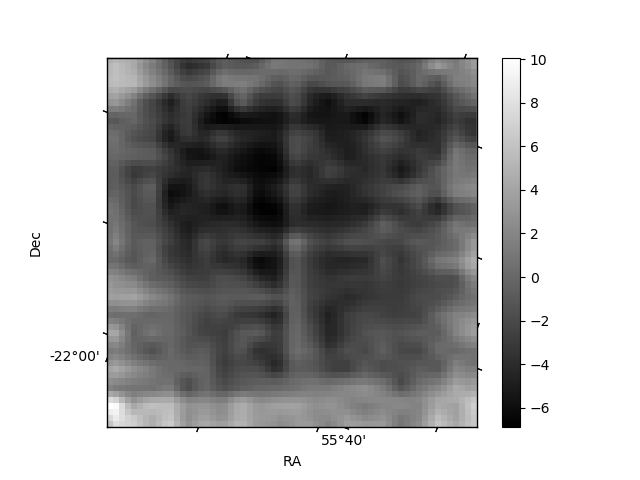
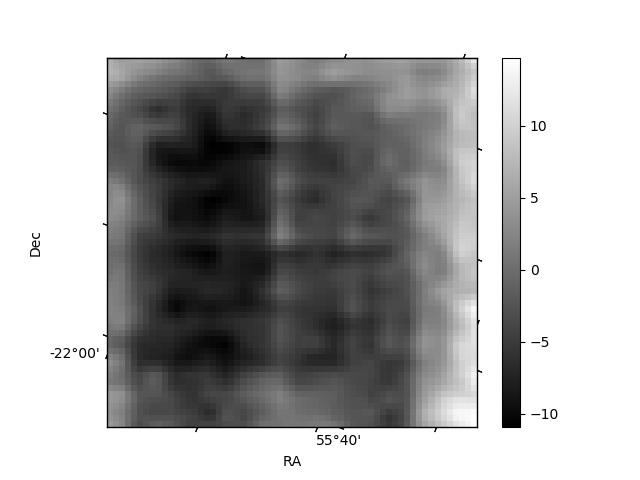
Histogram calculated using DETX and DETY for each event in the final _common_clean file
| Quadrant A | 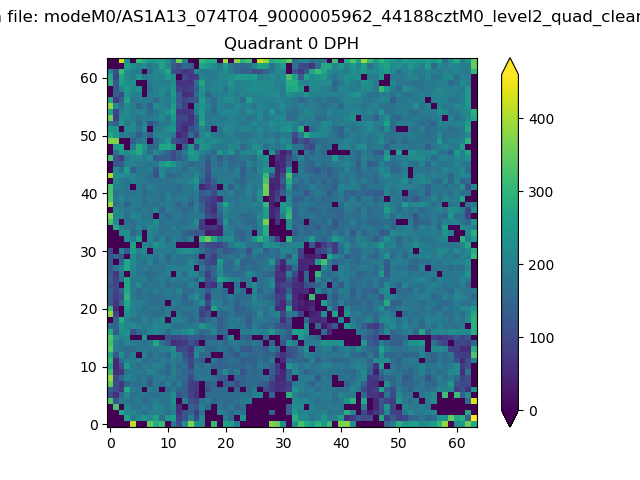 |
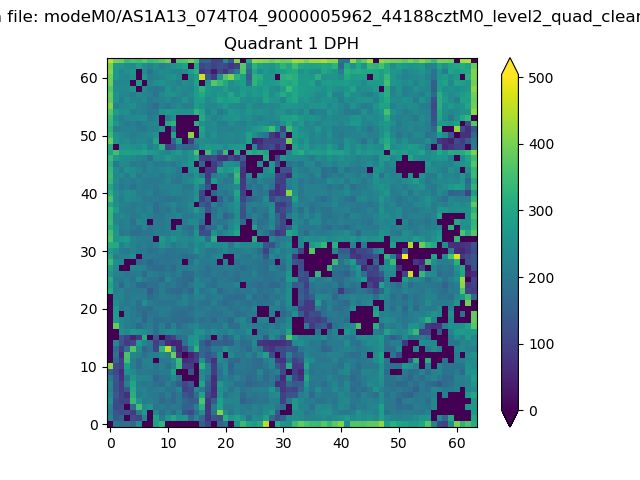 |
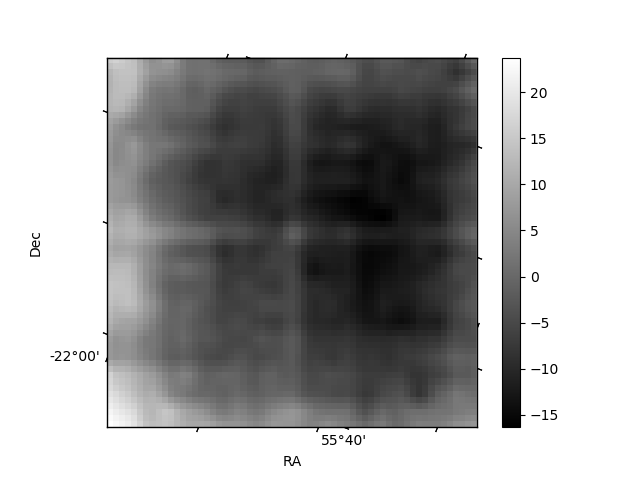
Quadrant B |
|---|---|---|---|
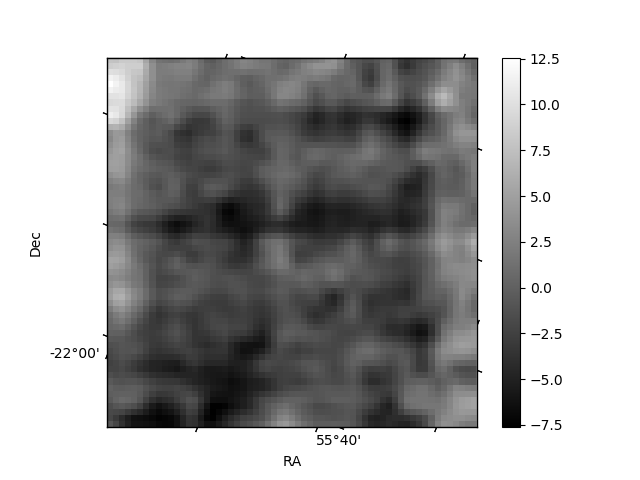
| Quadrant D | 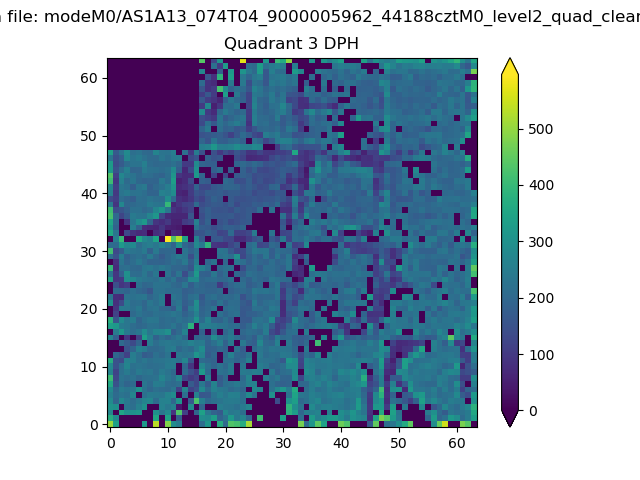 |
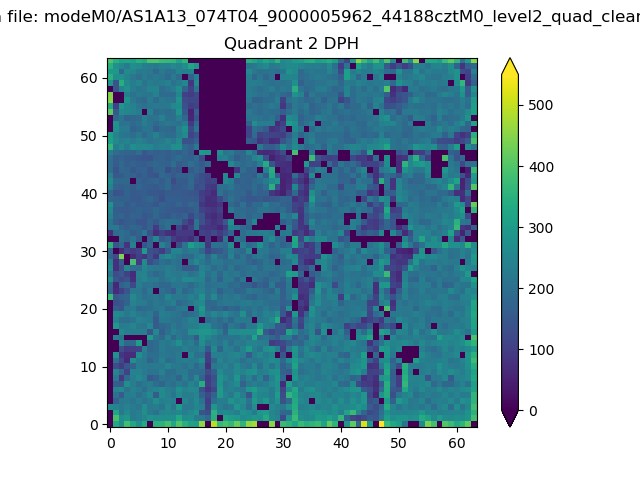 |
Quadrant C |
| Plot type | Count rate plots | Images |
|---|---|---|
| Comparison with Poisson distribution Blue bars denote a histogram of data divided into 1 sec bins. Red curve is a Poisson curve with rate = median count rate of data. |
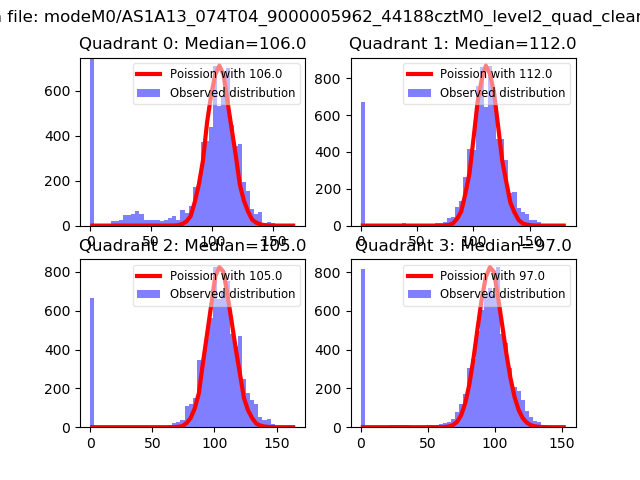 |
 |
| Quadrant-wise count rates Data is divided into 100 sec bins |
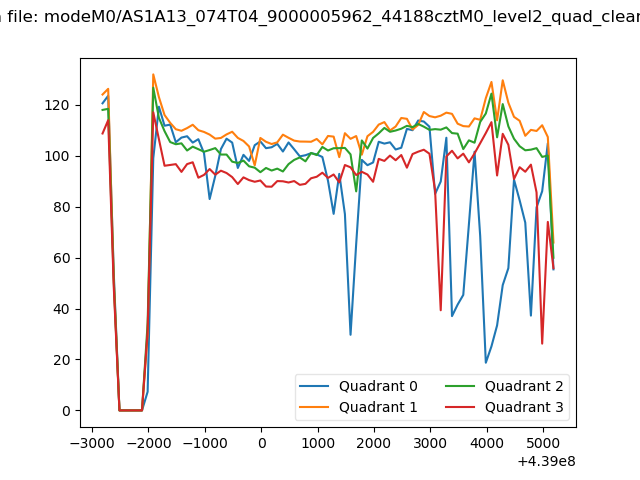 |
|
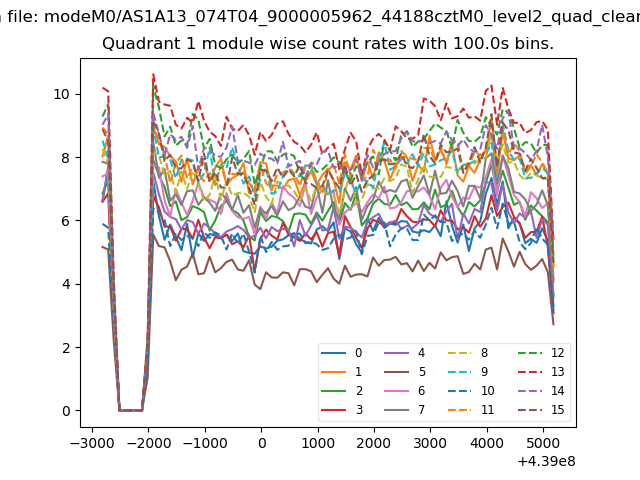
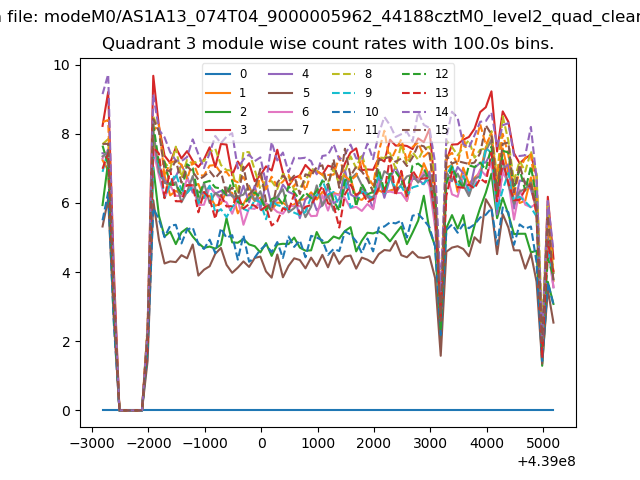
| Module-wise count rates for Quadrant A Data is divided into 100 sec bins |
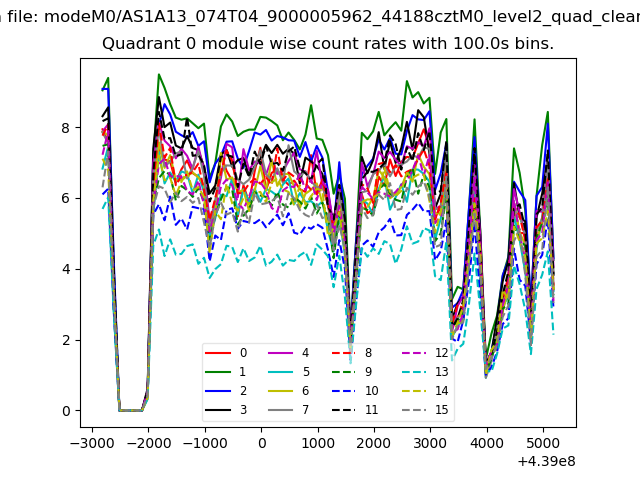 |
 |
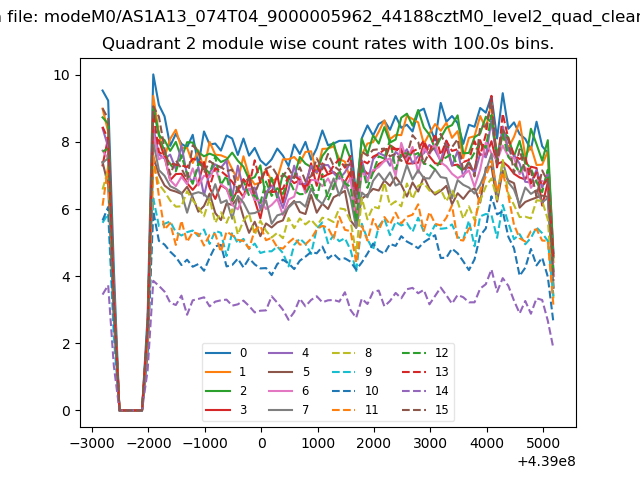
| Module-wise count rates for Quadrant B Data is divided into 100 sec bins |
 |
 |
| Module-wise count rates for Quadrant C Data is divided into 100 sec bins |
 |
 |
| Module-wise count rates for Quadrant D Data is divided into 100 sec bins |
 |
 |
| Parameter | Plot |
|---|---|
| CZT HV Monitor | 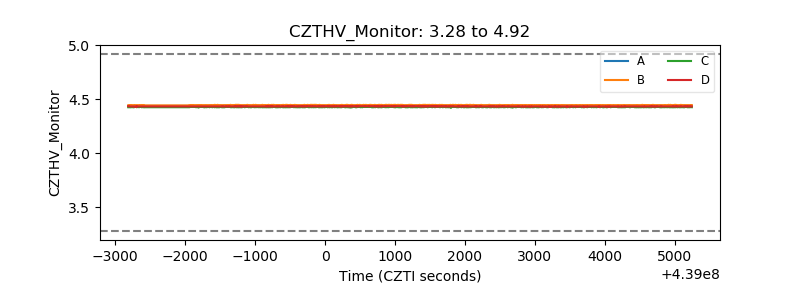 |
| D_VDD | 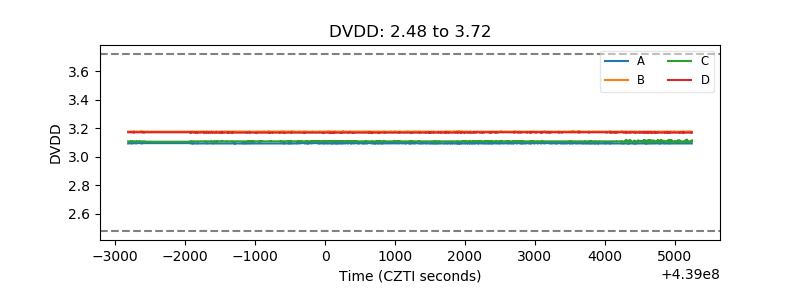 |
| Temperature 1 |  |
| Veto HV Monitor | 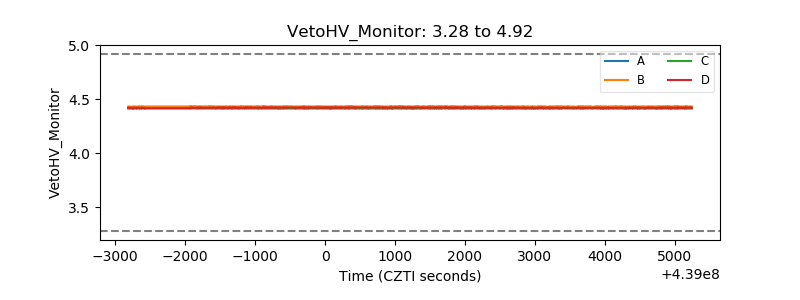 |
| Veto LLD | 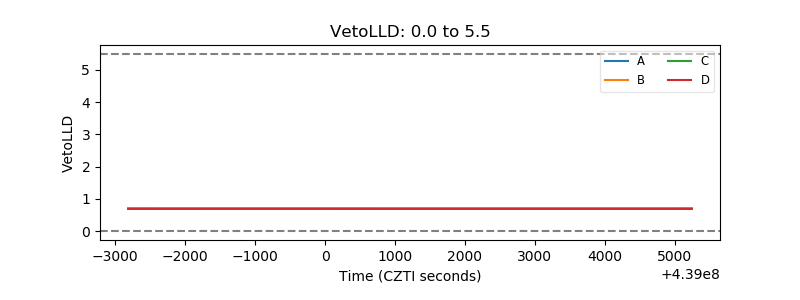 |
| Alpha Counter | 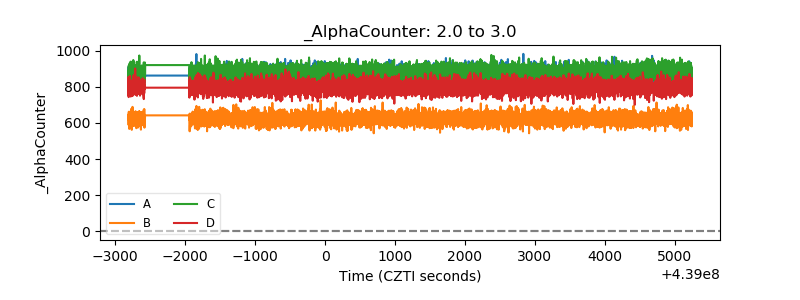 |
| _CPM_Rate | 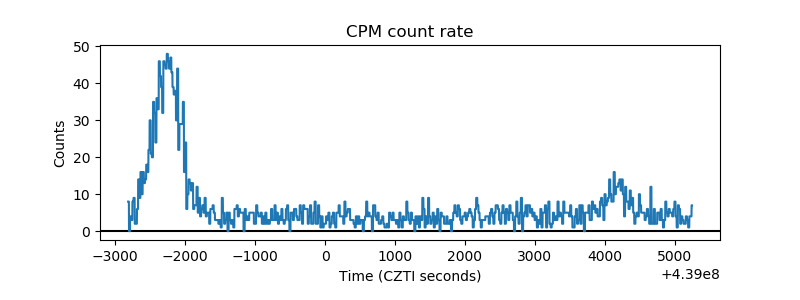 |
| CZT Counter | 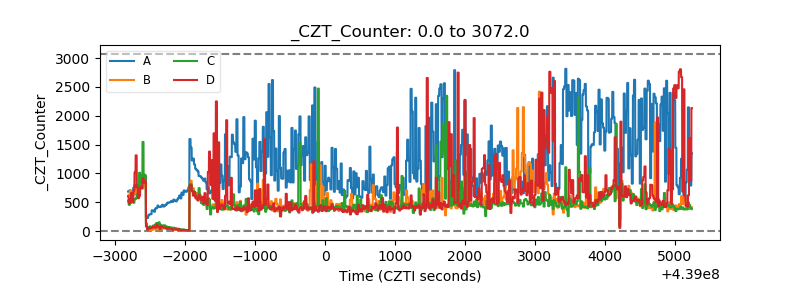 |
| +2.5 Volts monitor | 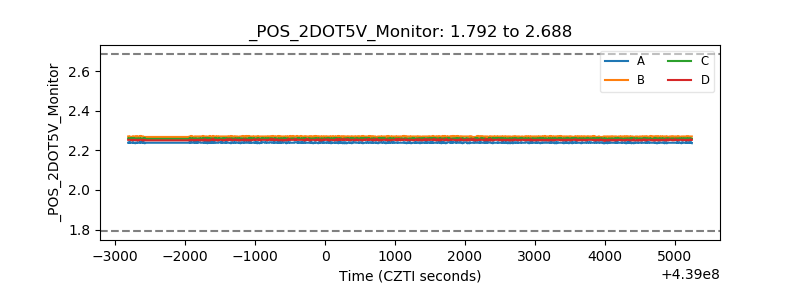 |
| +5 Volts monitor | 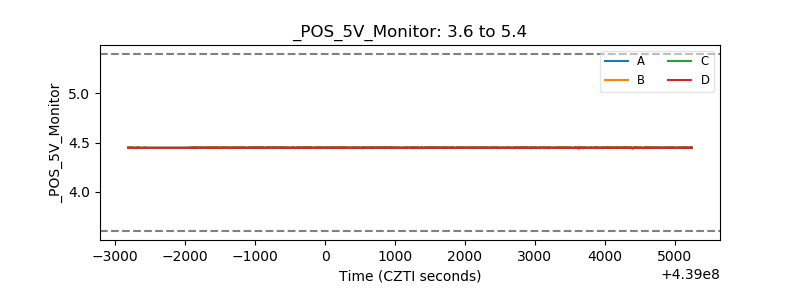 |
| _ROLL_ROT | 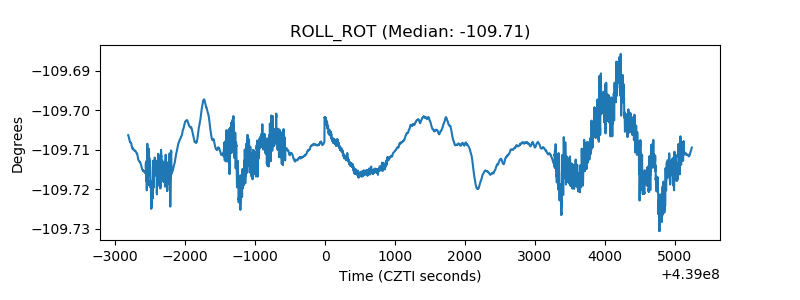 |
| _Roll_DEC | 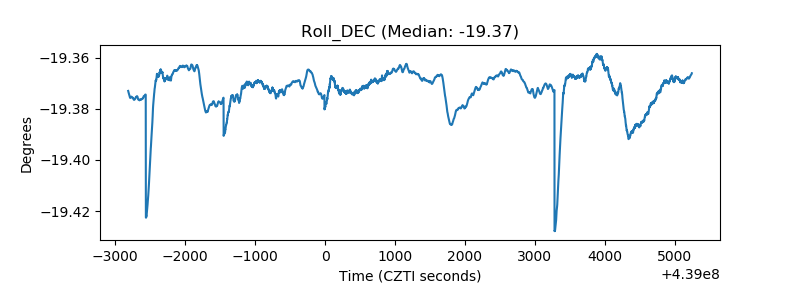 |
| _Roll_RA | 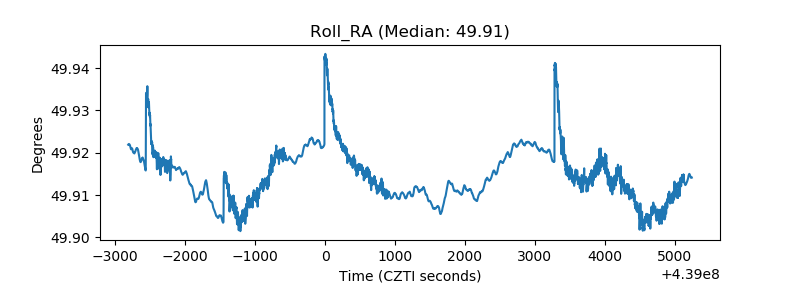 |
| Veto Counter | 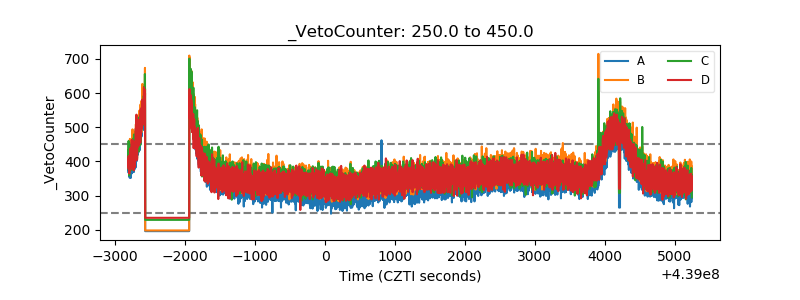 |