| Param | Original file | Final file |
|---|---|---|
| Filename | modeM0/AS1A13_074T05_9000005958_44181cztM0_level2.fits | modeM0/AS1A13_074T05_9000005958_44181cztM0_level2_quad_clean.evt |
| Size (bytes) | 577,215,360 | 107,651,520 |
| Size | 550.5 MB | 102.7 MB |
| Events in quadrant A | 7,834,554 | 679,169 |
| Events in quadrant B | 4,531,620 | 749,367 |
| Events in quadrant C | 3,270,405 | 732,549 |
| Events in quadrant D | 5,209,763 | 630,420 |
| Mode SS | |||
|---|---|---|---|
| Quadrant | BADHDUFLAG | Total packets | Discarded packets |
| A | 0 | 136 | 0 |
| B | 0 | 136 | 0 |
| C | 0 | 136 | 0 |
| D | 0 | 136 | 0 |
| Mode M0 | |||
|---|---|---|---|
| Quadrant | BADHDUFLAG | Total packets | Discarded packets |
| A | 0 | 28125 | 2 |
| B | 0 | 18125 | 2 |
| C | 0 | 14186 | 2 |
| D | 0 | 20031 | 2 |
| Mode M9 | |||
|---|---|---|---|
| Quadrant | BADHDUFLAG | Total packets | Discarded packets |
| A | 0 | 11 | 0 |
| B | 0 | 12 | 0 |
| C | 0 | 12 | 0 |
| D | 0 | 12 | 0 |
| Quadrant | Total seconds | Saturated seconds | Saturation percentage |
|---|---|---|---|
| A | 6716 | 811 | 12.075640% |
| B | 6715 | 307 | 4.571854% |
| C | 6715 | 85 | 1.265823% |
| D | 6715 | 576 | 8.577811% |
Noise dominated data is calculated using 1-second bins in cleaned event files. If a bin has >2000 counts, and if more than 50% of those come from <1% of pixels, then it is considered to be noise-dominated and hence unusable.
| Quadrant | # 1 sec bins | Bins with >0 counts | Bins with >2000 counts | High rate bins dominated by noise | Noise dominated (total time) | Noise dominated (detector-on time) | Marked lightcurve |
|---|---|---|---|---|---|---|---|
| A | 7711 | 6717 | 456 | 456 | 5.91% | 6.79% | 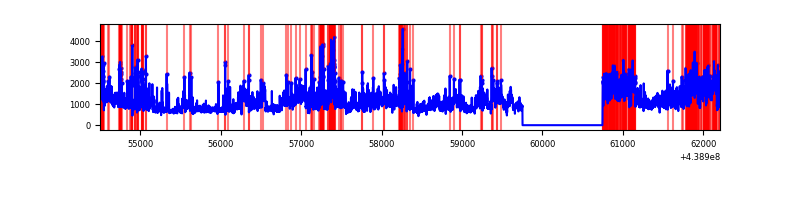 |
| B | 7710 | 6716 | 140 | 140 | 1.82% | 2.08% | 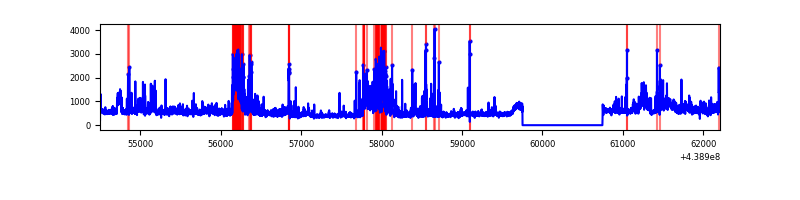 |
| C | 7710 | 6716 | 6 | 6 | 0.08% | 0.09% | 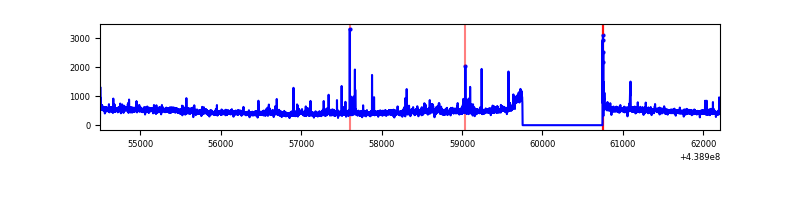 |
| D | 7710 | 6716 | 393 | 393 | 5.10% | 5.85% | 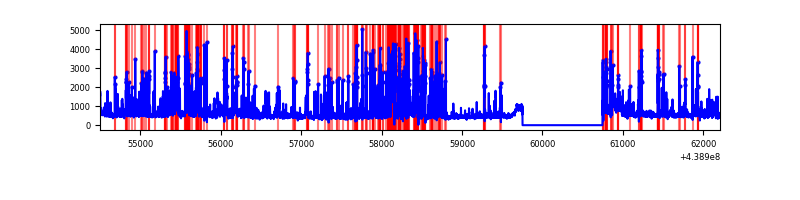 |
Top three noisy pixels from each quadrant. If the there are fewer than three noisy pixels in the level2.evt file, extra rows are filled as -1
| Pixel properties | Quadrant properties | ||||||
|---|---|---|---|---|---|---|---|
| Quadrant | DetID | PixID | Counts | Sigma | Mean | Median | Sigma |
| A | 15 | 223 | 3473105 | 22426.53 | 745 | 729 | 154.8 |
| A | 10 | 83 | 1412498 | 9117.98 | 745 | 729 | 154.8 |
| A | 7 | 3 | 57663 | 367.71 | 745 | 729 | 154.8 |
| B | 5 | 235 | 633899 | 4275.83 | 758 | 737 | 148.1 |
| B | 0 | 200 | 321113 | 2163.54 | 758 | 737 | 148.1 |
| B | 0 | 219 | 308785 | 2080.29 | 758 | 737 | 148.1 |
| C | 9 | 54 | 206892 | 1167.58 | 749 | 753 | 176.6 |
| C | 14 | 254 | 70515 | 395.13 | 749 | 753 | 176.6 |
| C | 14 | 96 | 27057 | 148.98 | 749 | 753 | 176.6 |
| D | 13 | 249 | 949267 | 5196.63 | 727 | 705 | 182.5 |
| D | 1 | 52 | 559408 | 3060.81 | 727 | 705 | 182.5 |
| D | 1 | 47 | 449799 | 2460.33 | 727 | 705 | 182.5 |
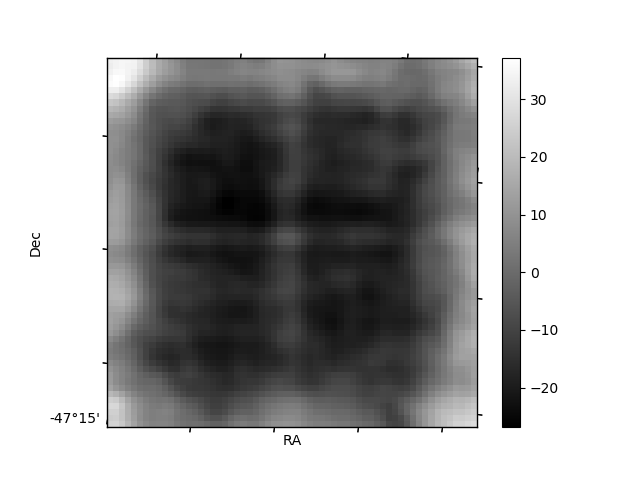
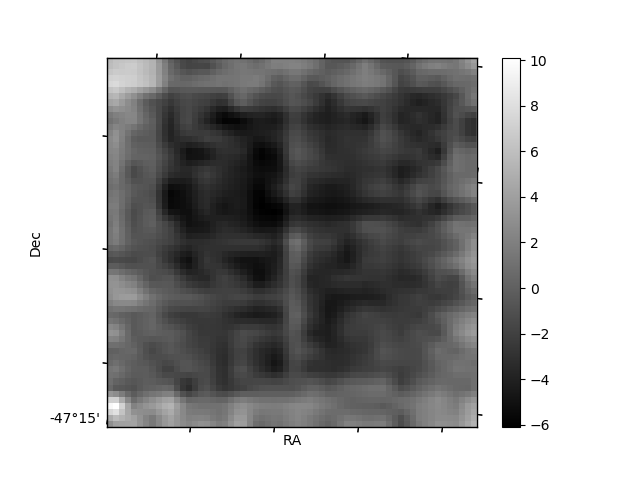
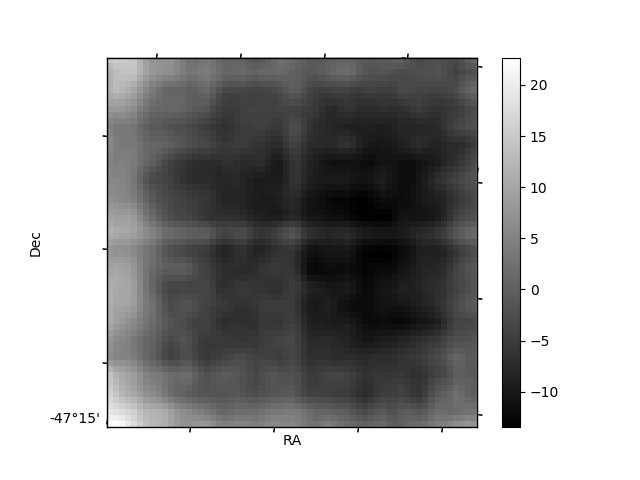
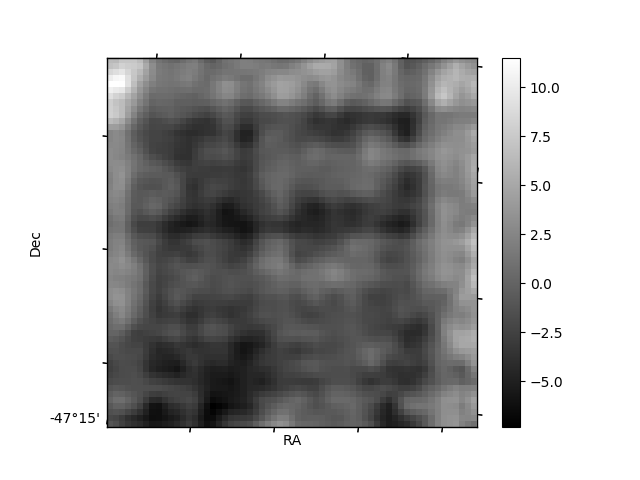
Histogram calculated using DETX and DETY for each event in the final _common_clean file
| Quadrant A | 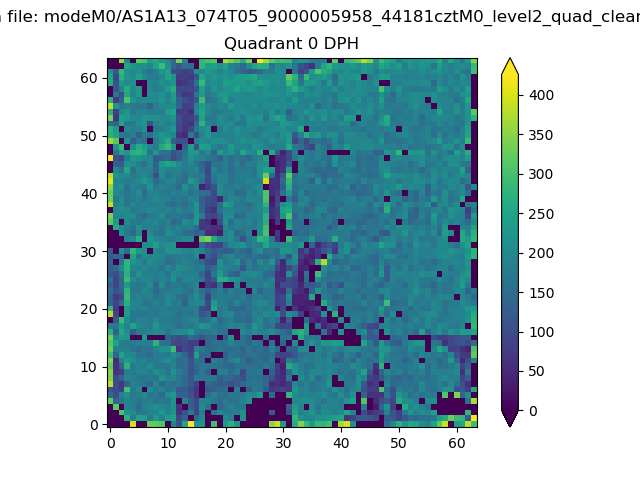 |
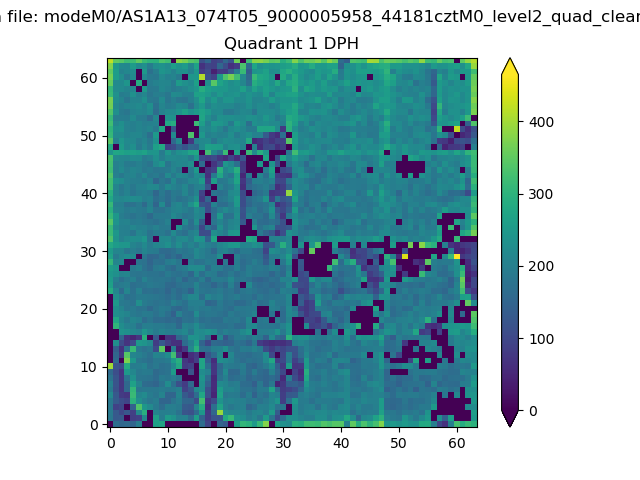 |
Quadrant B |
|---|---|---|---|
| Quadrant D | 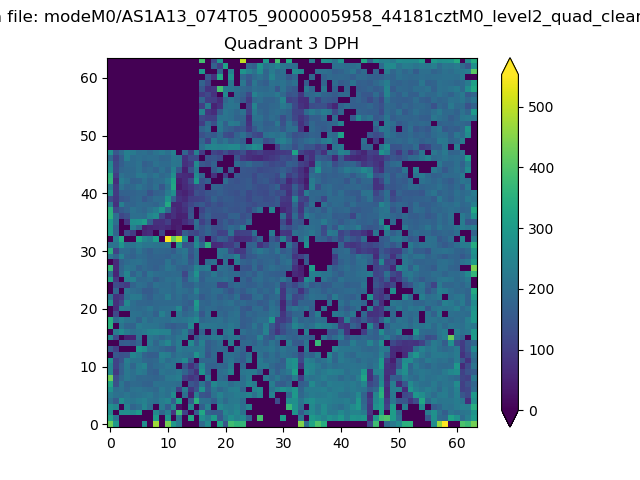 |
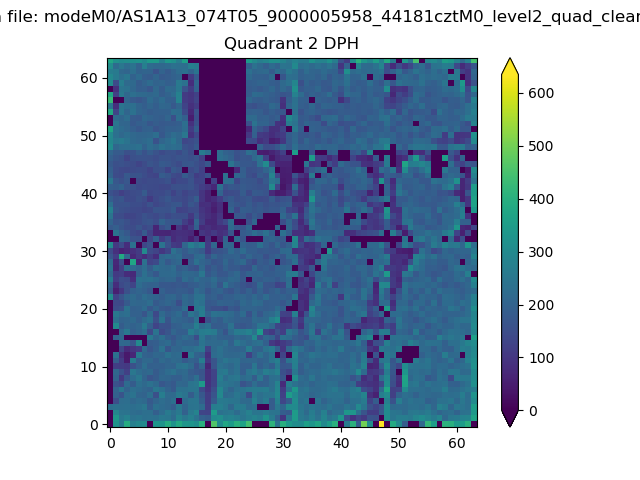 |
Quadrant C |
| Plot type | Count rate plots | Images |
|---|---|---|
| Comparison with Poisson distribution Blue bars denote a histogram of data divided into 1 sec bins. Red curve is a Poisson curve with rate = median count rate of data. |
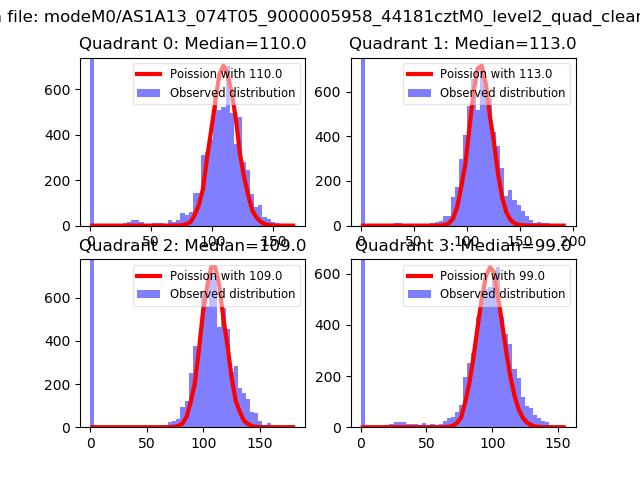 |
 |
| Quadrant-wise count rates Data is divided into 100 sec bins |
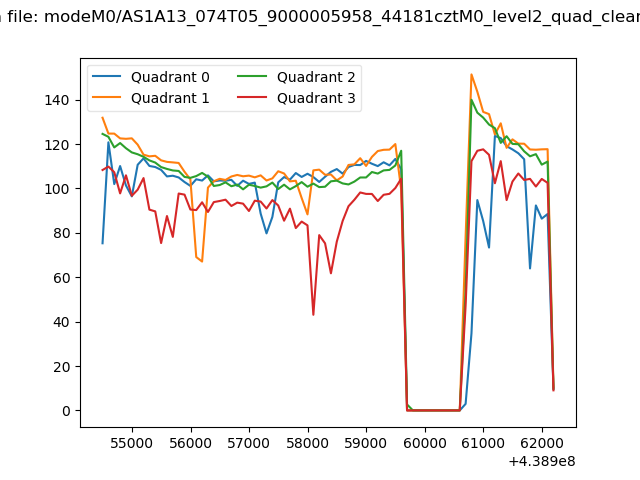 |
|
| Module-wise count rates for Quadrant A Data is divided into 100 sec bins |
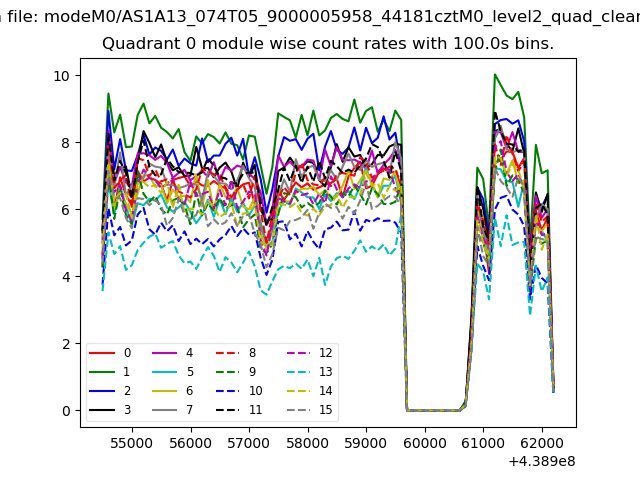 |
 |
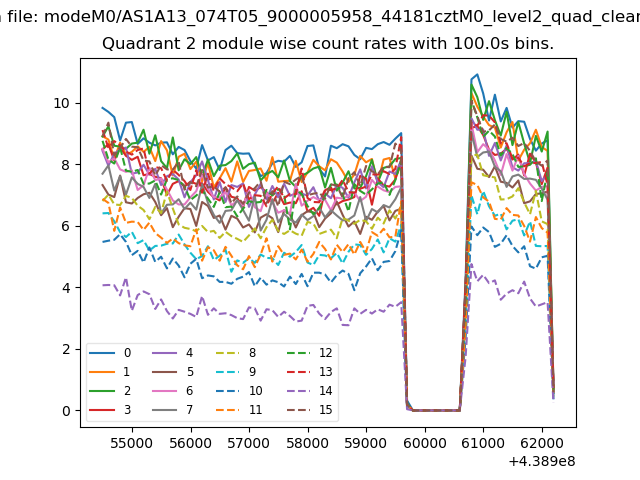
| Module-wise count rates for Quadrant B Data is divided into 100 sec bins |
 |
 |
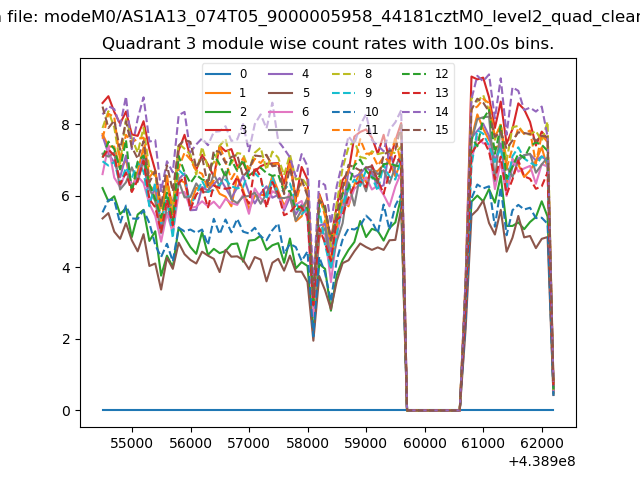
| Module-wise count rates for Quadrant C Data is divided into 100 sec bins |
 |
 |
| Module-wise count rates for Quadrant D Data is divided into 100 sec bins |
 |
 |
| Parameter | Plot |
|---|---|
| CZT HV Monitor | 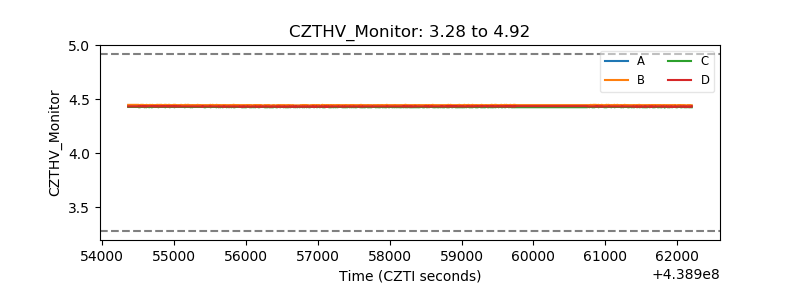 |
| D_VDD | 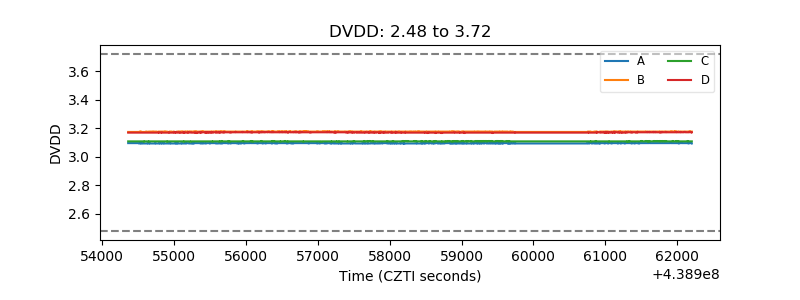 |
| Temperature 1 | 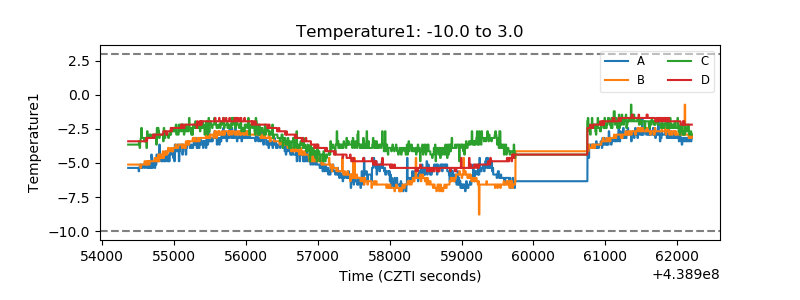 |
| Veto HV Monitor | 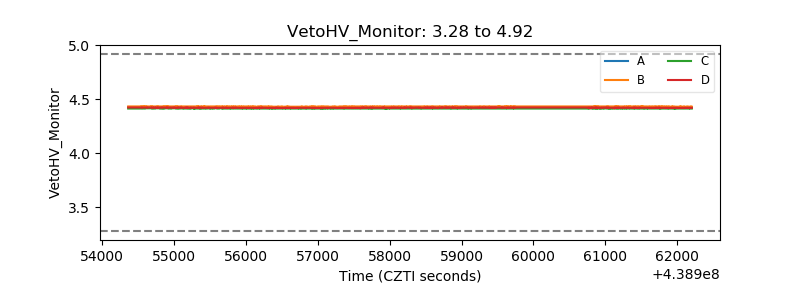 |
| Veto LLD | 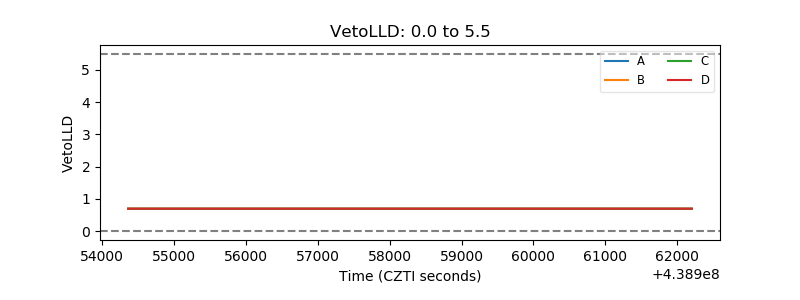 |
| Alpha Counter | 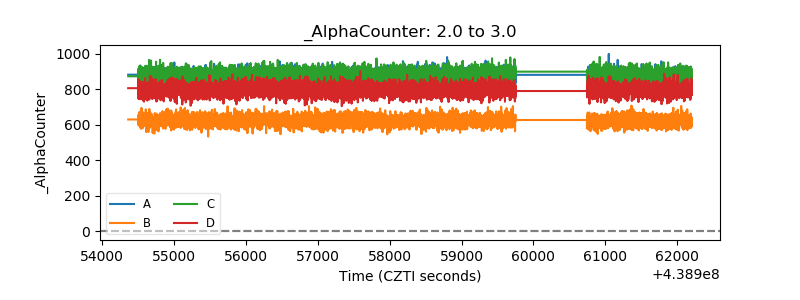 |
| _CPM_Rate | 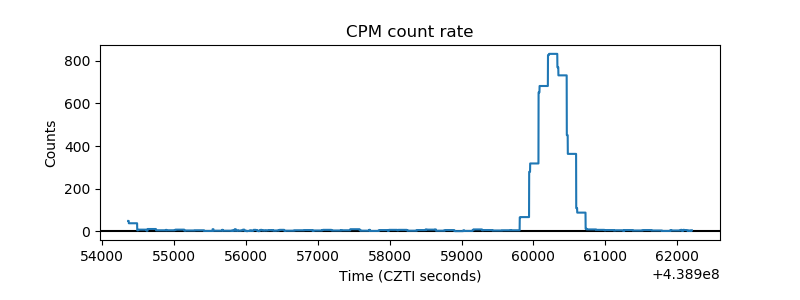 |
| CZT Counter | 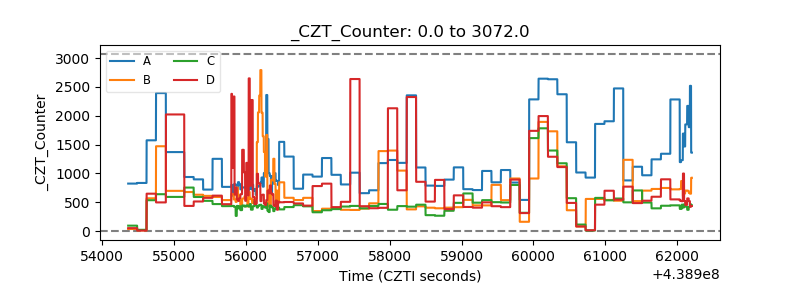 |
| +2.5 Volts monitor | 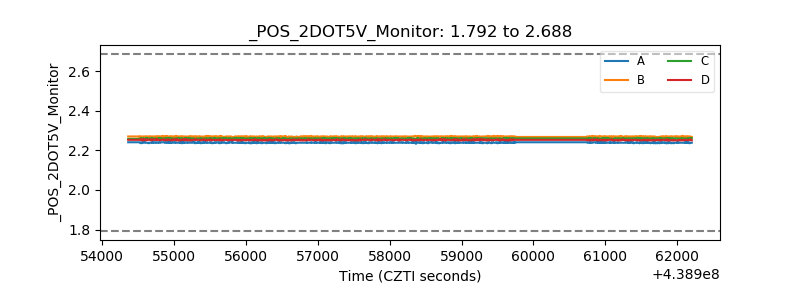 |
| +5 Volts monitor | 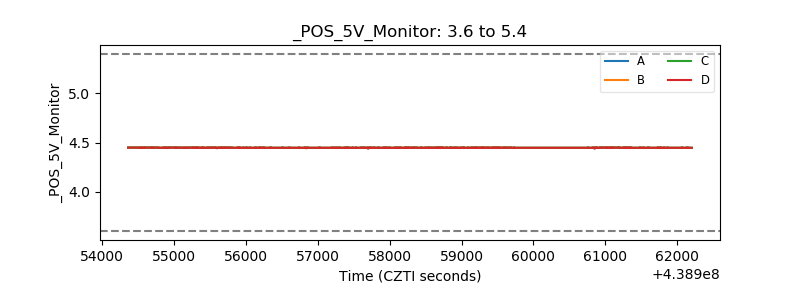 |
| _ROLL_ROT | 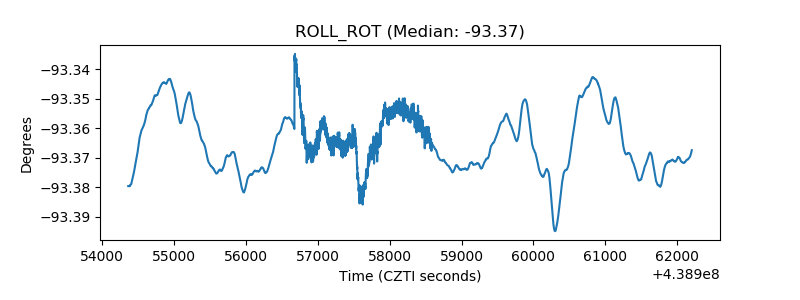 |
| _Roll_DEC | 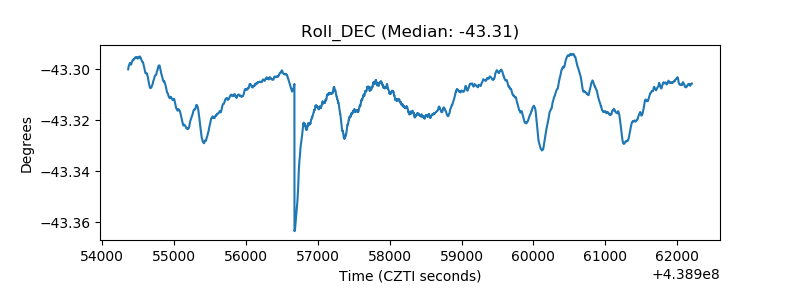 |
| _Roll_RA | 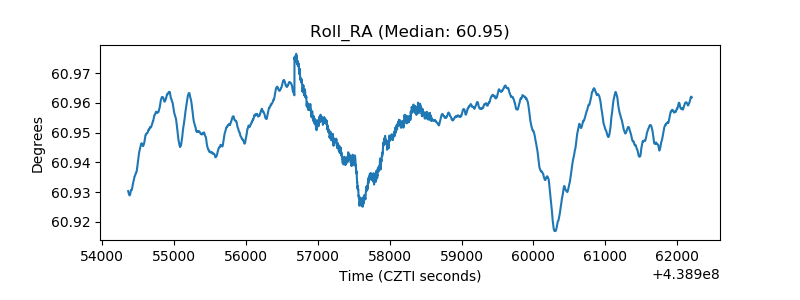 |
| Veto Counter | 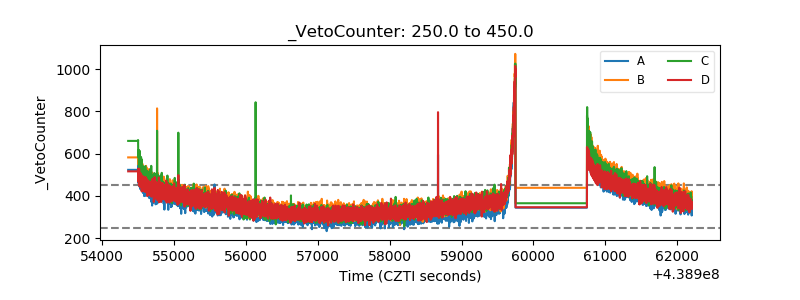 |