| Param | Original file | Final file |
|---|---|---|
| Filename | modeM0/AS1A13_074T12_9000005960_44182cztM0_level2.fits | modeM0/AS1A13_074T12_9000005960_44182cztM0_level2_quad_clean.evt |
| Size (bytes) | 389,952,000 | 65,784,960 |
| Size | 371.9 MB | 62.7 MB |
| Events in quadrant A | 3,176,979 | 468,892 |
| Events in quadrant B | 2,887,463 | 479,612 |
| Events in quadrant C | 2,083,161 | 458,551 |
| Events in quadrant D | 5,968,360 | 296,109 |
| Mode M9 | |||
|---|---|---|---|
| Quadrant | BADHDUFLAG | Total packets | Discarded packets |
| A | 0 | 11 | 0 |
| B | 0 | 11 | 0 |
| C | 0 | 11 | 0 |
| D | 0 | 11 | 0 |
| Mode M0 | |||
|---|---|---|---|
| Quadrant | BADHDUFLAG | Total packets | Discarded packets |
| A | 0 | 12788 | 1 |
| B | 0 | 11411 | 1 |
| C | 0 | 9074 | 1 |
| D | 0 | 20584 | 1 |
| Mode SS | |||
|---|---|---|---|
| Quadrant | BADHDUFLAG | Total packets | Discarded packets |
| A | 0 | 84 | 0 |
| B | 0 | 84 | 0 |
| C | 0 | 84 | 0 |
| D | 0 | 84 | 0 |
| Quadrant | Total seconds | Saturated seconds | Saturation percentage |
|---|---|---|---|
| A | 4095 | 163 | 3.980464% |
| B | 4095 | 224 | 5.470085% |
| C | 4095 | 59 | 1.440781% |
| D | 4095 | 1399 | 34.163614% |
Noise dominated data is calculated using 1-second bins in cleaned event files. If a bin has >2000 counts, and if more than 50% of those come from <1% of pixels, then it is considered to be noise-dominated and hence unusable.
| Quadrant | # 1 sec bins | Bins with >0 counts | Bins with >2000 counts | High rate bins dominated by noise | Noise dominated (total time) | Noise dominated (detector-on time) | Marked lightcurve |
|---|---|---|---|---|---|---|---|
| A | 5225 | 4096 | 42 | 42 | 0.80% | 1.03% | 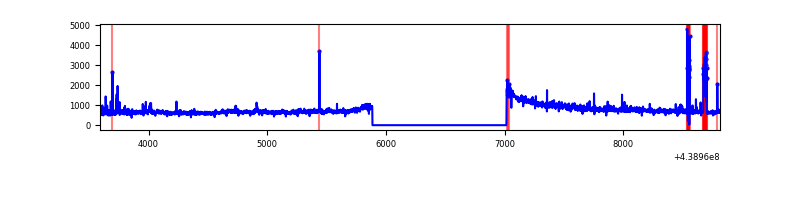 |
| B | 5225 | 4096 | 108 | 108 | 2.07% | 2.64% | 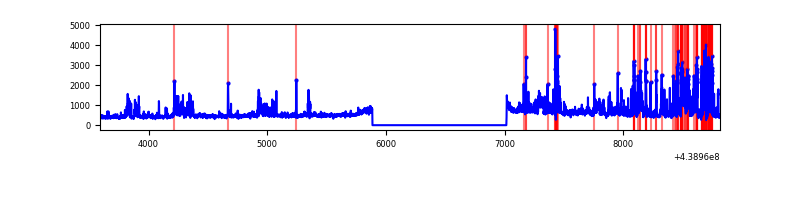 |
| C | 5225 | 4096 | 18 | 18 | 0.34% | 0.44% | 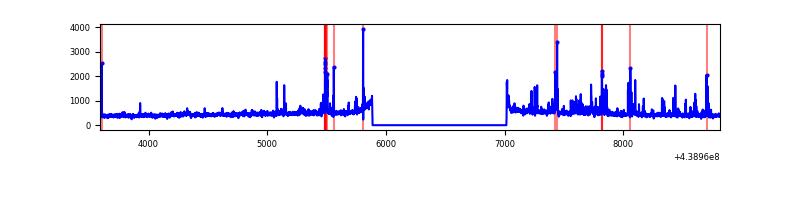 |
| D | 5225 | 4096 | 1173 | 1173 | 22.45% | 28.64% | 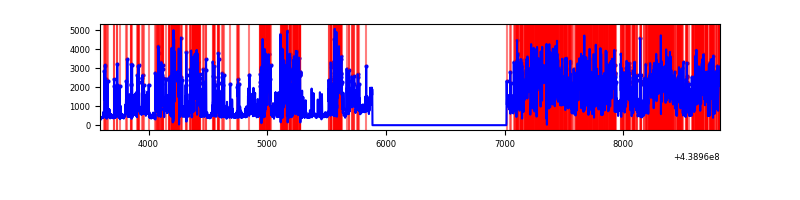 |
Top three noisy pixels from each quadrant. If the there are fewer than three noisy pixels in the level2.evt file, extra rows are filled as -1
| Pixel properties | Quadrant properties | ||||||
|---|---|---|---|---|---|---|---|
| Quadrant | DetID | PixID | Counts | Sigma | Mean | Median | Sigma |
| A | 10 | 83 | 956036 | 9497.19 | 479 | 469 | 100.6 |
| A | 15 | 223 | 324451 | 3219.99 | 479 | 469 | 100.6 |
| A | 7 | 3 | 25899 | 252.74 | 479 | 469 | 100.6 |
| B | 5 | 235 | 408826 | 4353.83 | 476 | 463 | 93.8 |
| B | 0 | 219 | 195566 | 2080.12 | 476 | 463 | 93.8 |
| B | 0 | 189 | 121254 | 1287.83 | 476 | 463 | 93.8 |
| C | 14 | 254 | 122850 | 1109.91 | 467 | 471 | 110.3 |
| C | 9 | 54 | 42273 | 379.12 | 467 | 471 | 110.3 |
| C | 15 | 208 | 40473 | 362.8 | 467 | 471 | 110.3 |
| D | 1 | 52 | 2716700 | 26516.73 | 389 | 375 | 102.4 |
| D | 13 | 249 | 557572 | 5439.35 | 389 | 375 | 102.4 |
| D | 1 | 47 | 489113 | 4771.05 | 389 | 375 | 102.4 |
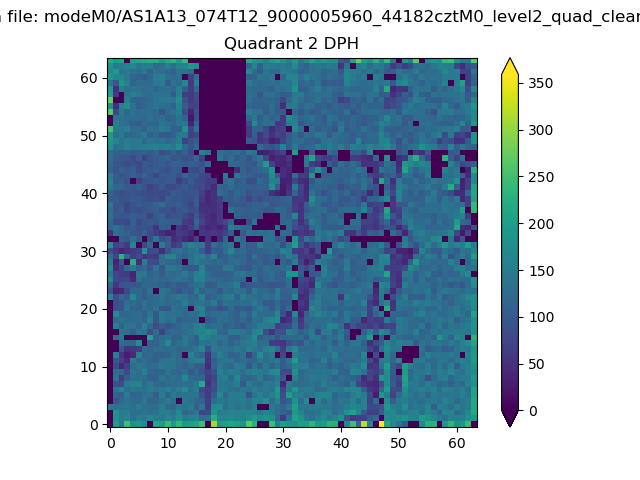
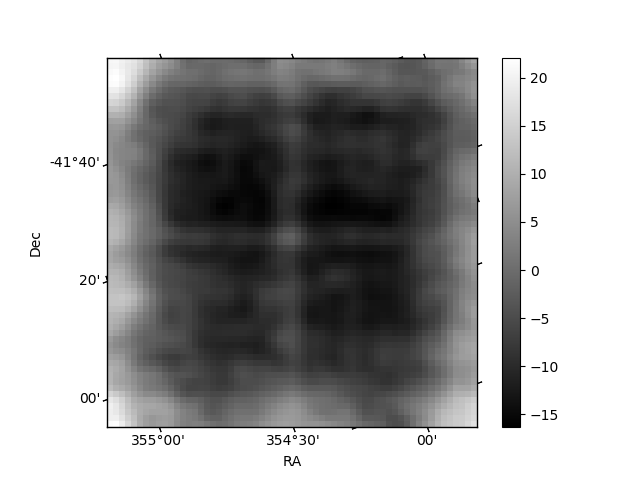
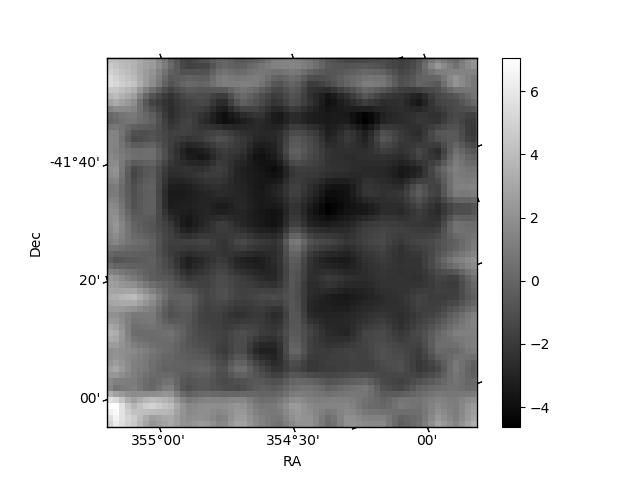
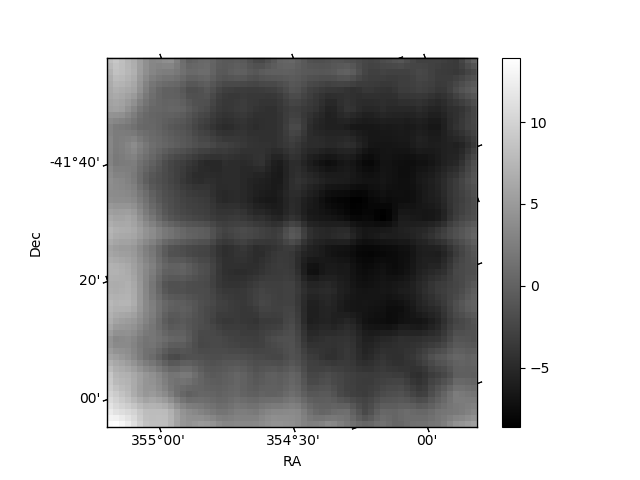
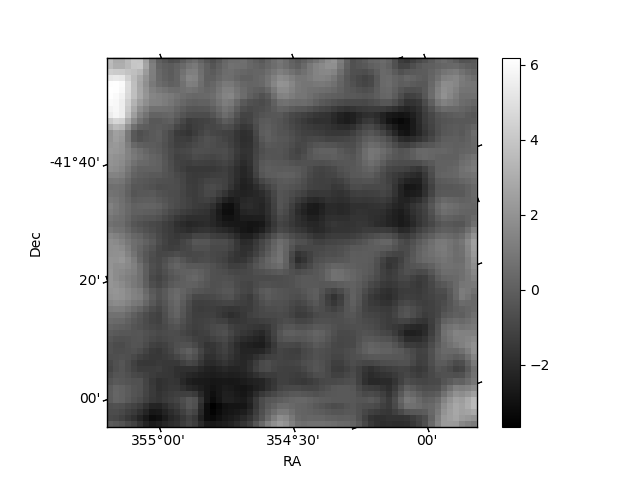
Histogram calculated using DETX and DETY for each event in the final _common_clean file
| Quadrant A | 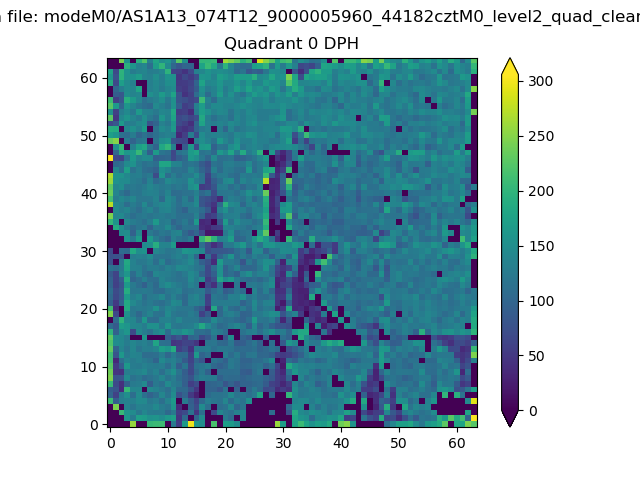 |
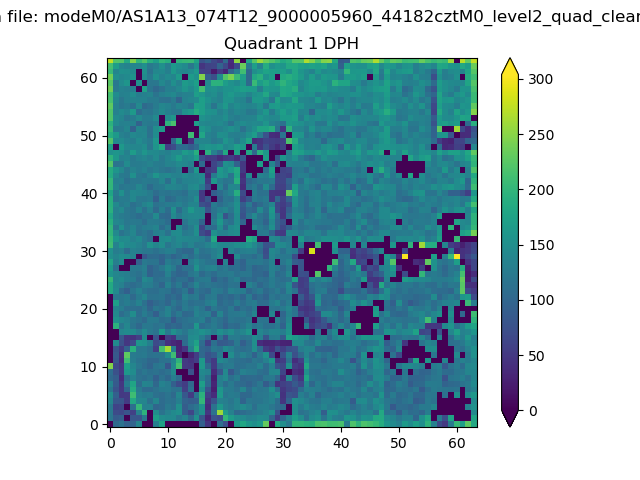 |
Quadrant B |
|---|---|---|---|
| Quadrant D | 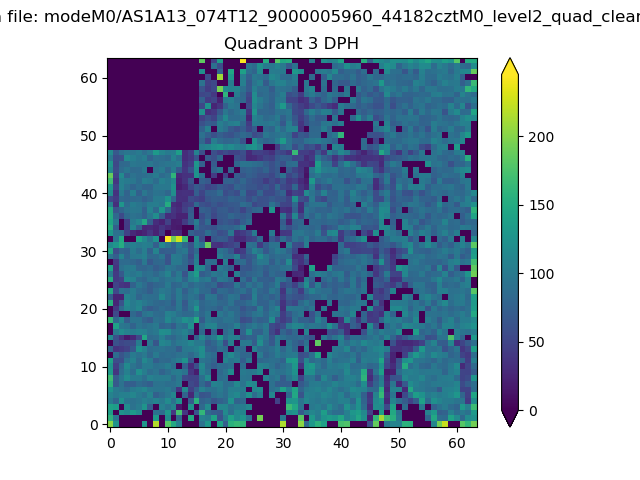 |
 |
Quadrant C |
| Plot type | Count rate plots | Images |
|---|---|---|
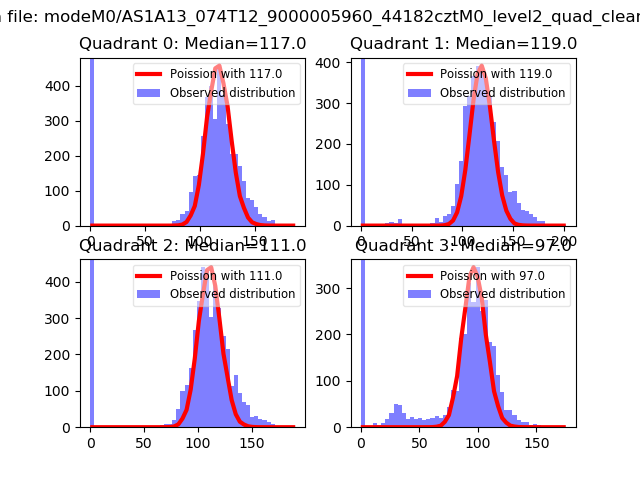
| Comparison with Poisson distribution Blue bars denote a histogram of data divided into 1 sec bins. Red curve is a Poisson curve with rate = median count rate of data. |
 |
 |
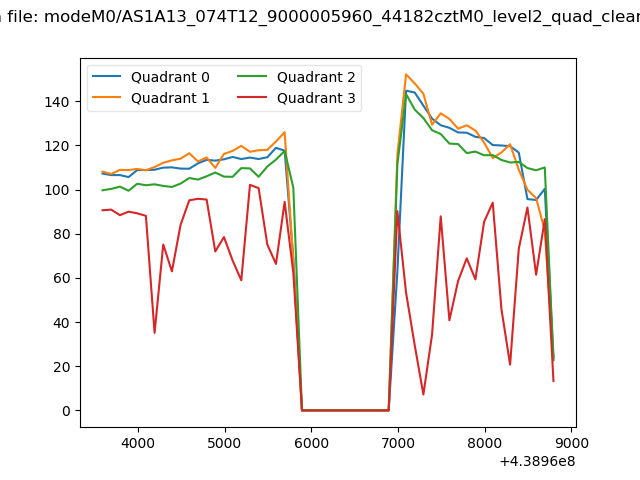
| Quadrant-wise count rates Data is divided into 100 sec bins |
 |
|
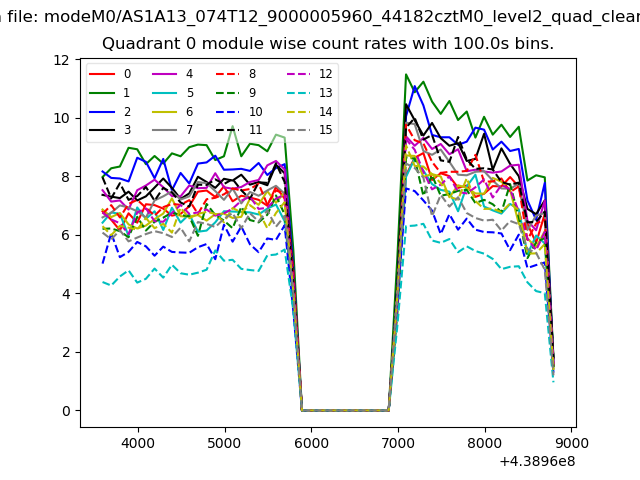
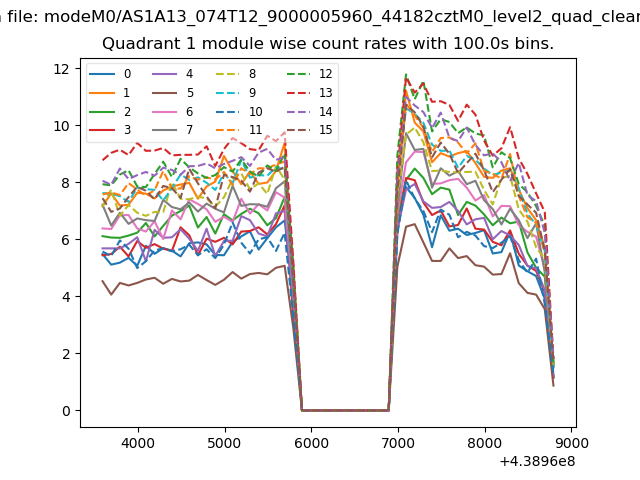
| Module-wise count rates for Quadrant A Data is divided into 100 sec bins |
 |
 |
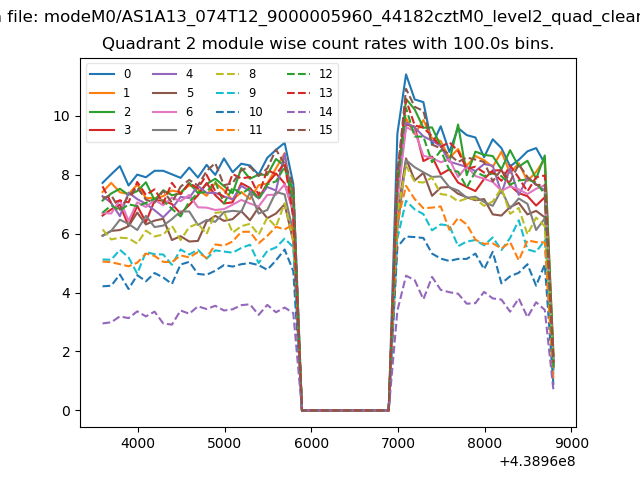
| Module-wise count rates for Quadrant B Data is divided into 100 sec bins |
 |
 |
| Module-wise count rates for Quadrant C Data is divided into 100 sec bins |
 |
 |
| Module-wise count rates for Quadrant D Data is divided into 100 sec bins |
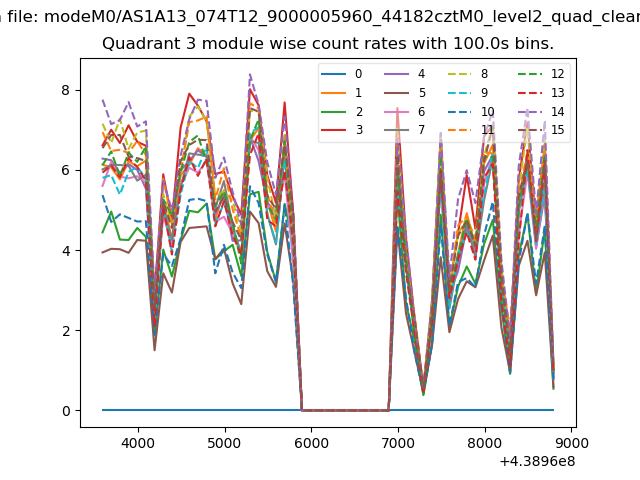 |
 |
| Parameter | Plot |
|---|---|
| CZT HV Monitor | 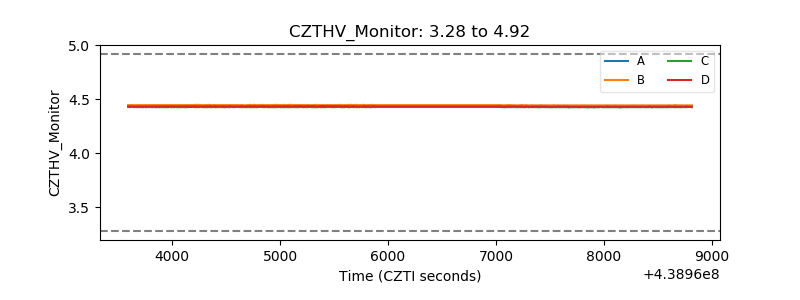 |
| D_VDD | 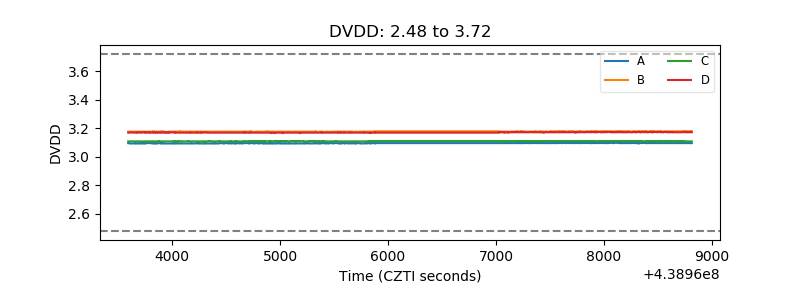 |
| Temperature 1 | 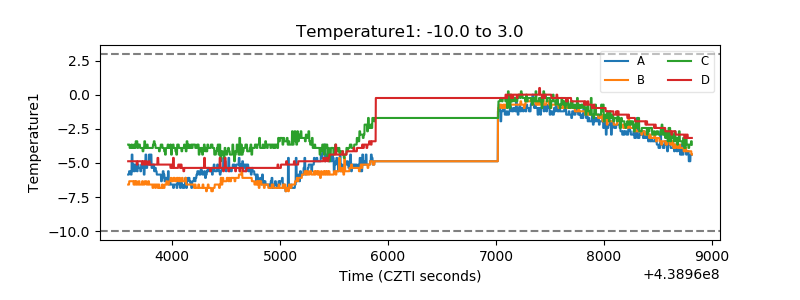 |
| Veto HV Monitor | 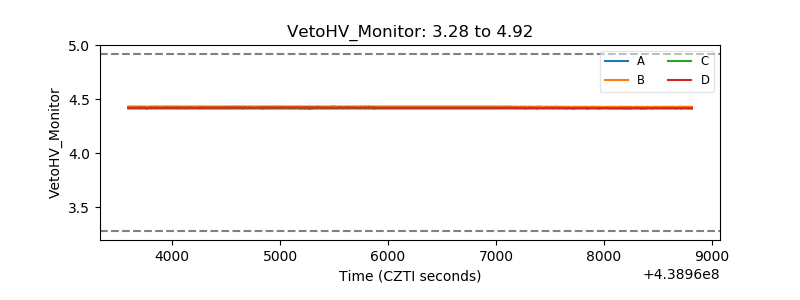 |
| Veto LLD | 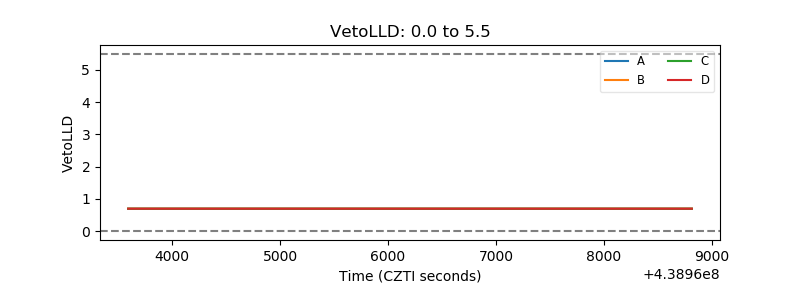 |
| Alpha Counter | 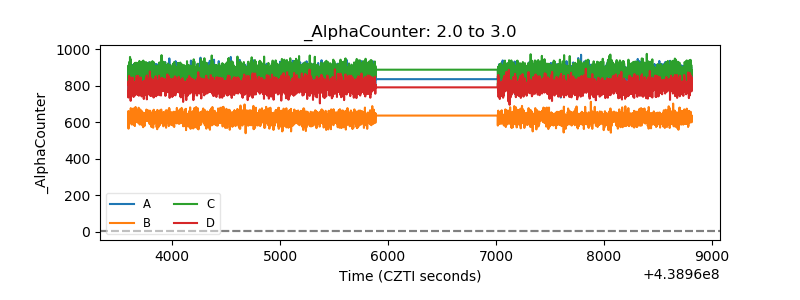 |
| _CPM_Rate | 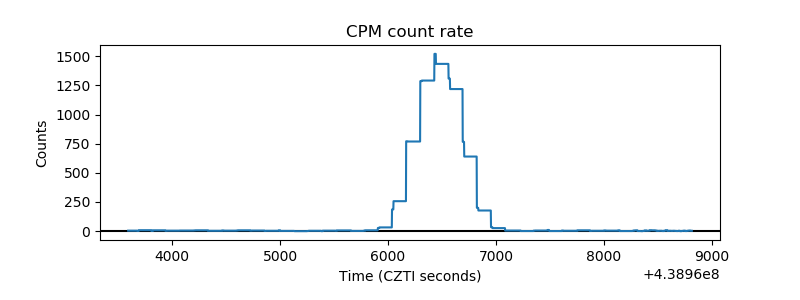 |
| CZT Counter | 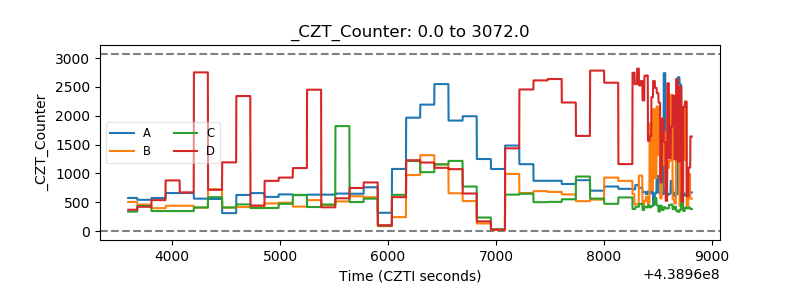 |
| +2.5 Volts monitor | 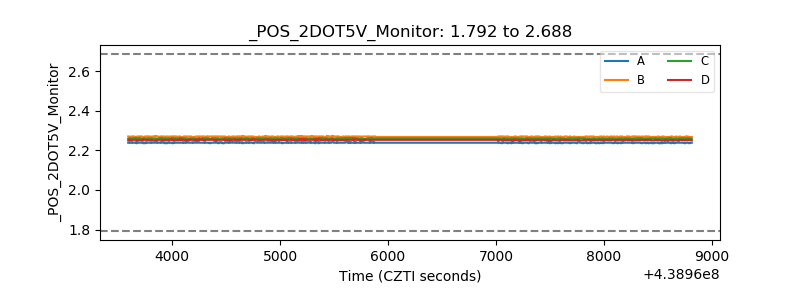 |
| +5 Volts monitor | 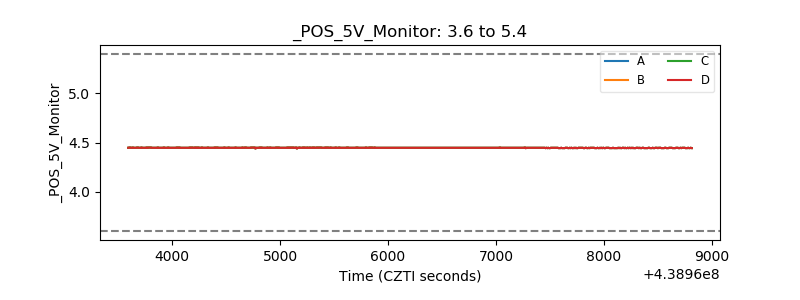 |
| _ROLL_ROT | 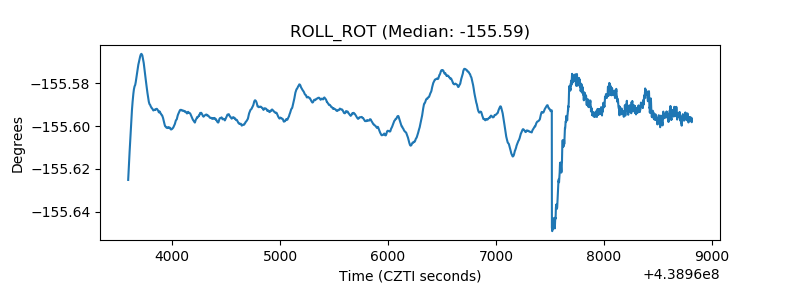 |
| _Roll_DEC | 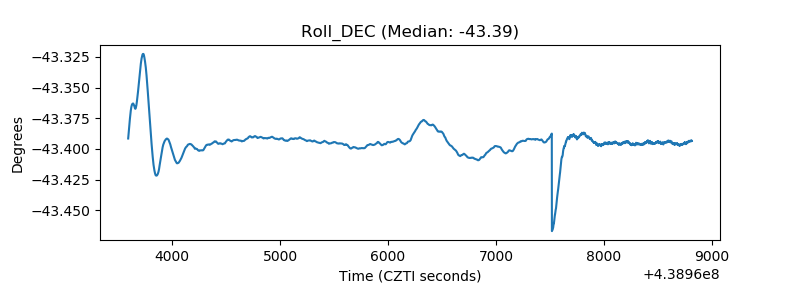 |
| _Roll_RA | 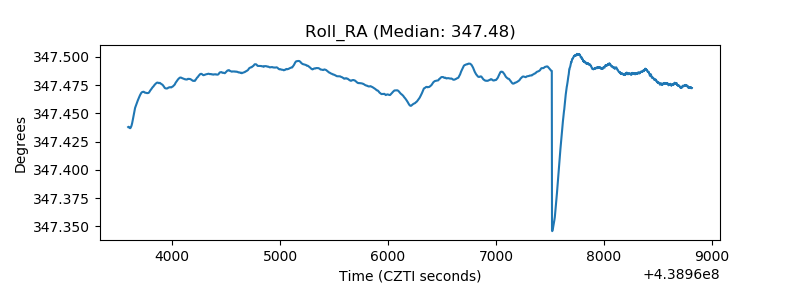 |
| Veto Counter | 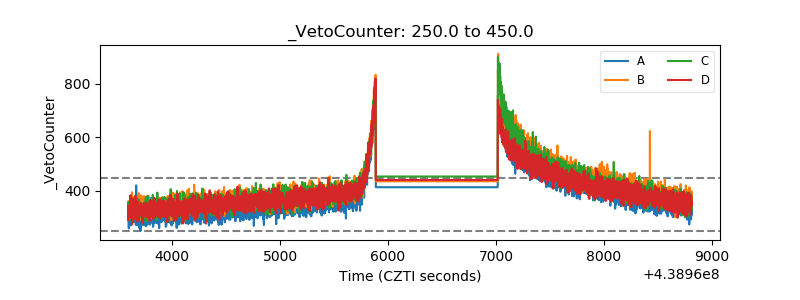 |