| Param | Original file | Final file |
|---|---|---|
| Filename | modeM0/AS1A13_074T12_9000005960_44183cztM0_level2.fits | modeM0/AS1A13_074T12_9000005960_44183cztM0_level2_quad_clean.evt |
| Size (bytes) | 601,879,680 | 98,965,440 |
| Size | 574.0 MB | 94.4 MB |
| Events in quadrant A | 4,964,165 | 714,097 |
| Events in quadrant B | 4,369,783 | 727,828 |
| Events in quadrant C | 3,298,159 | 698,307 |
| Events in quadrant D | 9,172,448 | 428,590 |
| Mode M9 | |||
|---|---|---|---|
| Quadrant | BADHDUFLAG | Total packets | Discarded packets |
| A | 0 | 13 | 0 |
| B | 0 | 13 | 0 |
| C | 0 | 13 | 0 |
| D | 0 | 13 | 0 |
| Mode M0 | |||
|---|---|---|---|
| Quadrant | BADHDUFLAG | Total packets | Discarded packets |
| A | 0 | 19504 | 1 |
| B | 0 | 17179 | 1 |
| C | 0 | 14044 | 1 |
| D | 0 | 31537 | 4 |
| Mode SS | |||
|---|---|---|---|
| Quadrant | BADHDUFLAG | Total packets | Discarded packets |
| A | 0 | 124 | 0 |
| B | 0 | 124 | 0 |
| C | 0 | 124 | 0 |
| D | 0 | 124 | 0 |
| Quadrant | Total seconds | Saturated seconds | Saturation percentage |
|---|---|---|---|
| A | 6127 | 203 | 3.313204% |
| B | 6128 | 320 | 5.221932% |
| C | 6128 | 65 | 1.060705% |
| D | 6127 | 2203 | 35.955606% |
Noise dominated data is calculated using 1-second bins in cleaned event files. If a bin has >2000 counts, and if more than 50% of those come from <1% of pixels, then it is considered to be noise-dominated and hence unusable.
| Quadrant | # 1 sec bins | Bins with >0 counts | Bins with >2000 counts | High rate bins dominated by noise | Noise dominated (total time) | Noise dominated (detector-on time) | Marked lightcurve |
|---|---|---|---|---|---|---|---|
| A | 7352 | 6128 | 102 | 102 | 1.39% | 1.66% | 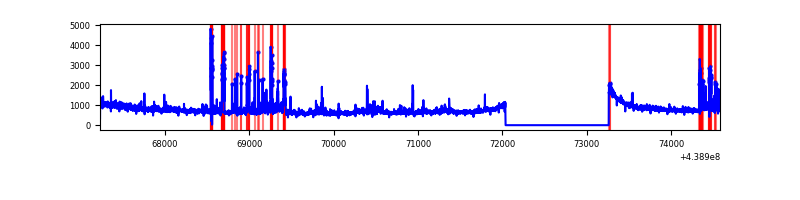 |
| B | 7353 | 6129 | 165 | 165 | 2.24% | 2.69% | 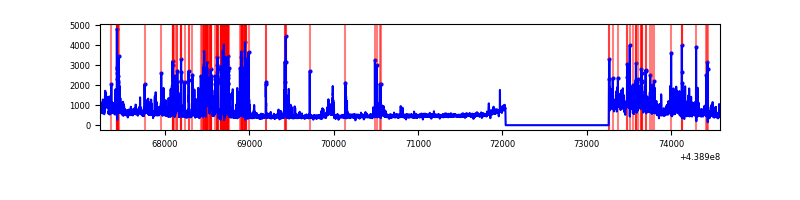 |
| C | 7353 | 6129 | 49 | 49 | 0.67% | 0.80% | 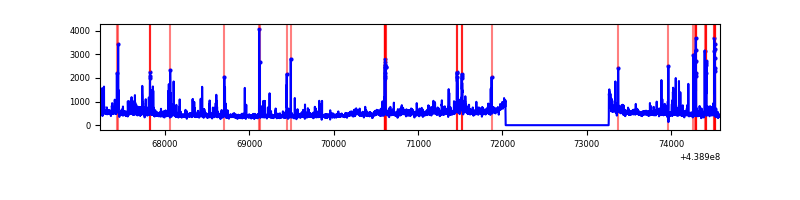 |
| D | 7352 | 6128 | 1995 | 1995 | 27.14% | 32.56% | 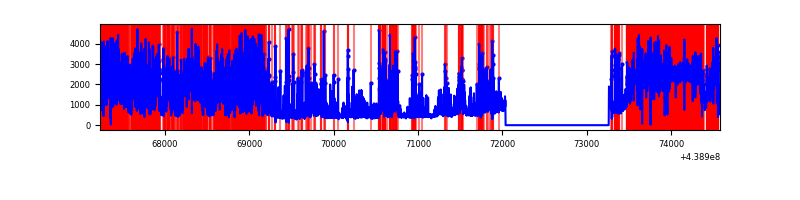 |
Top three noisy pixels from each quadrant. If the there are fewer than three noisy pixels in the level2.evt file, extra rows are filled as -1
| Pixel properties | Quadrant properties | ||||||
|---|---|---|---|---|---|---|---|
| Quadrant | DetID | PixID | Counts | Sigma | Mean | Median | Sigma |
| A | 10 | 83 | 1484421 | 9965.52 | 710 | 696 | 148.9 |
| A | 15 | 223 | 641479 | 4303.85 | 710 | 696 | 148.9 |
| A | 7 | 3 | 18436 | 119.15 | 710 | 696 | 148.9 |
| B | 5 | 235 | 457486 | 3361.22 | 705 | 688 | 135.9 |
| B | 0 | 200 | 263904 | 1936.8 | 705 | 688 | 135.9 |
| B | 0 | 189 | 159198 | 1166.35 | 705 | 688 | 135.9 |
| C | 14 | 254 | 278952 | 1709.71 | 686 | 691 | 162.8 |
| C | 3 | 233 | 118567 | 724.26 | 686 | 691 | 162.8 |
| C | 9 | 54 | 106818 | 652.07 | 686 | 691 | 162.8 |
| D | 1 | 52 | 2530838 | 17514.97 | 567 | 549 | 144.5 |
| D | 13 | 168 | 1807251 | 12506.21 | 567 | 549 | 144.5 |
| D | 13 | 249 | 770818 | 5331.9 | 567 | 549 | 144.5 |
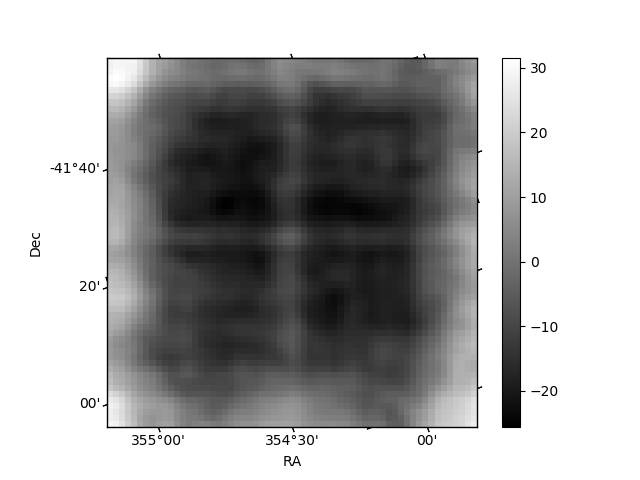
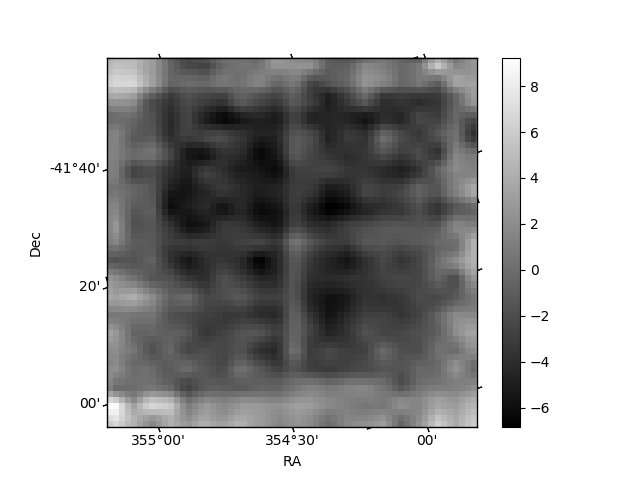
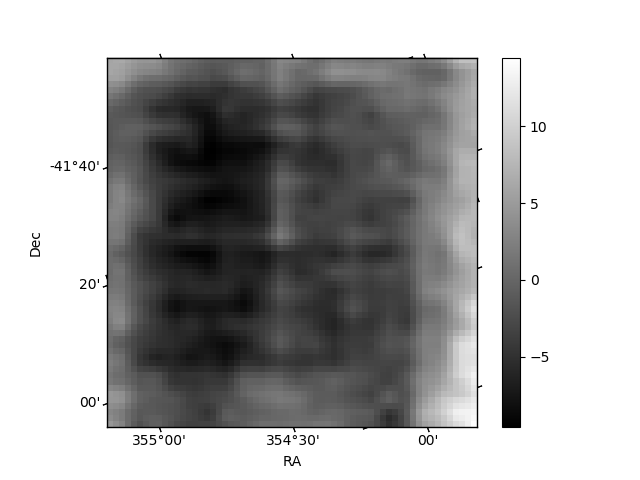
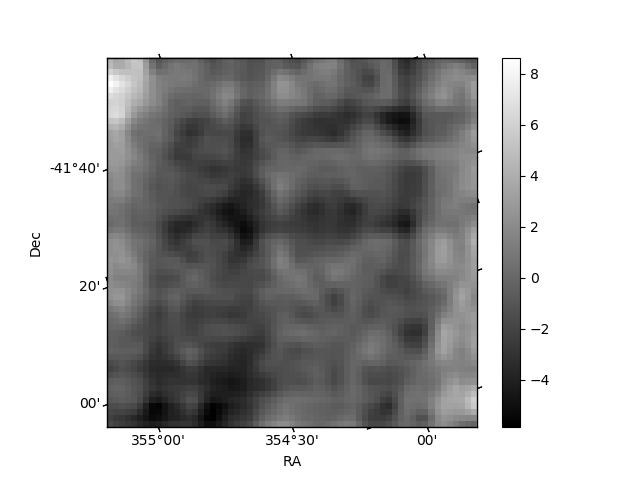
Histogram calculated using DETX and DETY for each event in the final _common_clean file
| Quadrant A | 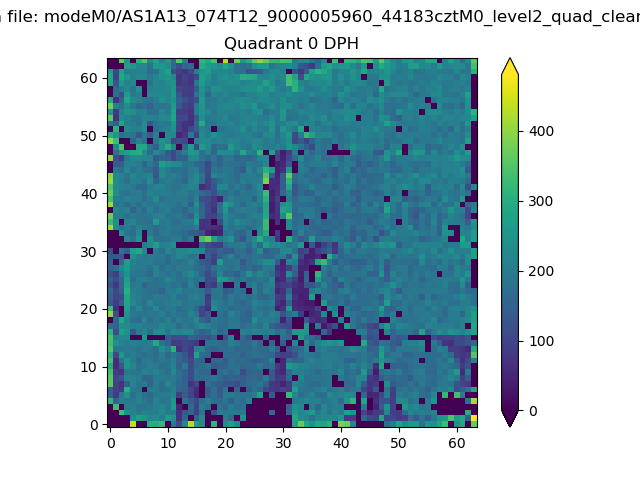 |
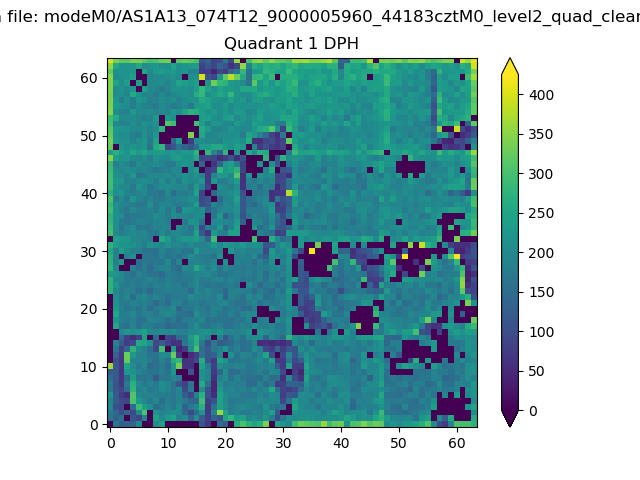 |
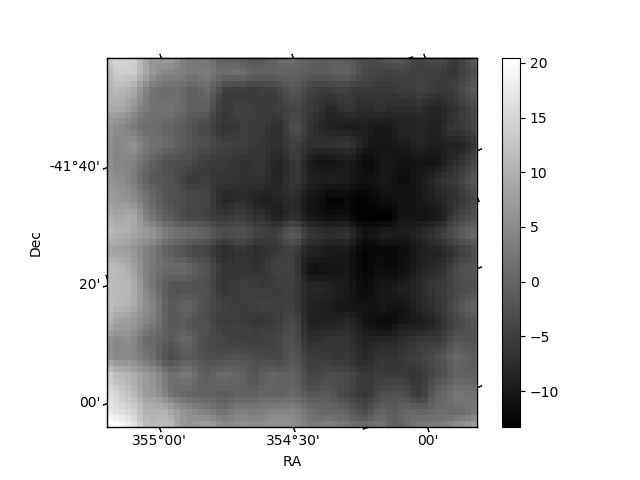
Quadrant B |
|---|---|---|---|
| Quadrant D | 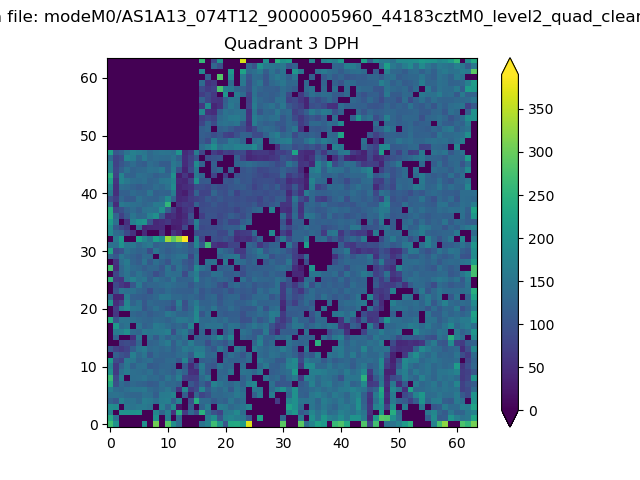 |
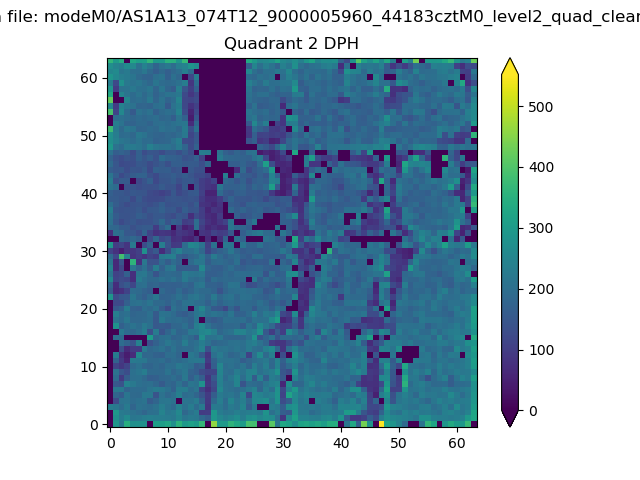 |
Quadrant C |
| Plot type | Count rate plots | Images |
|---|---|---|
| Comparison with Poisson distribution Blue bars denote a histogram of data divided into 1 sec bins. Red curve is a Poisson curve with rate = median count rate of data. |
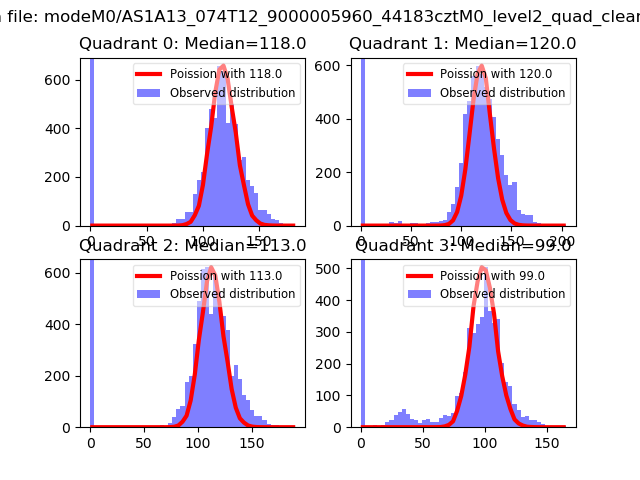 |
 |
| Quadrant-wise count rates Data is divided into 100 sec bins |
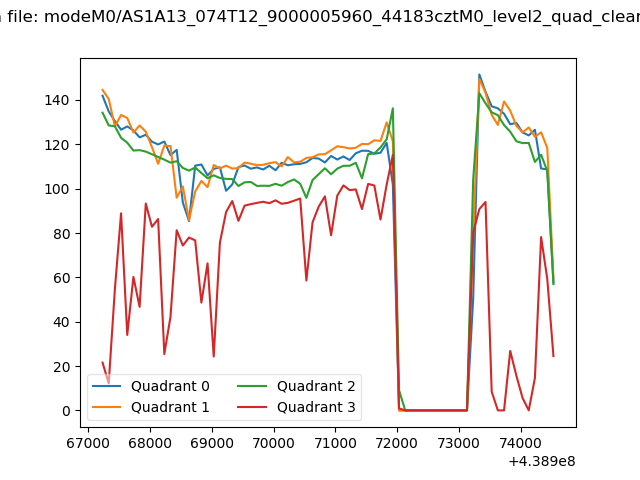 |
|
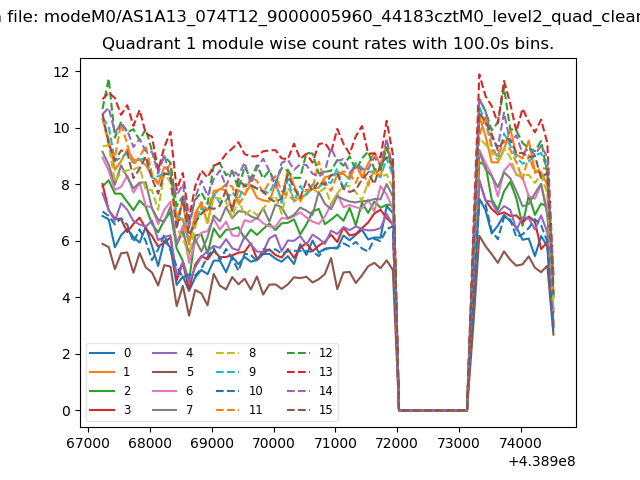
| Module-wise count rates for Quadrant A Data is divided into 100 sec bins |
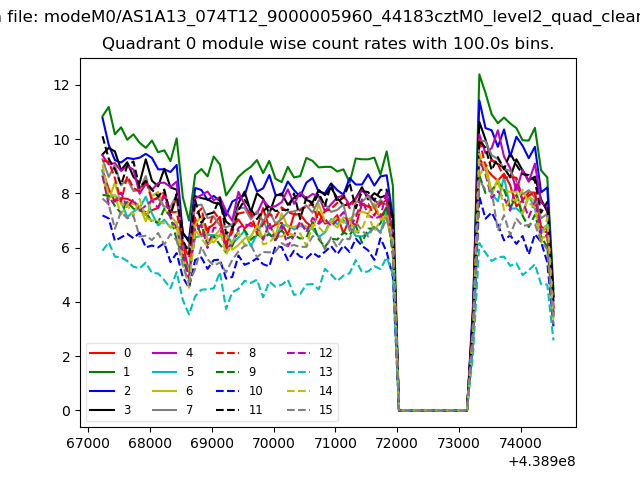 |
 |
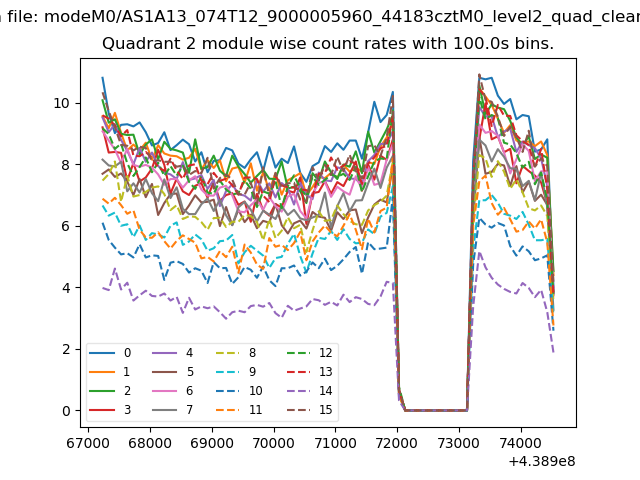
| Module-wise count rates for Quadrant B Data is divided into 100 sec bins |
 |
 |
| Module-wise count rates for Quadrant C Data is divided into 100 sec bins |
 |
 |
| Module-wise count rates for Quadrant D Data is divided into 100 sec bins |
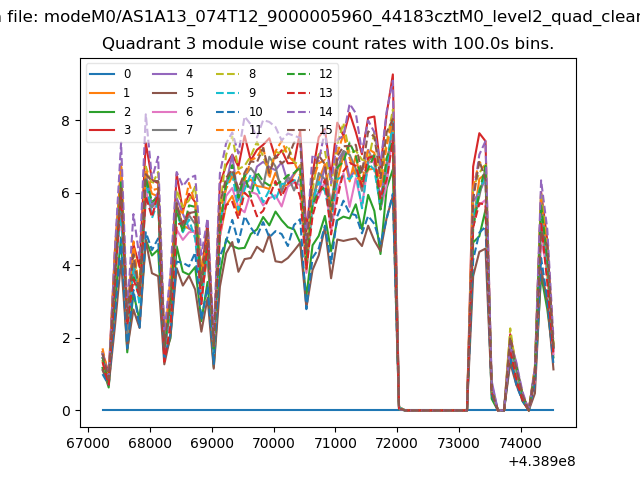 |
 |
| Parameter | Plot |
|---|---|
| CZT HV Monitor | 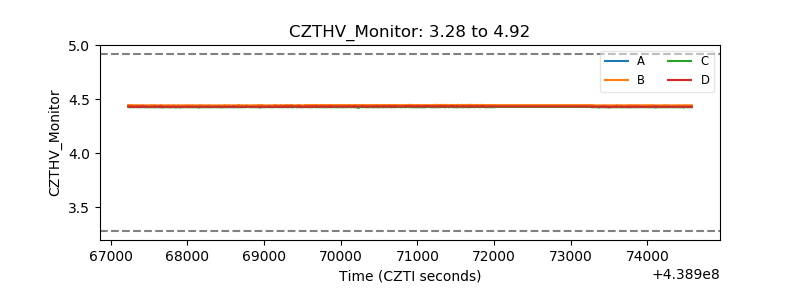 |
| D_VDD | 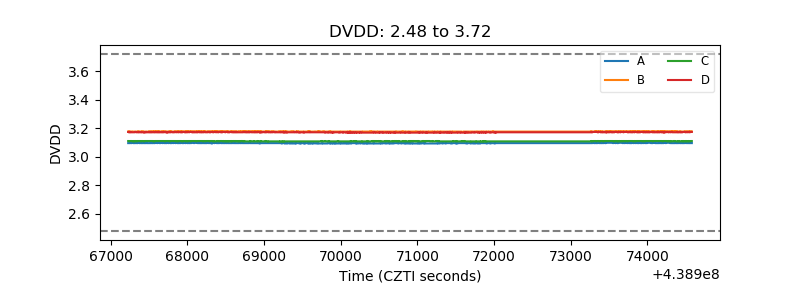 |
| Temperature 1 | 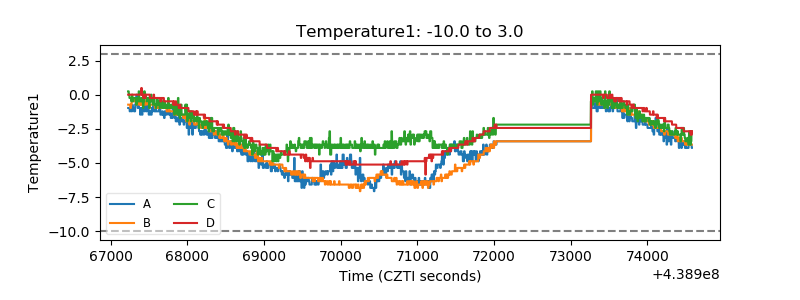 |
| Veto HV Monitor | 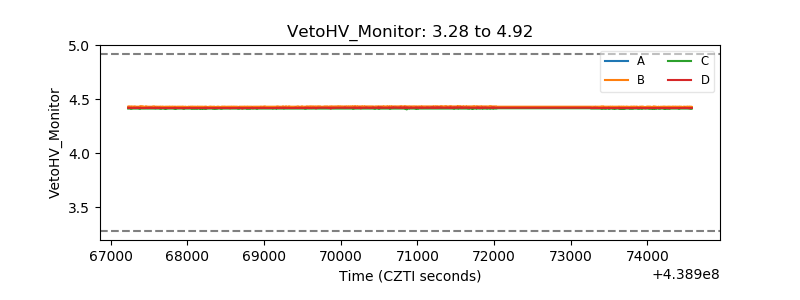 |
| Veto LLD | 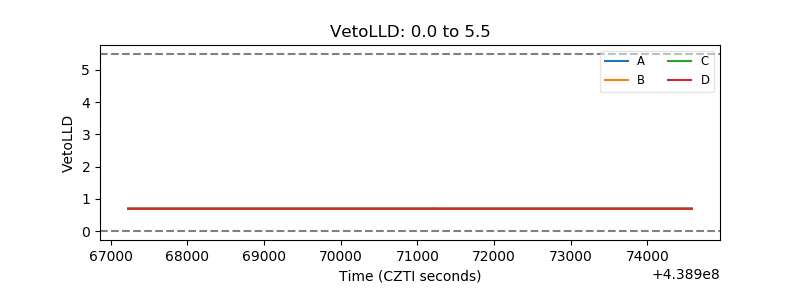 |
| Alpha Counter | 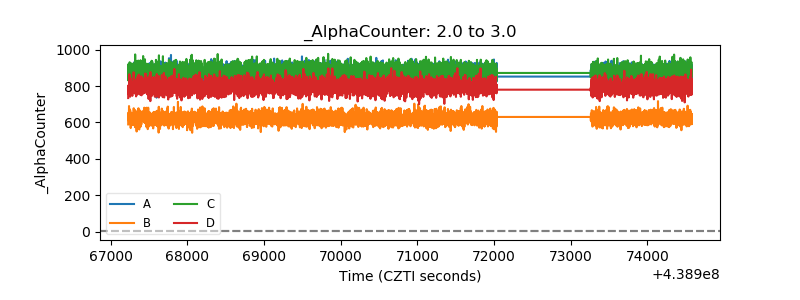 |
| _CPM_Rate | 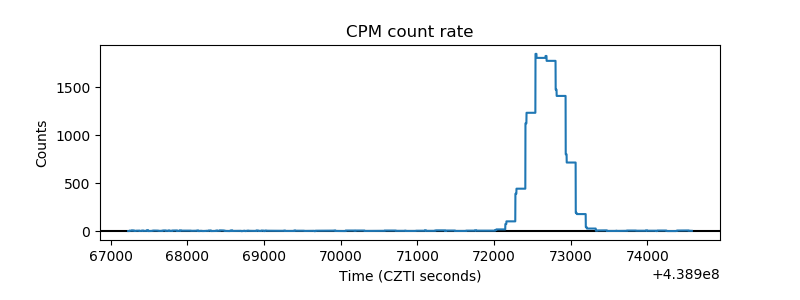 |
| CZT Counter | 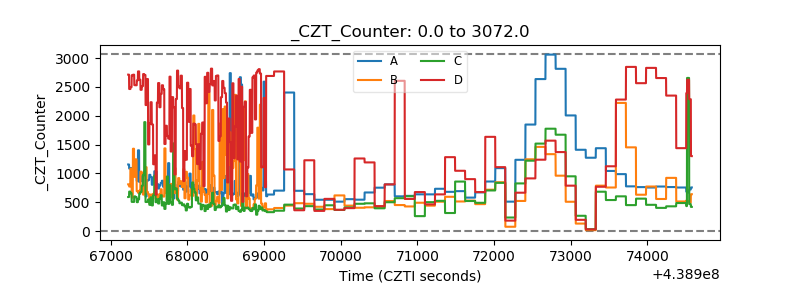 |
| +2.5 Volts monitor | 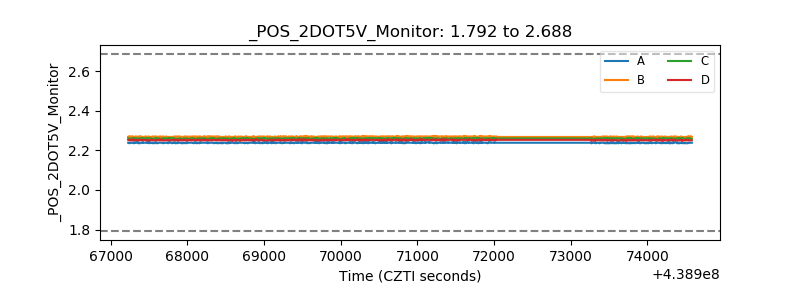 |
| +5 Volts monitor | 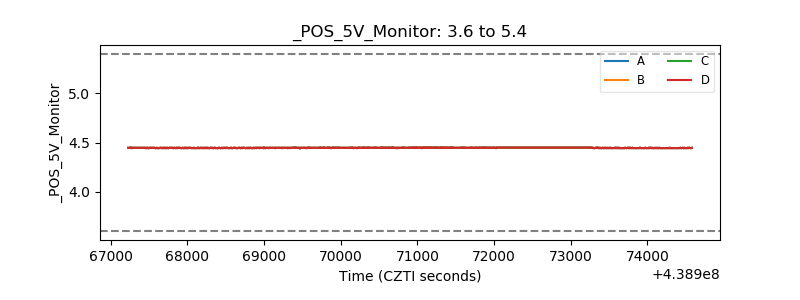 |
| _ROLL_ROT | 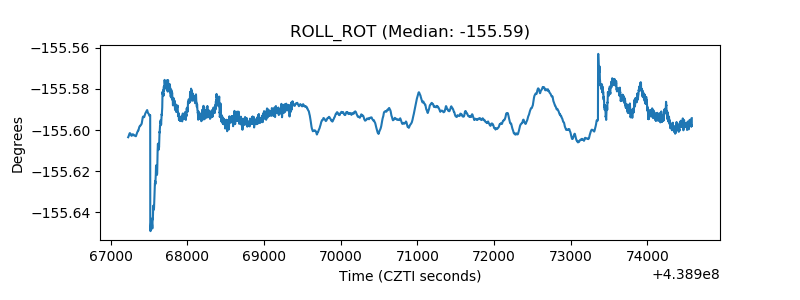 |
| _Roll_DEC | 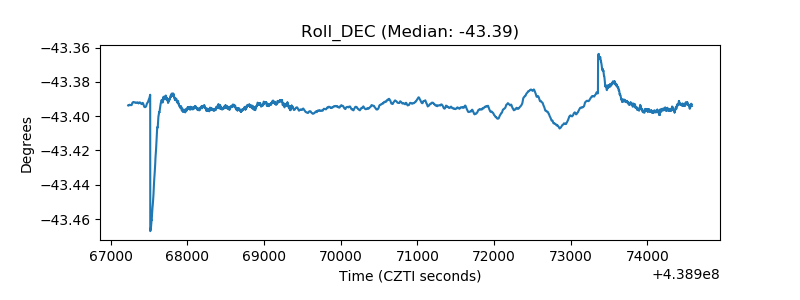 |
| _Roll_RA | 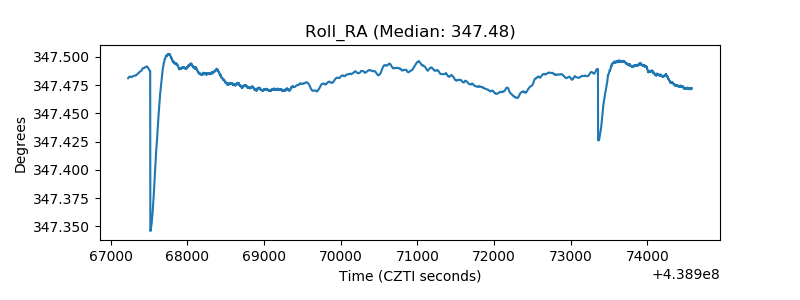 |
| Veto Counter | 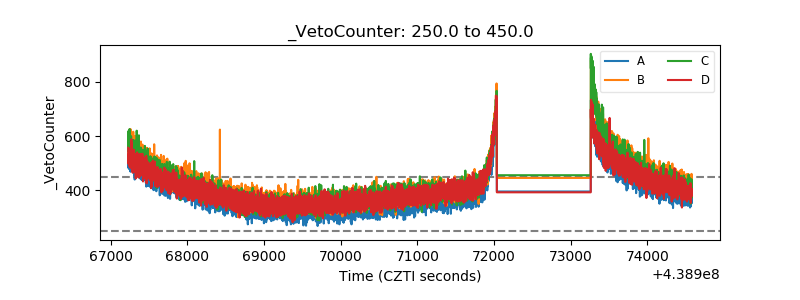 |