| Param | Original file | Final file |
|---|---|---|
| Filename | modeM0/AS1A13_074T12_9000005960_44184cztM0_level2.fits | modeM0/AS1A13_074T12_9000005960_44184cztM0_level2_quad_clean.evt |
| Size (bytes) | 665,049,600 | 99,864,000 |
| Size | 634.2 MB | 95.2 MB |
| Events in quadrant A | 6,109,339 | 723,219 |
| Events in quadrant B | 6,288,397 | 628,426 |
| Events in quadrant C | 3,553,899 | 726,999 |
| Events in quadrant D | 8,181,274 | 508,203 |
| Mode M9 | |||
|---|---|---|---|
| Quadrant | BADHDUFLAG | Total packets | Discarded packets |
| A | 0 | 13 | 0 |
| B | 0 | 14 | 0 |
| C | 0 | 14 | 0 |
| D | 0 | 14 | 0 |
| Mode M0 | |||
|---|---|---|---|
| Quadrant | BADHDUFLAG | Total packets | Discarded packets |
| A | 0 | 22872 | 2 |
| B | 0 | 22939 | 2 |
| C | 0 | 14891 | 2 |
| D | 0 | 28780 | 2 |
| Mode SS | |||
|---|---|---|---|
| Quadrant | BADHDUFLAG | Total packets | Discarded packets |
| A | 0 | 126 | 0 |
| B | 0 | 126 | 0 |
| C | 0 | 126 | 0 |
| D | 0 | 126 | 0 |
| Quadrant | Total seconds | Saturated seconds | Saturation percentage |
|---|---|---|---|
| A | 6265 | 420 | 6.703911% |
| B | 6265 | 1288 | 20.558659% |
| C | 6264 | 72 | 1.149425% |
| D | 6264 | 1639 | 26.165390% |
Noise dominated data is calculated using 1-second bins in cleaned event files. If a bin has >2000 counts, and if more than 50% of those come from <1% of pixels, then it is considered to be noise-dominated and hence unusable.
| Quadrant | # 1 sec bins | Bins with >0 counts | Bins with >2000 counts | High rate bins dominated by noise | Noise dominated (total time) | Noise dominated (detector-on time) | Marked lightcurve |
|---|---|---|---|---|---|---|---|
| A | 7510 | 6266 | 278 | 278 | 3.70% | 4.44% | 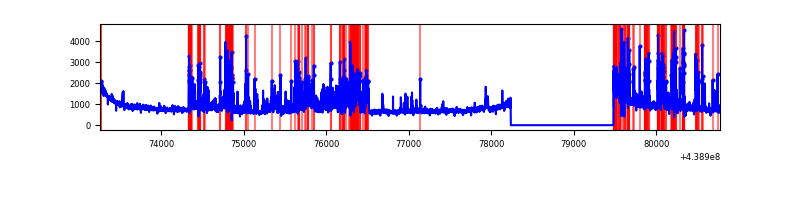 |
| B | 7510 | 6266 | 939 | 939 | 12.50% | 14.99% | 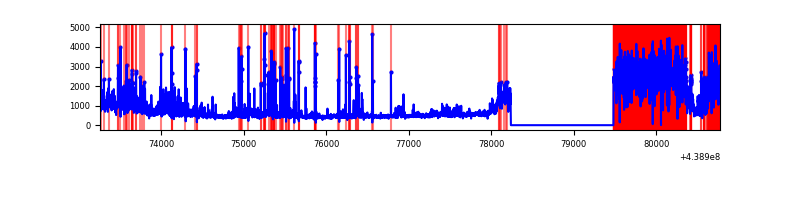 |
| C | 7509 | 6265 | 55 | 55 | 0.73% | 0.88% | 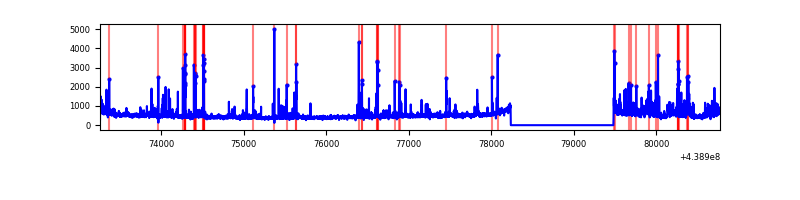 |
| D | 7509 | 6265 | 1533 | 1533 | 20.42% | 24.47% | 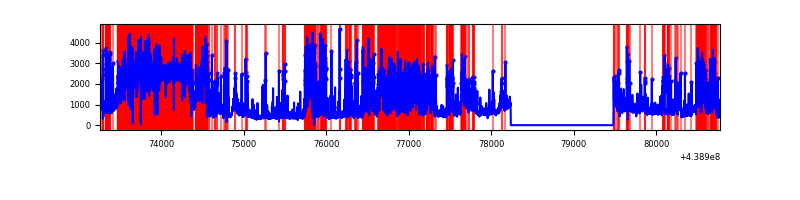 |
Top three noisy pixels from each quadrant. If the there are fewer than three noisy pixels in the level2.evt file, extra rows are filled as -1
| Pixel properties | Quadrant properties | ||||||
|---|---|---|---|---|---|---|---|
| Quadrant | DetID | PixID | Counts | Sigma | Mean | Median | Sigma |
| A | 10 | 83 | 1606551 | 10654.31 | 725 | 711 | 150.7 |
| A | 15 | 223 | 1597626 | 10595.1 | 725 | 711 | 150.7 |
| A | 7 | 3 | 36829 | 239.63 | 725 | 711 | 150.7 |
| B | 0 | 200 | 2741459 | 21472.76 | 660 | 643 | 127.6 |
| B | 0 | 219 | 515303 | 4032.07 | 660 | 643 | 127.6 |
| B | 5 | 172 | 90432 | 703.45 | 660 | 643 | 127.6 |
| C | 3 | 233 | 311723 | 1866.32 | 712 | 716 | 166.6 |
| C | 14 | 254 | 310335 | 1857.99 | 712 | 716 | 166.6 |
| C | 4 | 254 | 34971 | 205.56 | 712 | 716 | 166.6 |
| D | 13 | 168 | 2698016 | 16709.62 | 628 | 607 | 161.4 |
| D | 1 | 52 | 1014949 | 6283.54 | 628 | 607 | 161.4 |
| D | 12 | 233 | 603135 | 3732.48 | 628 | 607 | 161.4 |
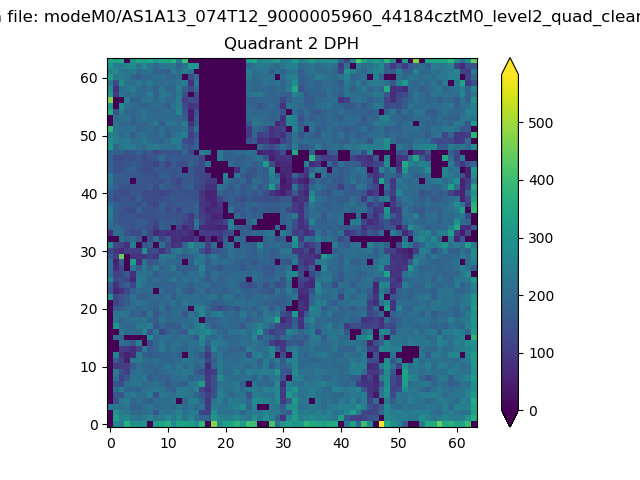
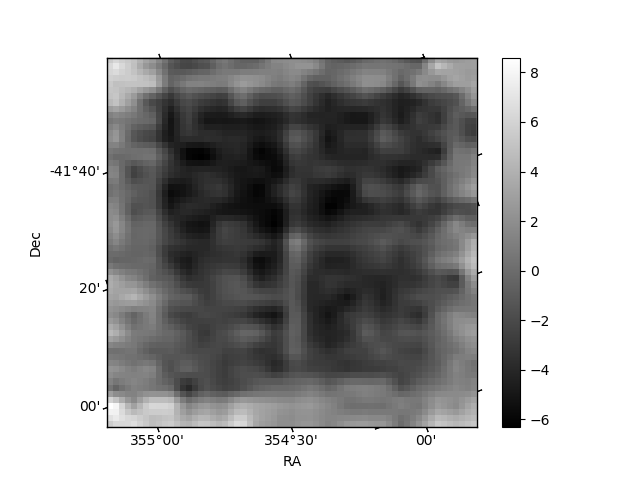
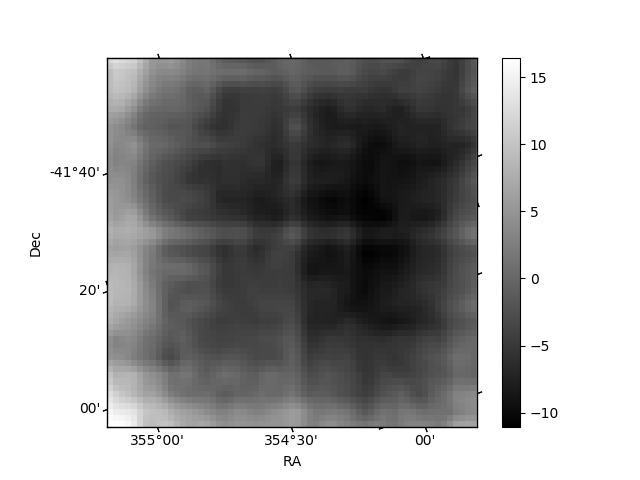
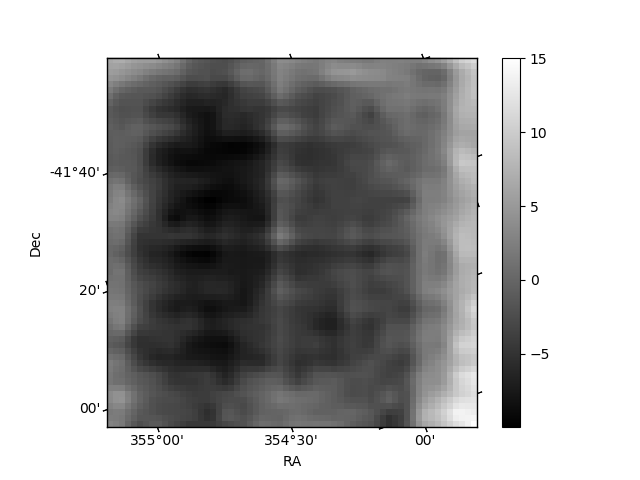
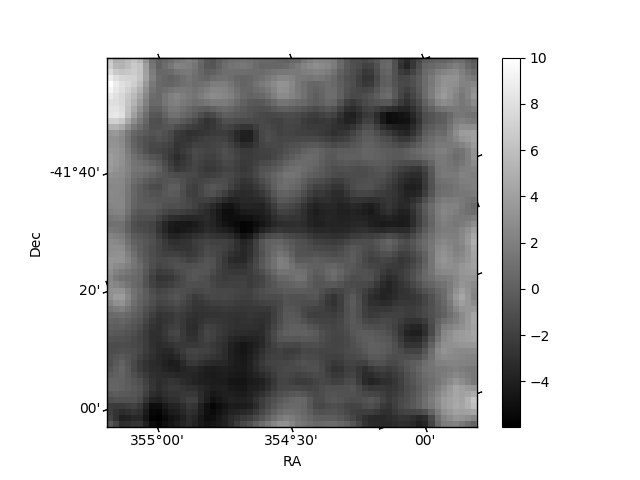
Histogram calculated using DETX and DETY for each event in the final _common_clean file
| Quadrant A | 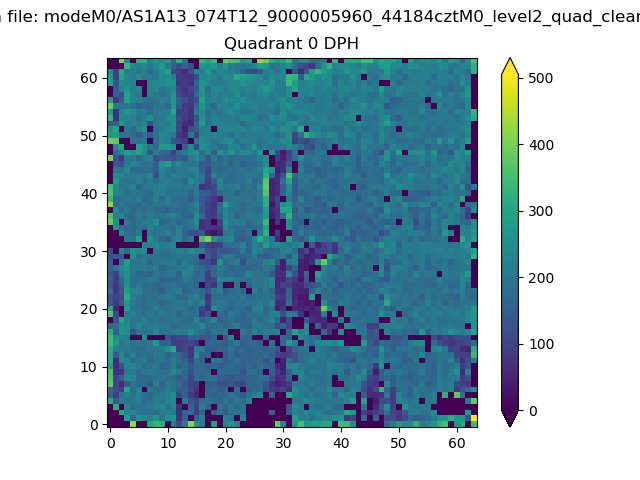 |
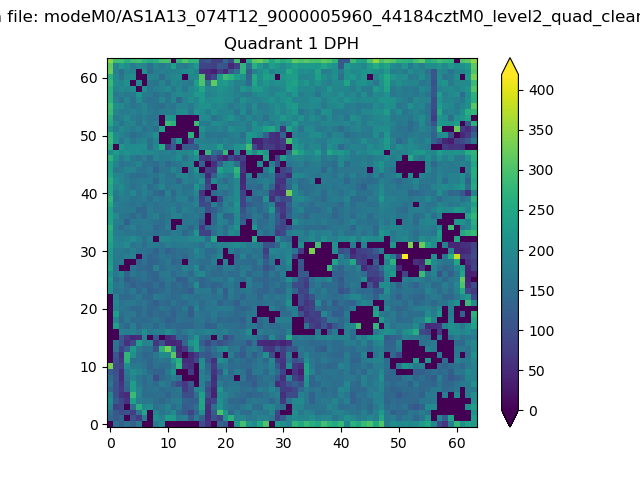 |
Quadrant B |
|---|---|---|---|
| Quadrant D | 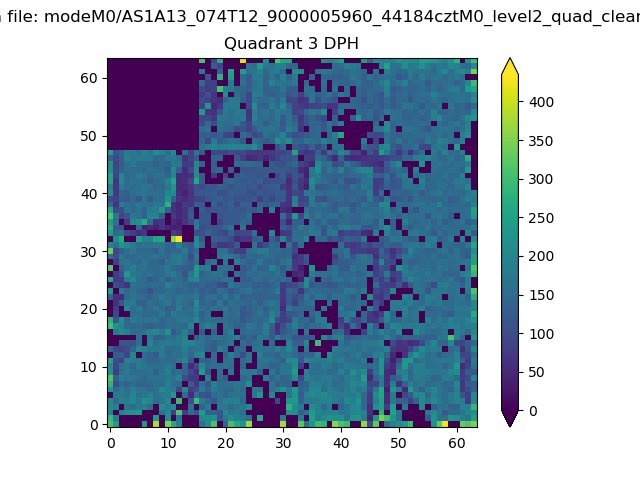 |
 |
Quadrant C |
| Plot type | Count rate plots | Images |
|---|---|---|
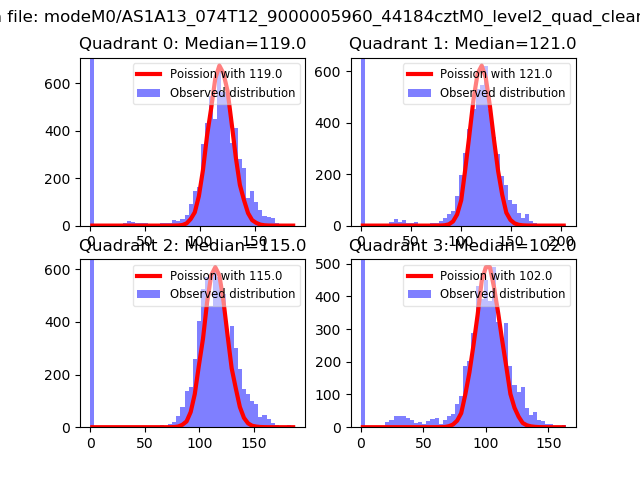
| Comparison with Poisson distribution Blue bars denote a histogram of data divided into 1 sec bins. Red curve is a Poisson curve with rate = median count rate of data. |
 |
 |
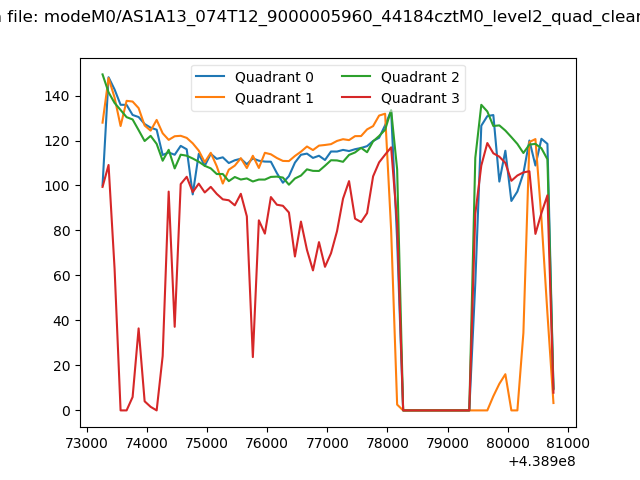
| Quadrant-wise count rates Data is divided into 100 sec bins |
 |
|
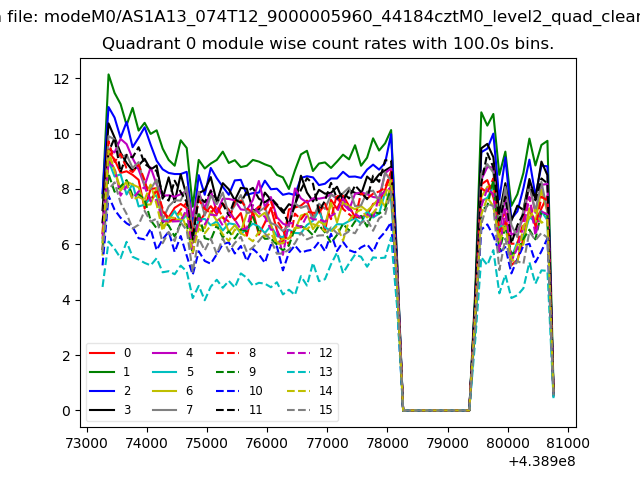
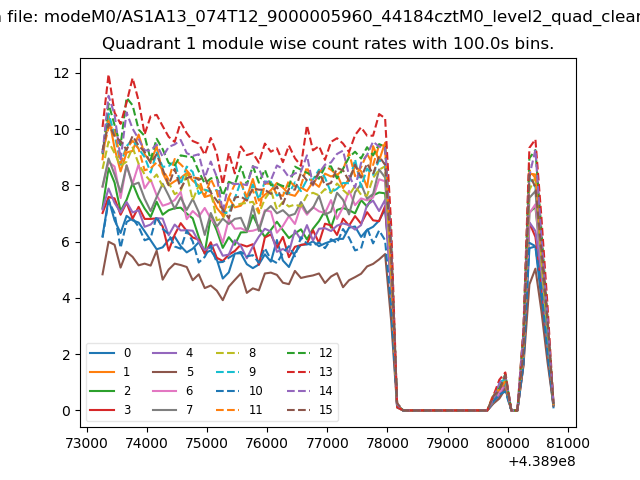
| Module-wise count rates for Quadrant A Data is divided into 100 sec bins |
 |
 |
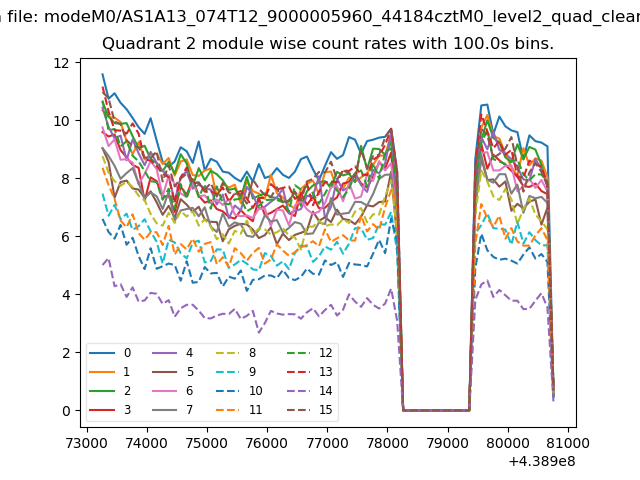
| Module-wise count rates for Quadrant B Data is divided into 100 sec bins |
 |
 |
| Module-wise count rates for Quadrant C Data is divided into 100 sec bins |
 |
 |
| Module-wise count rates for Quadrant D Data is divided into 100 sec bins |
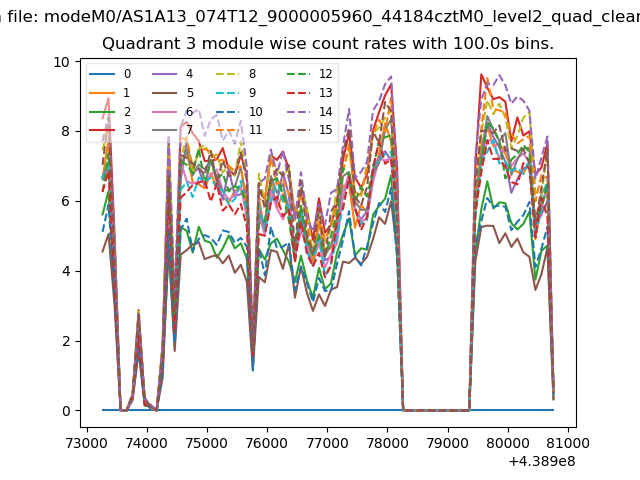 |
 |
| Parameter | Plot |
|---|---|
| CZT HV Monitor | 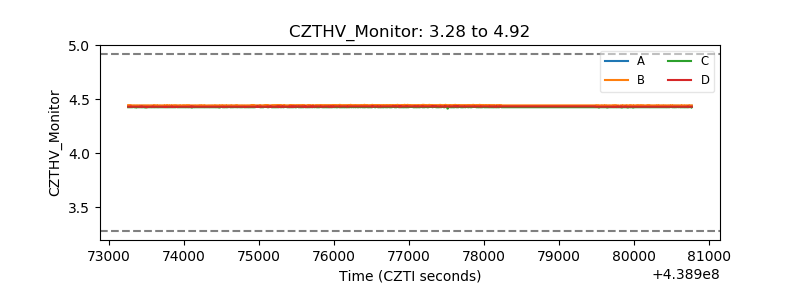 |
| D_VDD | 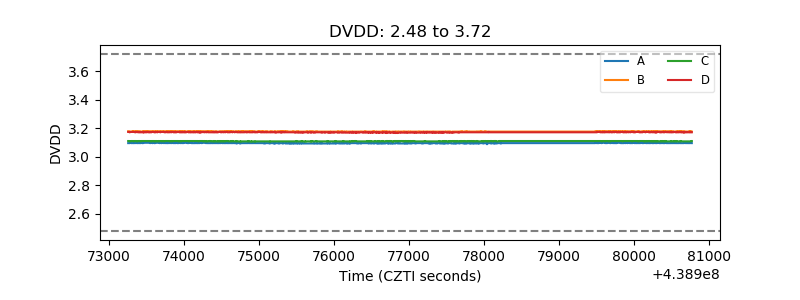 |
| Temperature 1 | 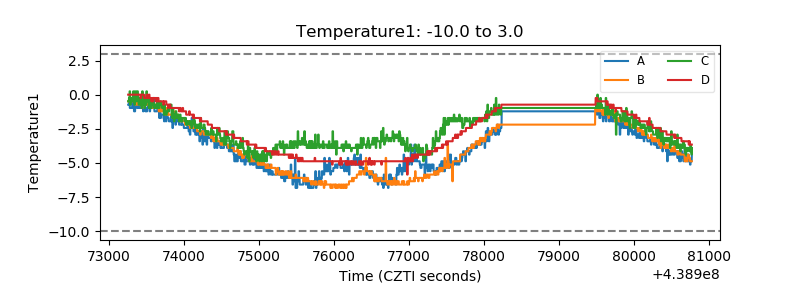 |
| Veto HV Monitor | 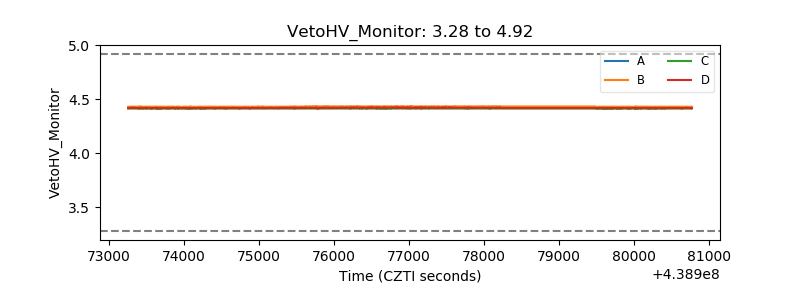 |
| Veto LLD | 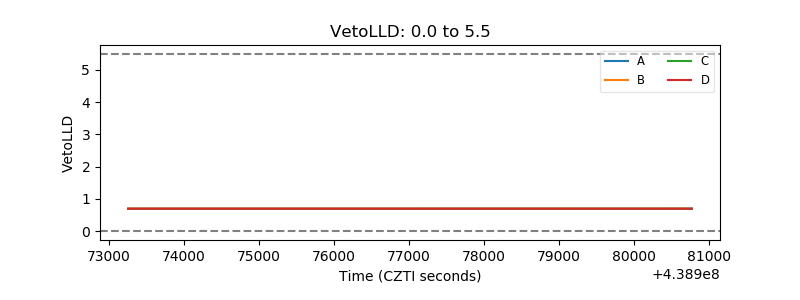 |
| Alpha Counter | 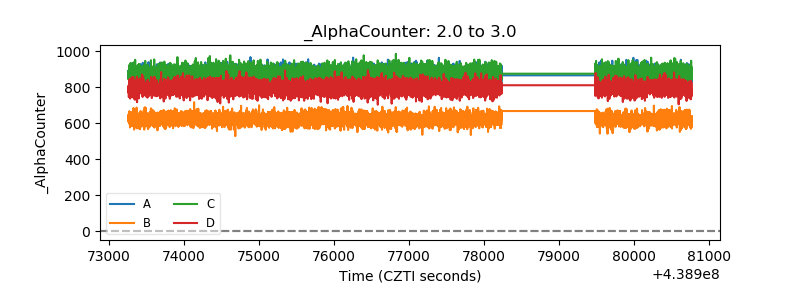 |
| _CPM_Rate | 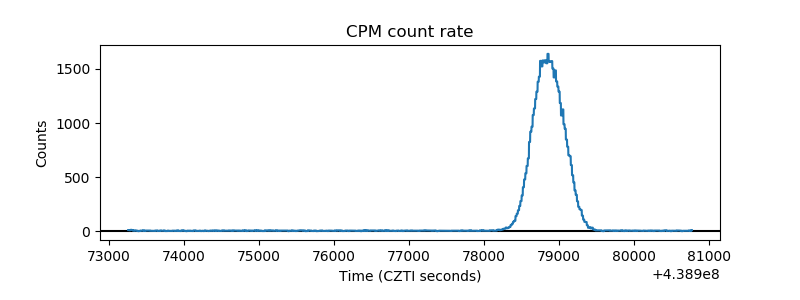 |
| CZT Counter | 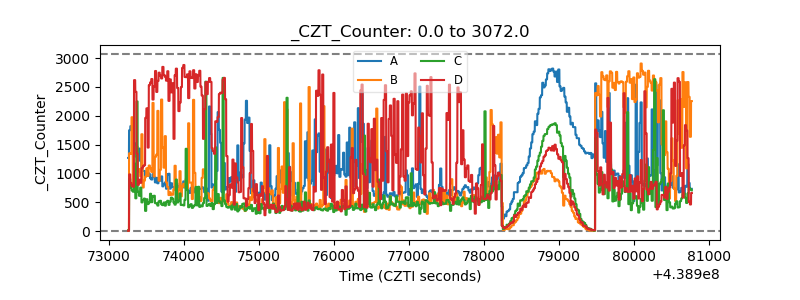 |
| +2.5 Volts monitor | 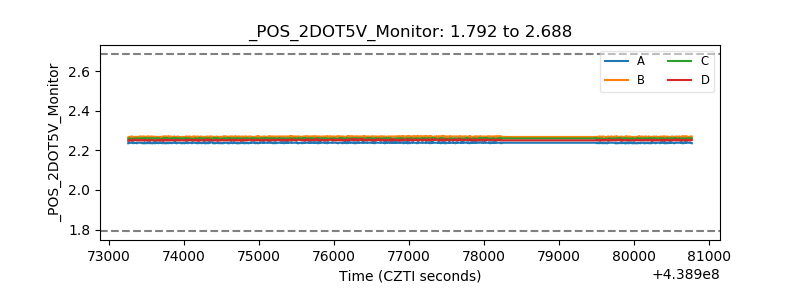 |
| +5 Volts monitor | 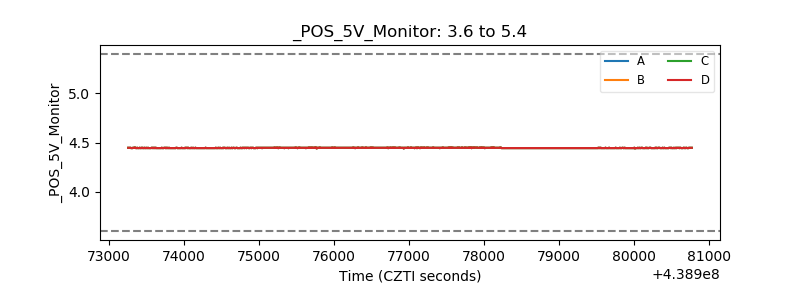 |
| _ROLL_ROT | 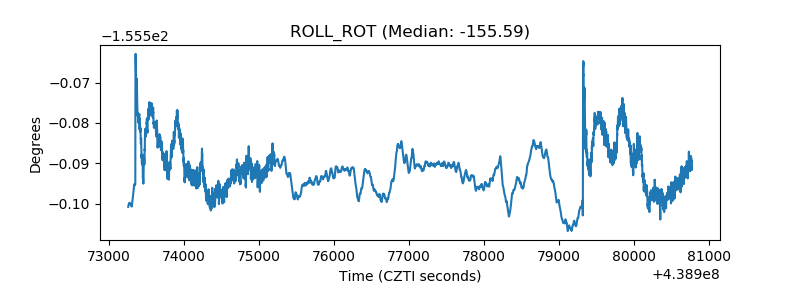 |
| _Roll_DEC | 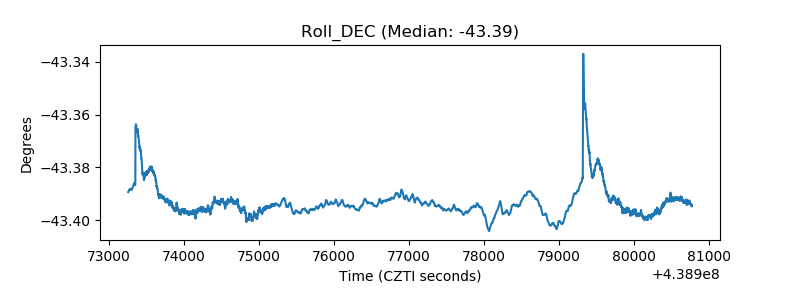 |
| _Roll_RA | 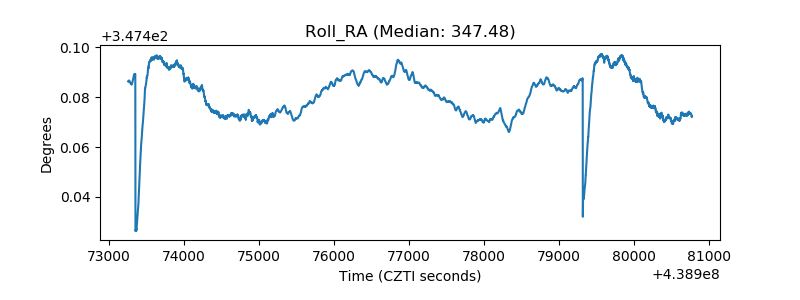 |
| Veto Counter | 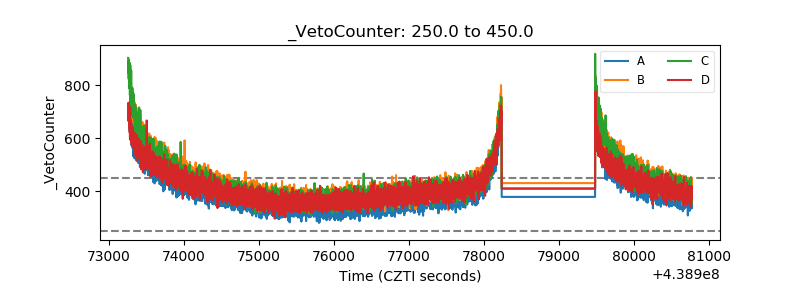 |