| Param | Original file | Final file |
|---|---|---|
| Filename | modeM0/AS1A13_074T12_9000005960_44185cztM0_level2.fits | modeM0/AS1A13_074T12_9000005960_44185cztM0_level2_quad_clean.evt |
| Size (bytes) | 250,963,200 | 29,473,920 |
| Size | 239.3 MB | 28.1 MB |
| Events in quadrant A | 2,103,290 | 220,309 |
| Events in quadrant B | 3,587,776 | 103,231 |
| Events in quadrant C | 1,313,958 | 230,817 |
| Events in quadrant D | 2,132,999 | 197,733 |
| Mode M9 | |||
|---|---|---|---|
| Quadrant | BADHDUFLAG | Total packets | Discarded packets |
| A | 0 | 3 | 0 |
| B | 0 | 4 | 0 |
| C | 0 | 4 | 0 |
| D | 0 | 4 | 0 |
| Mode M0 | |||
|---|---|---|---|
| Quadrant | BADHDUFLAG | Total packets | Discarded packets |
| A | 0 | 7651 | 1 |
| B | 0 | 11997 | 1 |
| C | 0 | 5239 | 1 |
| D | 0 | 7711 | 1 |
| Mode SS | |||
|---|---|---|---|
| Quadrant | BADHDUFLAG | Total packets | Discarded packets |
| A | 0 | 38 | 0 |
| B | 0 | 38 | 0 |
| C | 0 | 38 | 0 |
| D | 0 | 38 | 0 |
| Quadrant | Total seconds | Saturated seconds | Saturation percentage |
|---|---|---|---|
| A | 1930 | 219 | 11.347150% |
| B | 1930 | 1135 | 58.808290% |
| C | 1930 | 35 | 1.813472% |
| D | 1930 | 180 | 9.326425% |
Noise dominated data is calculated using 1-second bins in cleaned event files. If a bin has >2000 counts, and if more than 50% of those come from <1% of pixels, then it is considered to be noise-dominated and hence unusable.
| Quadrant | # 1 sec bins | Bins with >0 counts | Bins with >2000 counts | High rate bins dominated by noise | Noise dominated (total time) | Noise dominated (detector-on time) | Marked lightcurve |
|---|---|---|---|---|---|---|---|
| A | 1930 | 1930 | 156 | 156 | 8.08% | 8.08% | 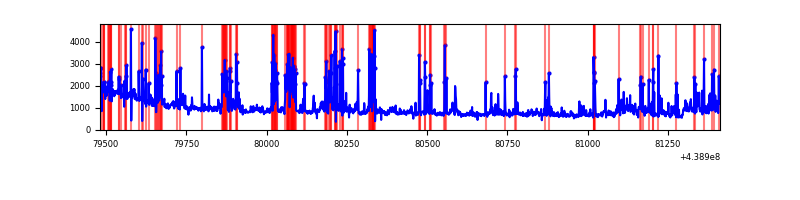 |
| B | 1930 | 1930 | 990 | 990 | 51.30% | 51.30% | 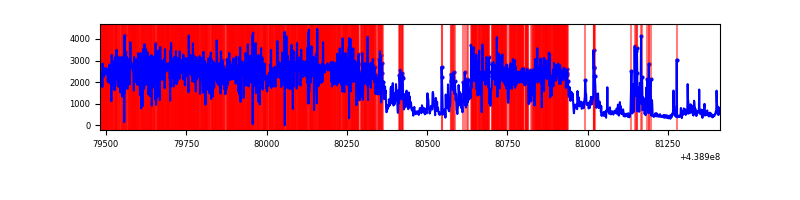 |
| C | 1930 | 1930 | 33 | 33 | 1.71% | 1.71% | 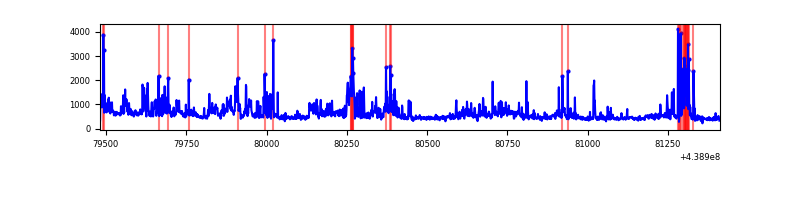 |
| D | 1930 | 1930 | 212 | 212 | 10.98% | 10.98% | 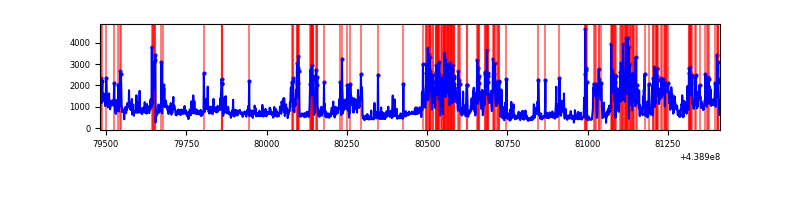 |
Top three noisy pixels from each quadrant. If the there are fewer than three noisy pixels in the level2.evt file, extra rows are filled as -1
| Pixel properties | Quadrant properties | ||||||
|---|---|---|---|---|---|---|---|
| Quadrant | DetID | PixID | Counts | Sigma | Mean | Median | Sigma |
| A | 15 | 223 | 650634 | 14230.85 | 214 | 211 | 45.7 |
| A | 10 | 83 | 581411 | 12716.3 | 214 | 211 | 45.7 |
| A | 13 | 248 | 11259 | 241.72 | 214 | 211 | 45.7 |
| B | 0 | 200 | 2620983 | 83953.76 | 152 | 149 | 31.2 |
| B | 5 | 235 | 108403 | 3467.72 | 152 | 149 | 31.2 |
| B | 0 | 219 | 106489 | 3406.41 | 152 | 149 | 31.2 |
| C | 3 | 233 | 287913 | 5608.89 | 212 | 213 | 51.3 |
| C | 14 | 254 | 145993 | 2842.07 | 212 | 213 | 51.3 |
| C | 2 | 14 | 10586 | 202.23 | 212 | 213 | 51.3 |
| D | 1 | 52 | 518900 | 9814.41 | 204 | 196 | 52.9 |
| D | 12 | 233 | 308860 | 5840.24 | 204 | 196 | 52.9 |
| D | 1 | 47 | 111901 | 2113.57 | 204 | 196 | 52.9 |
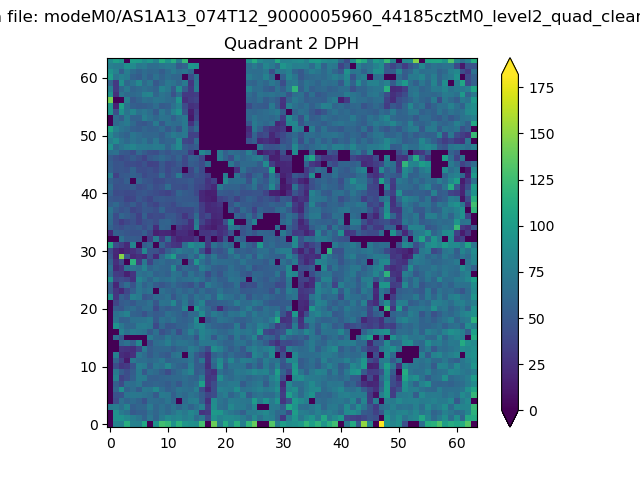
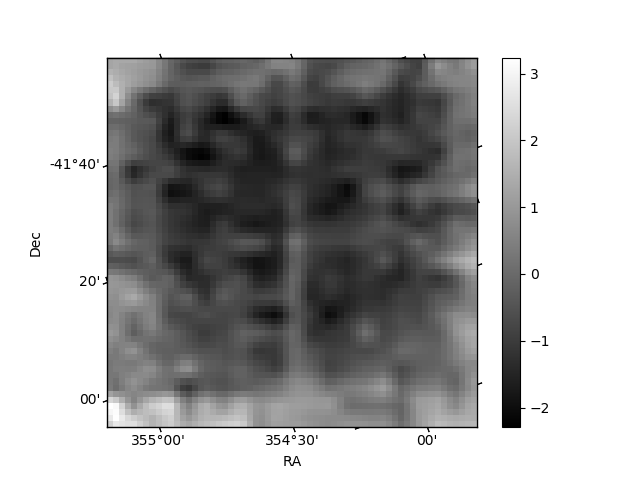
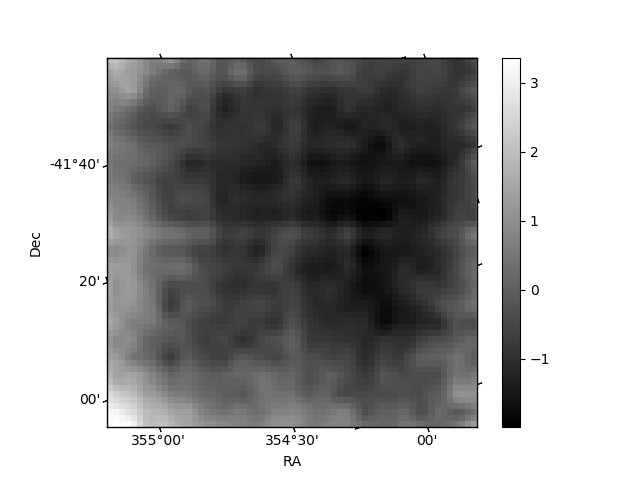
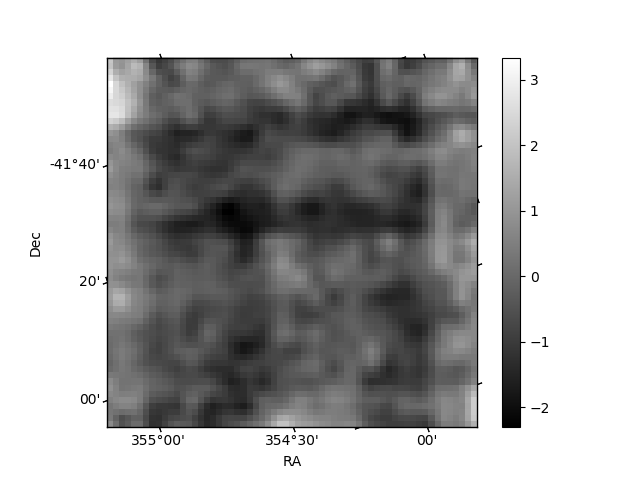
Histogram calculated using DETX and DETY for each event in the final _common_clean file
| Quadrant A | 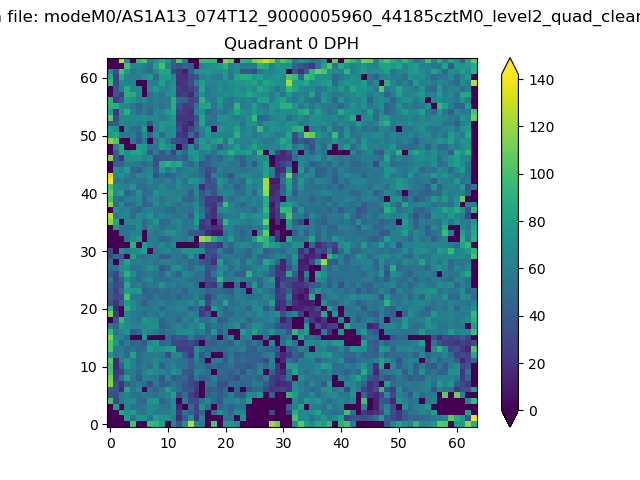 |
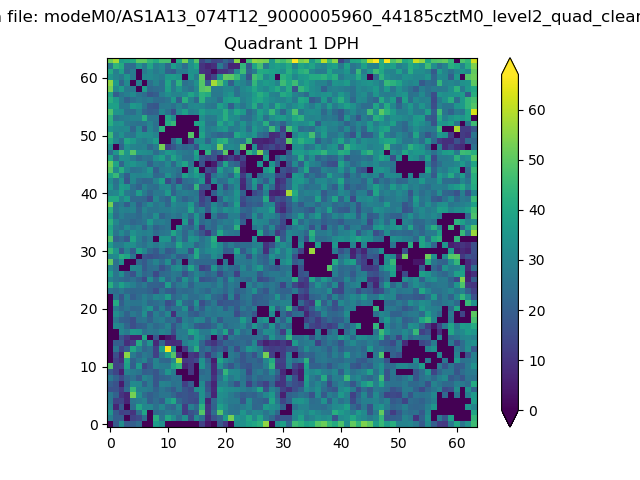 |
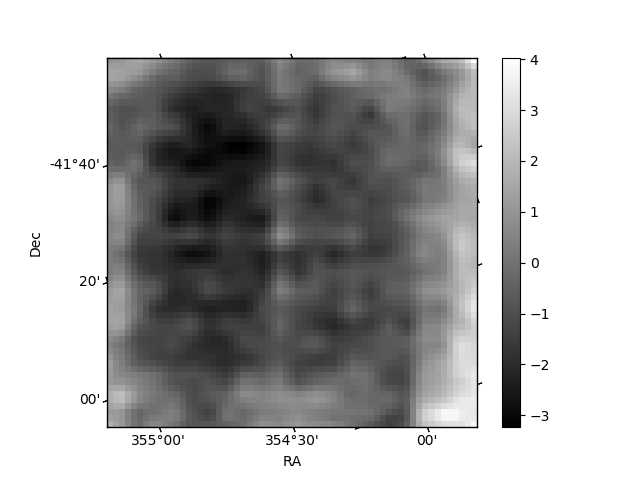
Quadrant B |
|---|---|---|---|
| Quadrant D | 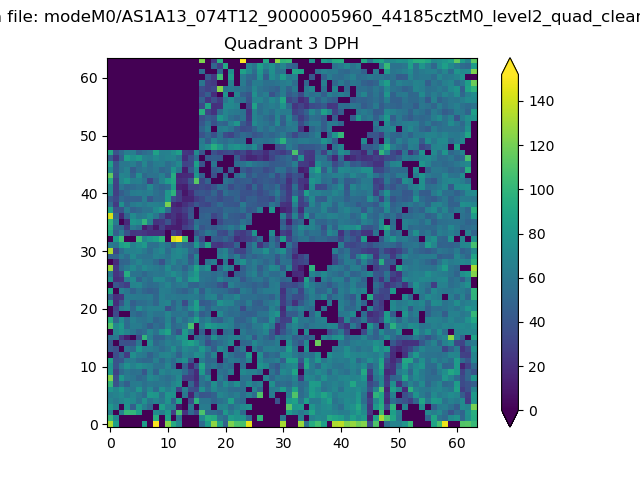 |
 |
Quadrant C |
| Plot type | Count rate plots | Images |
|---|---|---|
| Comparison with Poisson distribution Blue bars denote a histogram of data divided into 1 sec bins. Red curve is a Poisson curve with rate = median count rate of data. |
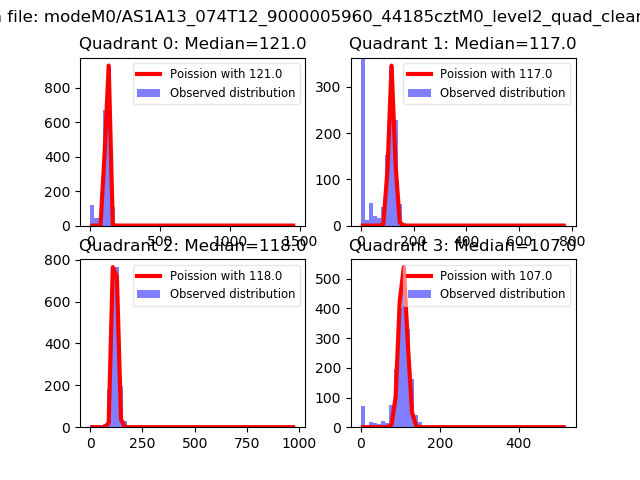 |
 |
| Quadrant-wise count rates Data is divided into 100 sec bins |
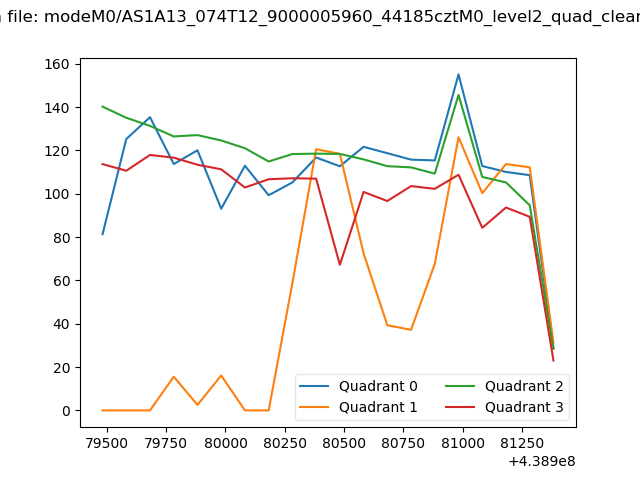 |
|
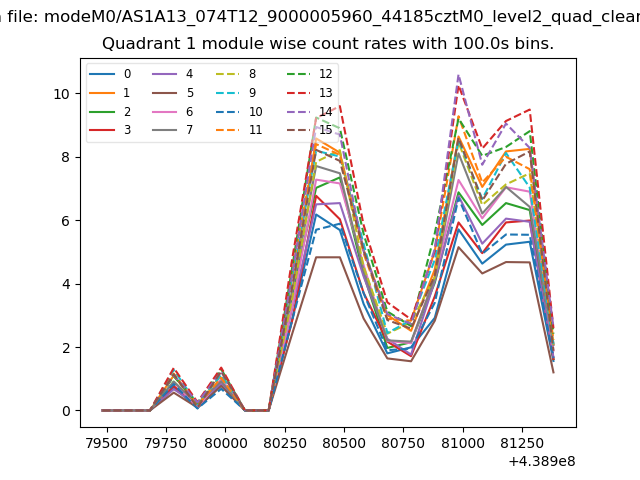
| Module-wise count rates for Quadrant A Data is divided into 100 sec bins |
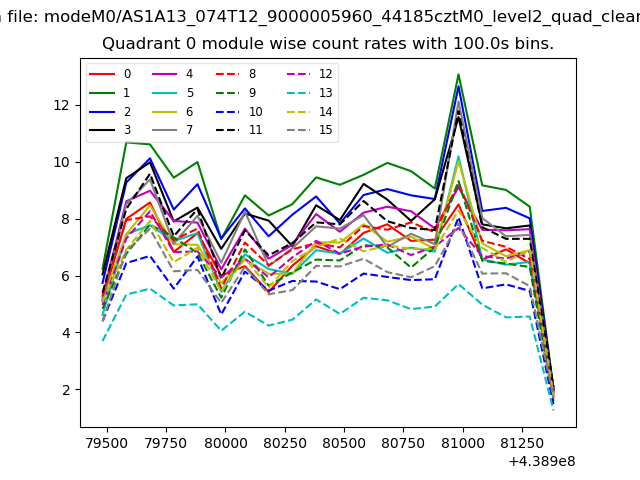 |
 |
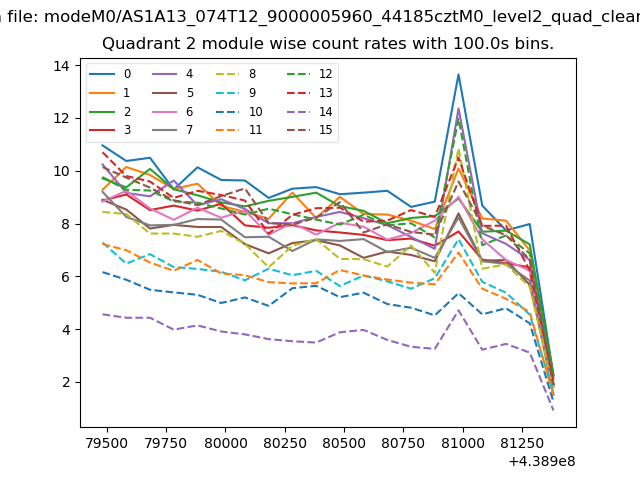
| Module-wise count rates for Quadrant B Data is divided into 100 sec bins |
 |
 |
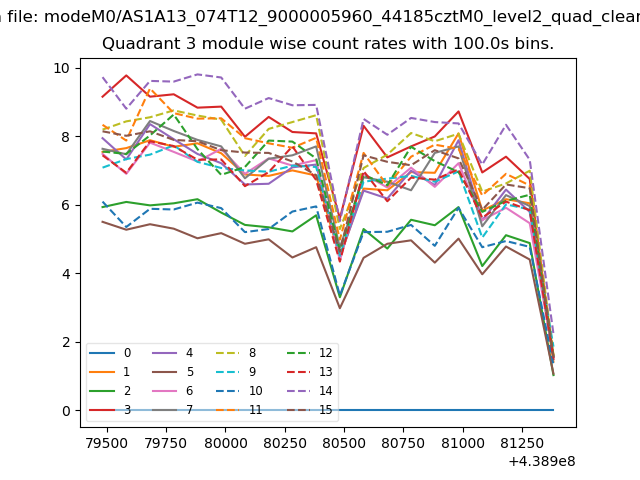
| Module-wise count rates for Quadrant C Data is divided into 100 sec bins |
 |
 |
| Module-wise count rates for Quadrant D Data is divided into 100 sec bins |
 |
 |
| Parameter | Plot |
|---|---|
| CZT HV Monitor | 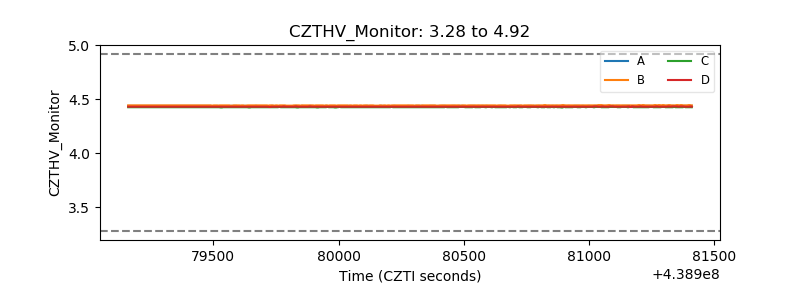 |
| D_VDD | 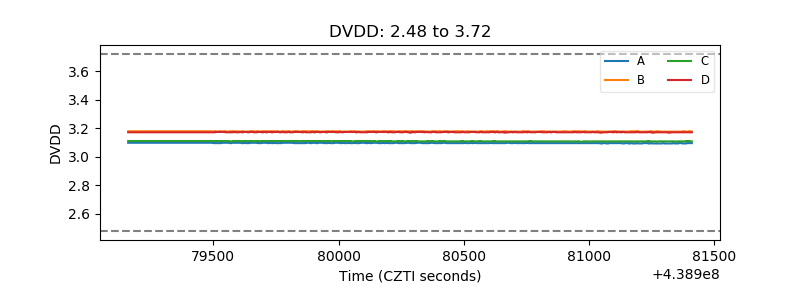 |
| Temperature 1 | 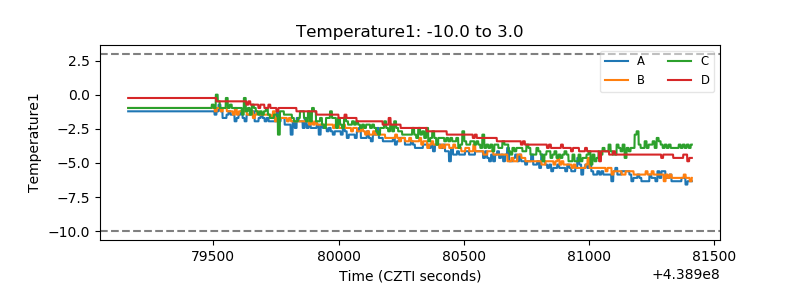 |
| Veto HV Monitor |  |
| Veto LLD | 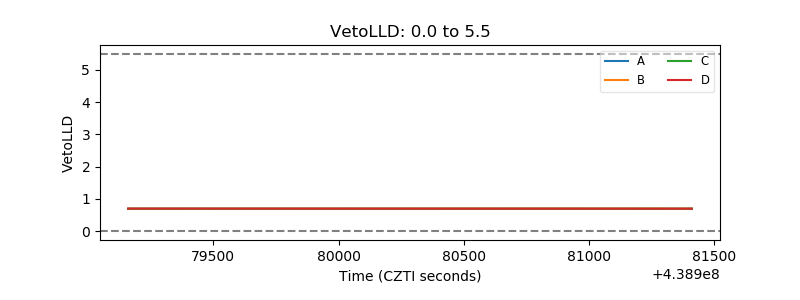 |
| Alpha Counter | 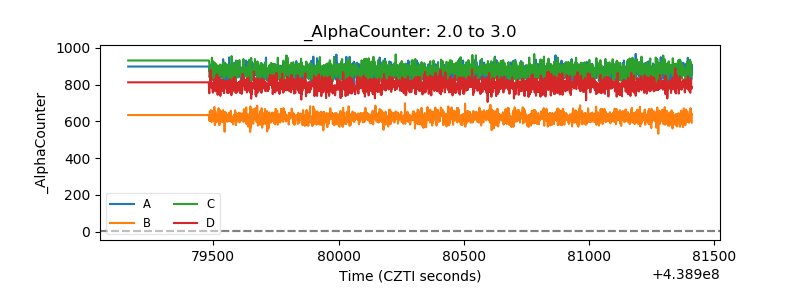 |
| _CPM_Rate | 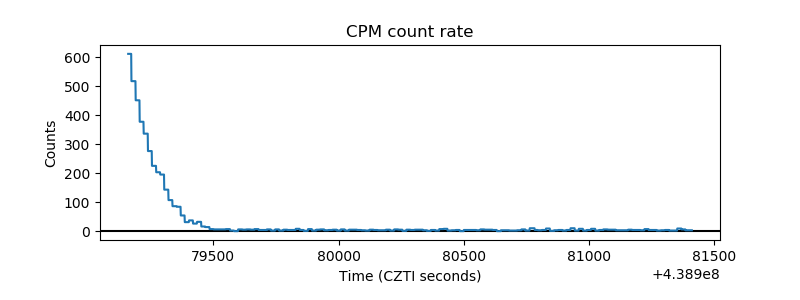 |
| CZT Counter | 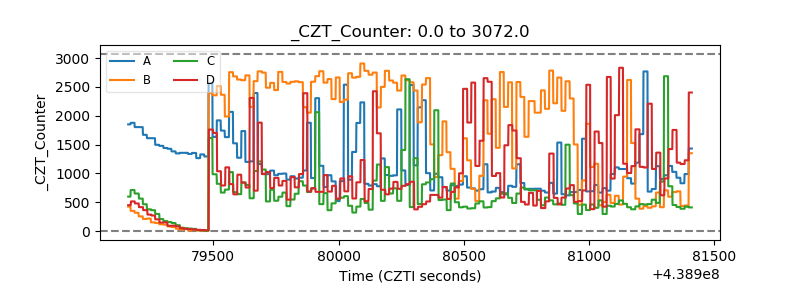 |
| +2.5 Volts monitor | 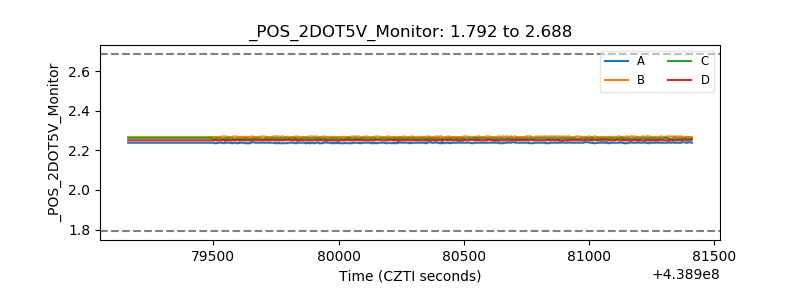 |
| +5 Volts monitor | 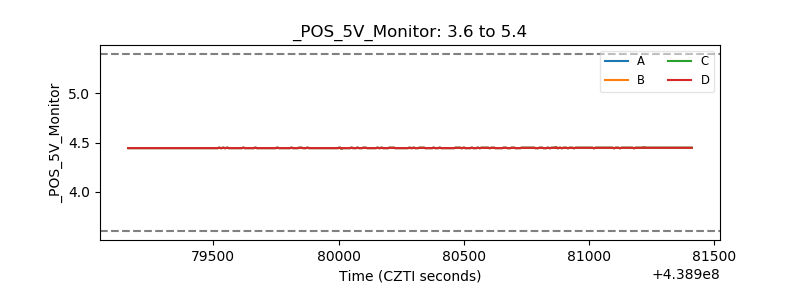 |
| _ROLL_ROT | 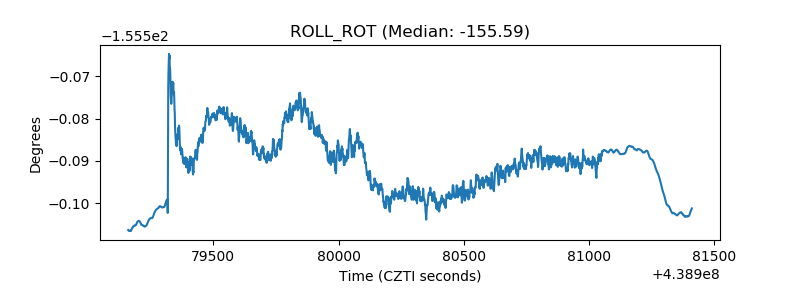 |
| _Roll_DEC | 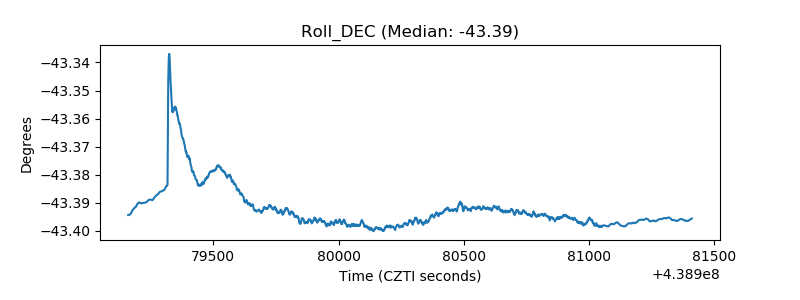 |
| _Roll_RA |  |
| Veto Counter | 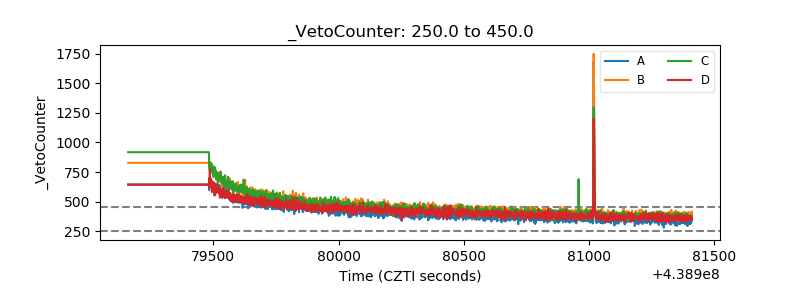 |