| Param | Original file | Final file |
|---|---|---|
| Filename | modeM0/AS1A13_073T04_9000005964_44190cztM0_level2.fits | modeM0/AS1A13_073T04_9000005964_44190cztM0_level2_quad_clean.evt |
| Size (bytes) | 539,628,480 | 121,518,720 |
| Size | 514.6 MB | 115.9 MB |
| Events in quadrant A | 5,723,482 | 785,180 |
| Events in quadrant B | 4,743,314 | 812,141 |
| Events in quadrant C | 3,596,592 | 814,589 |
| Events in quadrant D | 5,307,054 | 725,630 |
| Mode M0 | |||
|---|---|---|---|
| Quadrant | BADHDUFLAG | Total packets | Discarded packets |
| A | 0 | 22826 | 0 |
| B | 0 | 19389 | 0 |
| C | 0 | 16342 | 0 |
| D | 0 | 21277 | 0 |
| Mode SS | |||
|---|---|---|---|
| Quadrant | BADHDUFLAG | Total packets | Discarded packets |
| A | 0 | 156 | 0 |
| B | 0 | 156 | 0 |
| C | 0 | 156 | 0 |
| D | 0 | 156 | 0 |
| Quadrant | Total seconds | Saturated seconds | Saturation percentage |
|---|---|---|---|
| A | 7791 | 388 | 4.980105% |
| B | 7792 | 352 | 4.517454% |
| C | 7792 | 11 | 0.141170% |
| D | 7792 | 315 | 4.042608% |
Noise dominated data is calculated using 1-second bins in cleaned event files. If a bin has >2000 counts, and if more than 50% of those come from <1% of pixels, then it is considered to be noise-dominated and hence unusable.
| Quadrant | # 1 sec bins | Bins with >0 counts | Bins with >2000 counts | High rate bins dominated by noise | Noise dominated (total time) | Noise dominated (detector-on time) | Marked lightcurve |
|---|---|---|---|---|---|---|---|
| A | 7791 | 7791 | 283 | 283 | 3.63% | 3.63% | 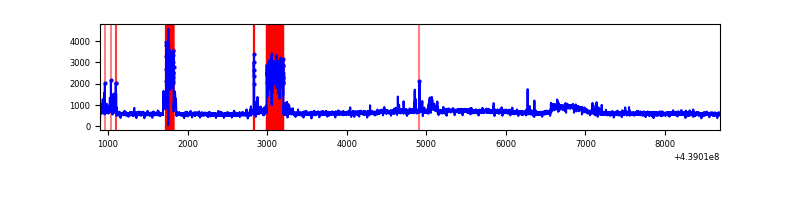 |
| B | 7792 | 7792 | 153 | 153 | 1.96% | 1.96% | 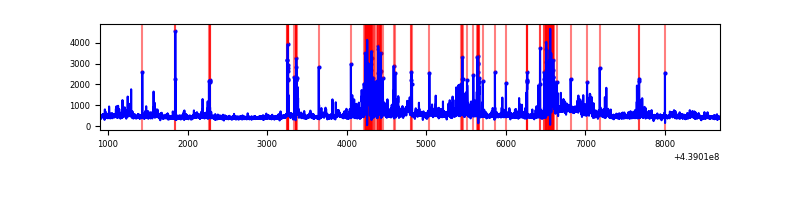 |
| C | 7792 | 7792 | 2 | 2 | 0.03% | 0.03% | 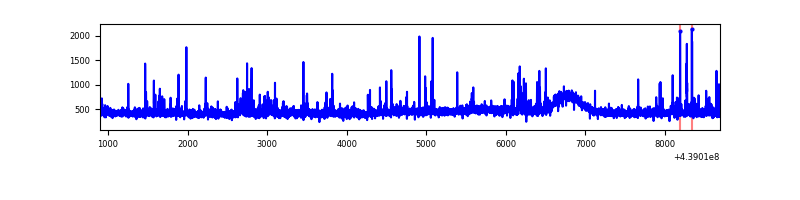 |
| D | 7792 | 7792 | 254 | 254 | 3.26% | 3.26% | 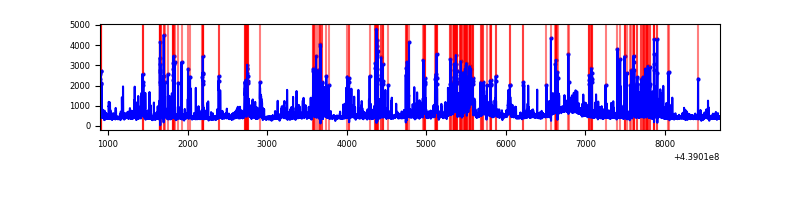 |
Top three noisy pixels from each quadrant. If the there are fewer than three noisy pixels in the level2.evt file, extra rows are filled as -1
| Pixel properties | Quadrant properties | ||||||
|---|---|---|---|---|---|---|---|
| Quadrant | DetID | PixID | Counts | Sigma | Mean | Median | Sigma |
| A | 10 | 83 | 1442813 | 8115.06 | 851 | 830 | 177.7 |
| A | 15 | 223 | 971448 | 5462.36 | 851 | 830 | 177.7 |
| A | 15 | 174 | 10542 | 54.66 | 851 | 830 | 177.7 |
| B | 5 | 172 | 545572 | 3239.15 | 852 | 824 | 168.2 |
| B | 0 | 219 | 145931 | 862.82 | 852 | 824 | 168.2 |
| B | 5 | 235 | 139889 | 826.9 | 852 | 824 | 168.2 |
| C | 14 | 254 | 114549 | 559.48 | 855 | 860 | 203.2 |
| C | 3 | 233 | 81088 | 394.81 | 855 | 860 | 203.2 |
| C | 2 | 14 | 29988 | 143.34 | 855 | 860 | 203.2 |
| D | 1 | 52 | 733520 | 3462.98 | 837 | 811 | 211.6 |
| D | 13 | 249 | 486520 | 2295.59 | 837 | 811 | 211.6 |
| D | 2 | 249 | 361070 | 1702.68 | 837 | 811 | 211.6 |
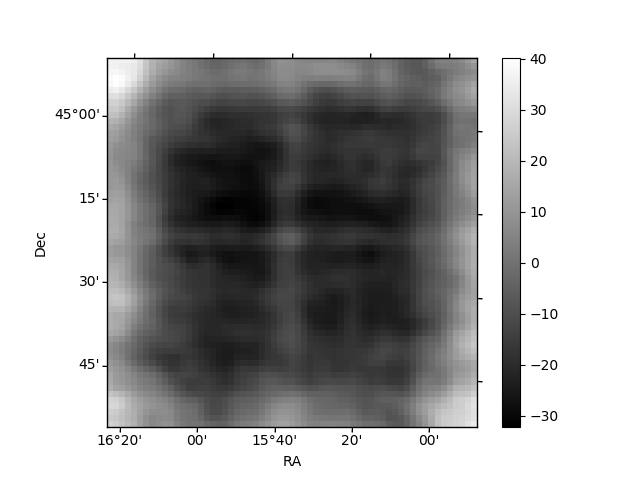
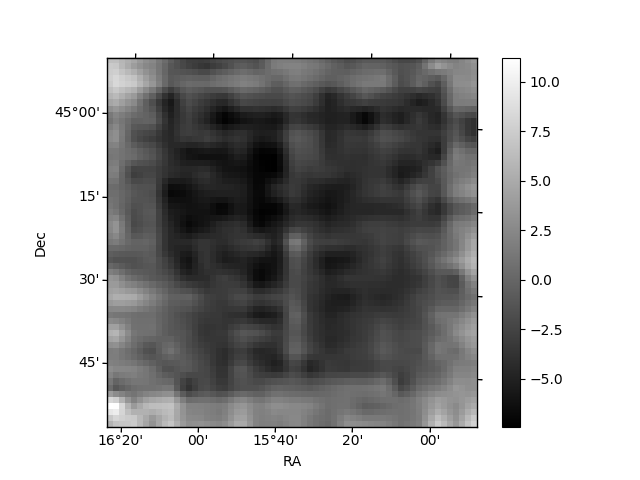
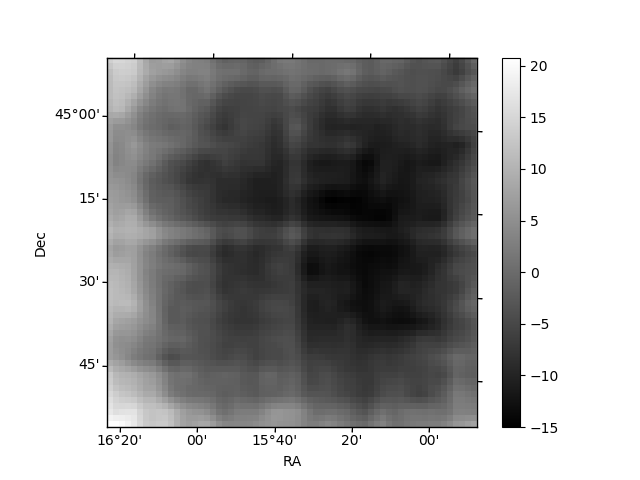
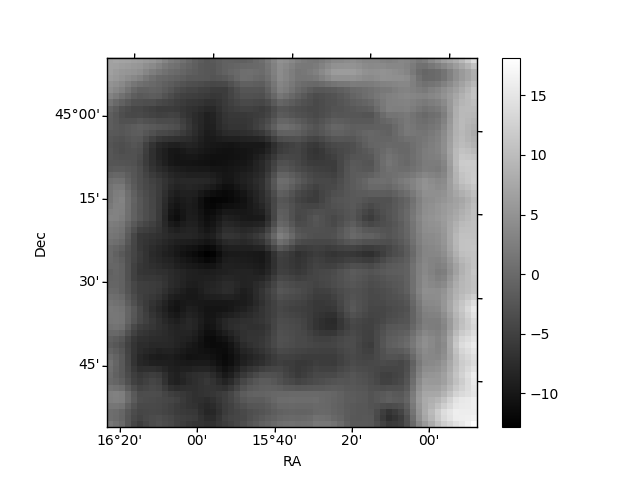
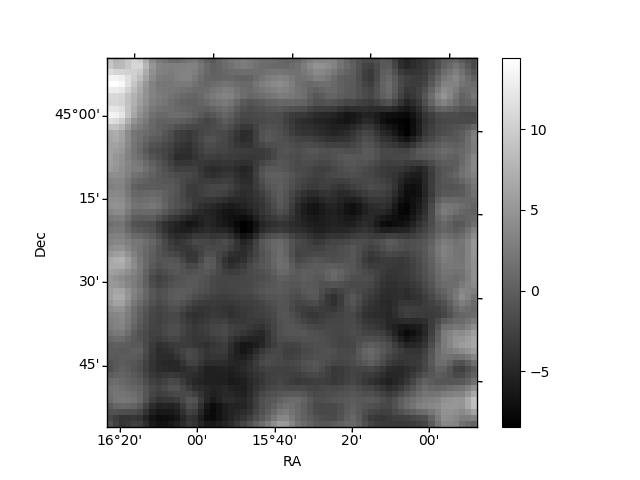
Histogram calculated using DETX and DETY for each event in the final _common_clean file
| Quadrant A | 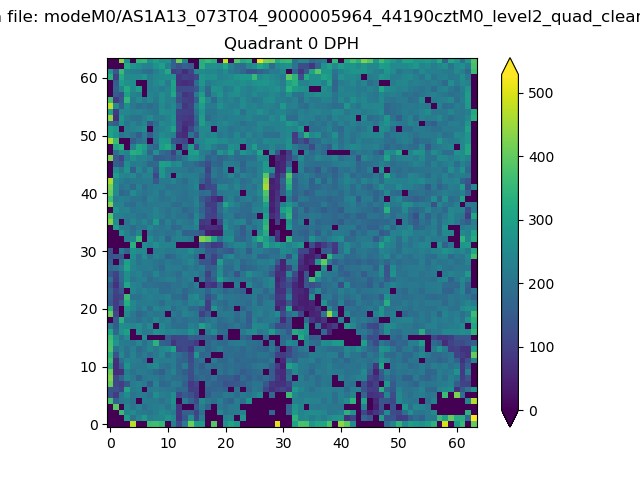 |
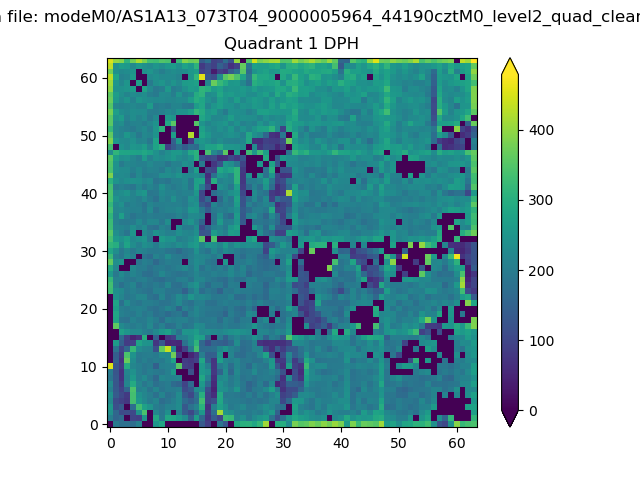 |
Quadrant B |
|---|---|---|---|
| Quadrant D | 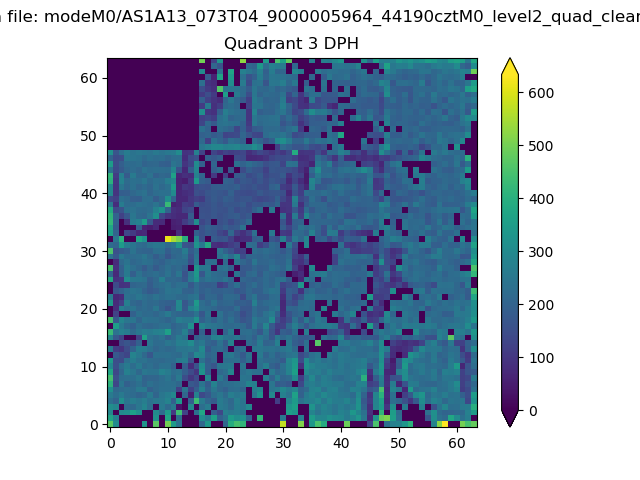 |
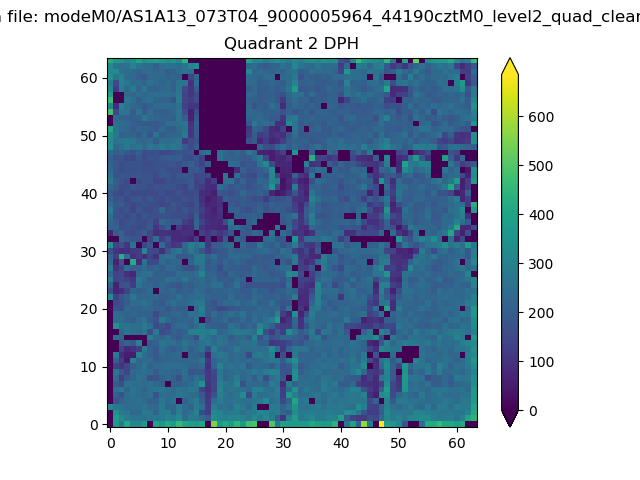 |
Quadrant C |
| Plot type | Count rate plots | Images |
|---|---|---|
| Comparison with Poisson distribution Blue bars denote a histogram of data divided into 1 sec bins. Red curve is a Poisson curve with rate = median count rate of data. |
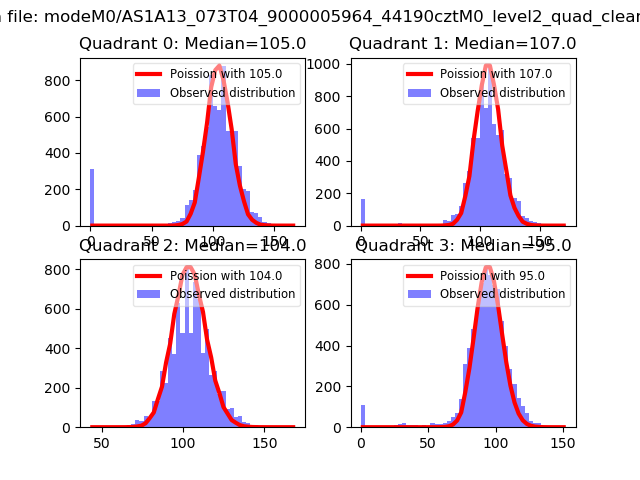 |
 |
| Quadrant-wise count rates Data is divided into 100 sec bins |
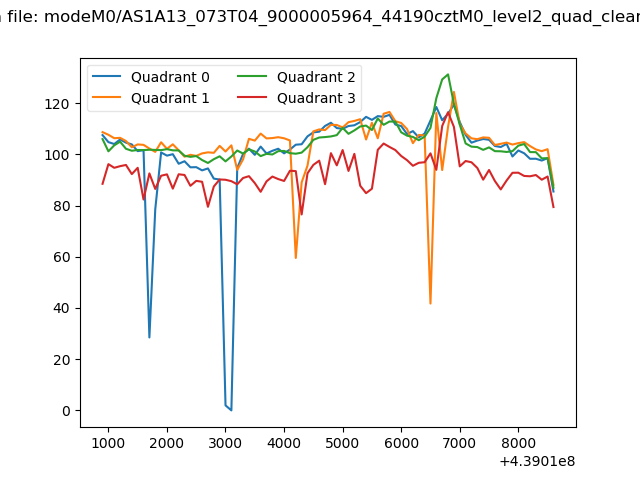 |
|
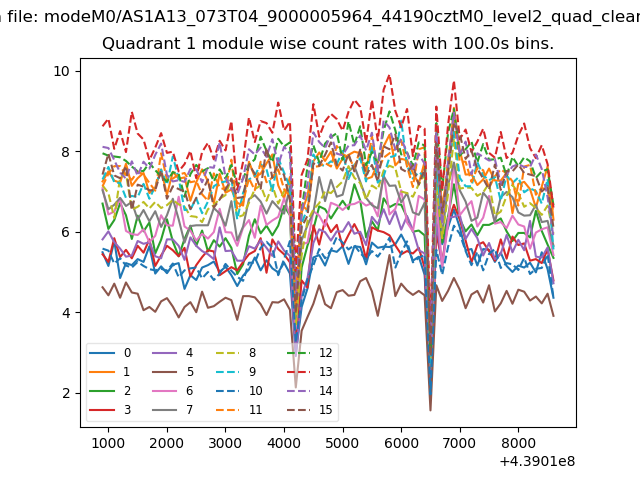
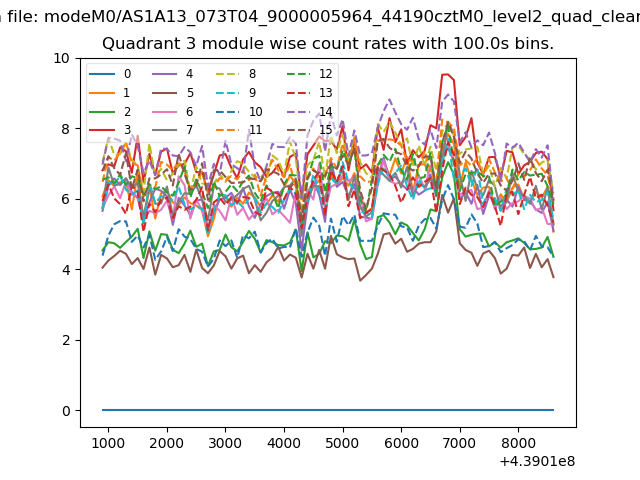
| Module-wise count rates for Quadrant A Data is divided into 100 sec bins |
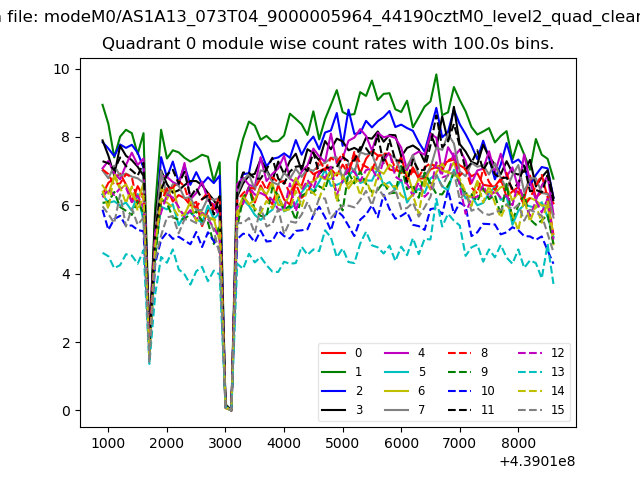 |
 |
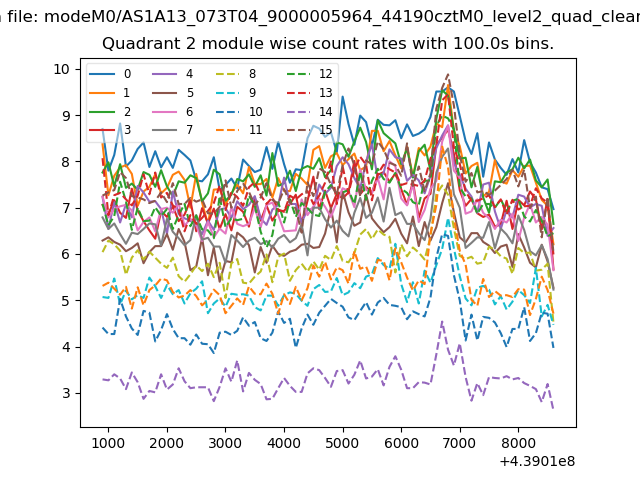
| Module-wise count rates for Quadrant B Data is divided into 100 sec bins |
 |
 |
| Module-wise count rates for Quadrant C Data is divided into 100 sec bins |
 |
 |
| Module-wise count rates for Quadrant D Data is divided into 100 sec bins |
 |
 |
| Parameter | Plot |
|---|---|
| CZT HV Monitor | 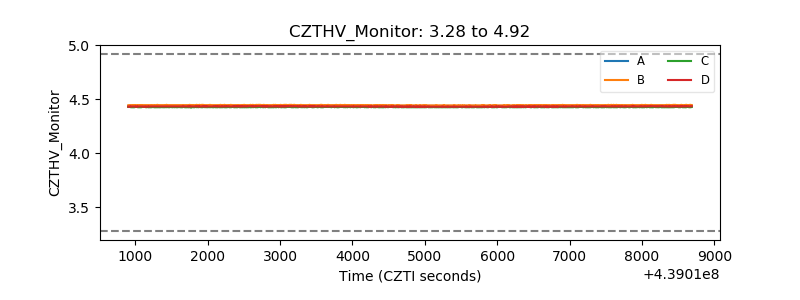 |
| D_VDD | 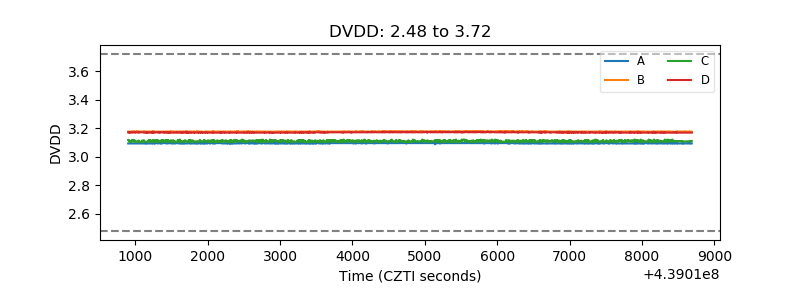 |
| Temperature 1 | 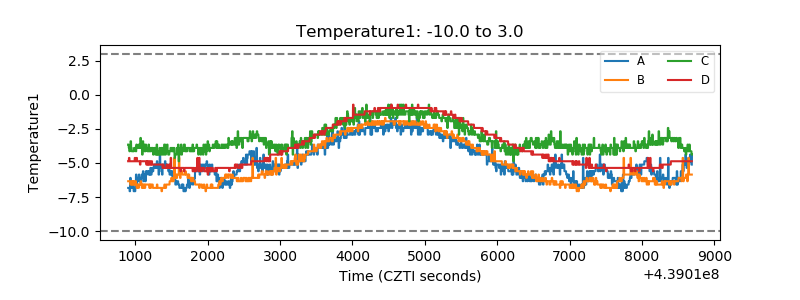 |
| Veto HV Monitor | 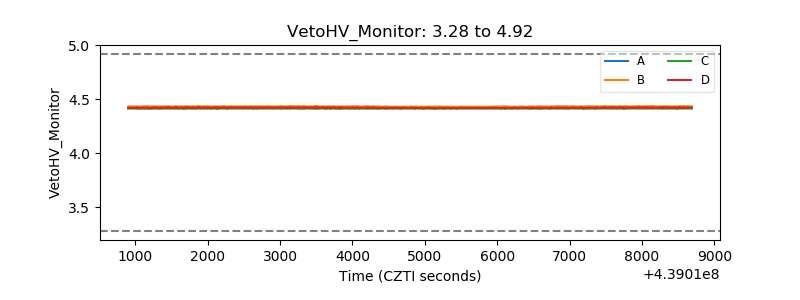 |
| Veto LLD | 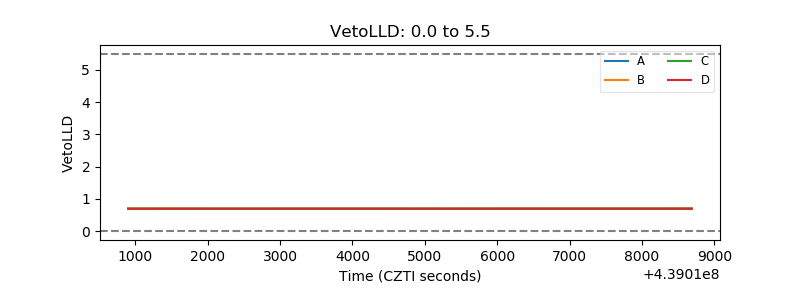 |
| Alpha Counter | 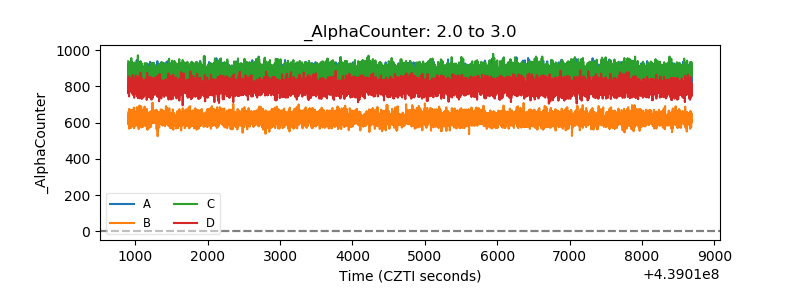 |
| _CPM_Rate | 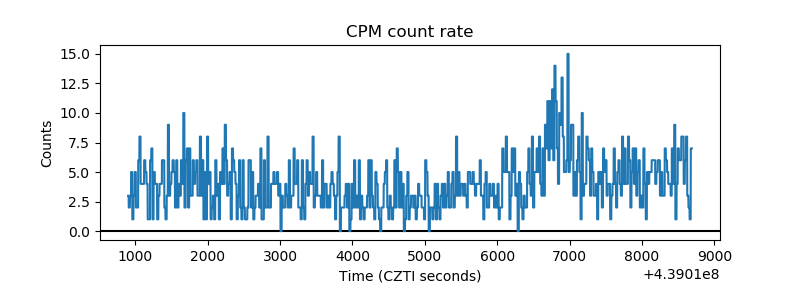 |
| CZT Counter | 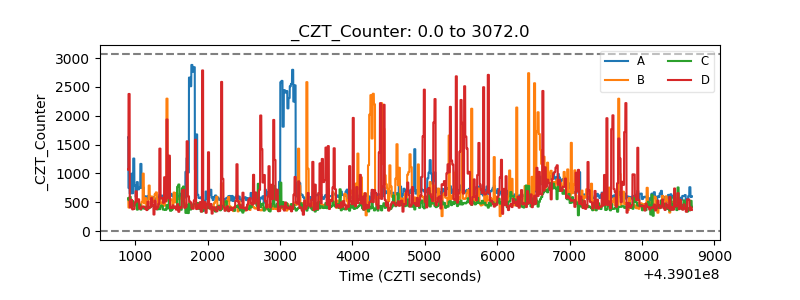 |
| +2.5 Volts monitor | 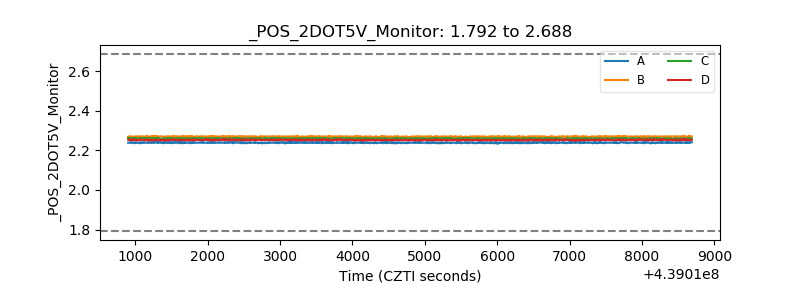 |
| +5 Volts monitor | 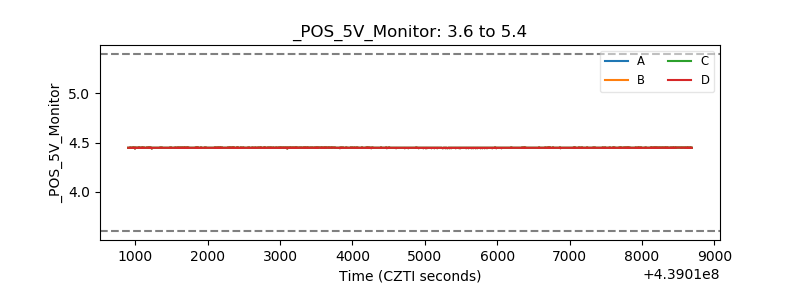 |
| _ROLL_ROT | 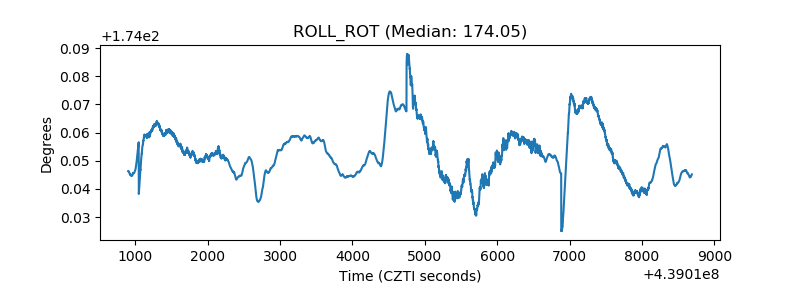 |
| _Roll_DEC | 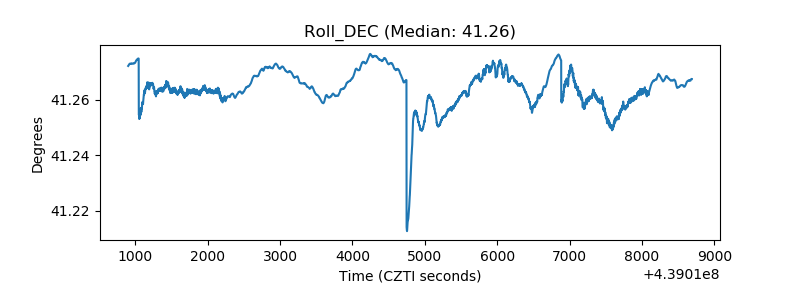 |
| _Roll_RA | 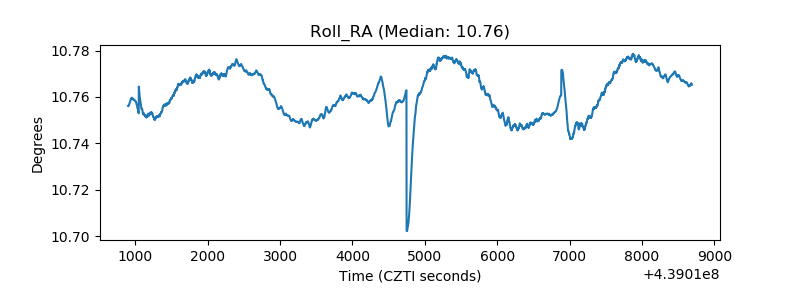 |
| Veto Counter |  |