| Param | Original file | Final file |
|---|---|---|
| Filename | modeM0/AS1A13_074T08_9000005966_44193cztM0_level2.fits | modeM0/AS1A13_074T08_9000005966_44193cztM0_level2_quad_clean.evt |
| Size (bytes) | 928,514,880 | 204,416,640 |
| Size | 885.5 MB | 194.9 MB |
| Events in quadrant A | 9,301,186 | 1,363,817 |
| Events in quadrant B | 8,442,308 | 1,376,777 |
| Events in quadrant C | 6,452,856 | 1,340,700 |
| Events in quadrant D | 9,146,926 | 1,189,860 |
| Mode M0 | |||
|---|---|---|---|
| Quadrant | BADHDUFLAG | Total packets | Discarded packets |
| A | 0 | 38554 | 4 |
| B | 0 | 33801 | 4 |
| C | 0 | 28728 | 4 |
| D | 0 | 36374 | 4 |
| Mode SS | |||
|---|---|---|---|
| Quadrant | BADHDUFLAG | Total packets | Discarded packets |
| A | 0 | 276 | 0 |
| B | 0 | 276 | 0 |
| C | 0 | 276 | 0 |
| D | 0 | 276 | 0 |
| Mode M9 | |||
|---|---|---|---|
| Quadrant | BADHDUFLAG | Total packets | Discarded packets |
| A | 0 | 13 | 0 |
| B | 0 | 13 | 0 |
| C | 0 | 13 | 0 |
| D | 0 | 13 | 0 |
| Quadrant | Total seconds | Saturated seconds | Saturation percentage |
|---|---|---|---|
| A | 13266 | 465 | 3.505201% |
| B | 13266 | 803 | 6.053068% |
| C | 13266 | 317 | 2.389567% |
| D | 13265 | 845 | 6.370147% |
Noise dominated data is calculated using 1-second bins in cleaned event files. If a bin has >2000 counts, and if more than 50% of those come from <1% of pixels, then it is considered to be noise-dominated and hence unusable.
| Quadrant | # 1 sec bins | Bins with >0 counts | Bins with >2000 counts | High rate bins dominated by noise | Noise dominated (total time) | Noise dominated (detector-on time) | Marked lightcurve |
|---|---|---|---|---|---|---|---|
| A | 14736 | 13270 | 63 | 63 | 0.43% | 0.47% | 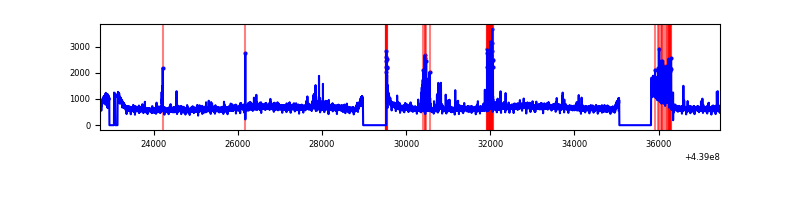 |
| B | 14736 | 13270 | 320 | 320 | 2.17% | 2.41% | 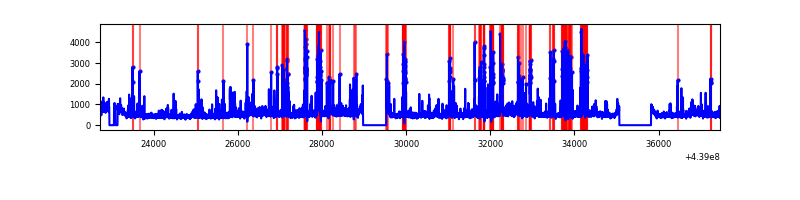 |
| C | 14736 | 13270 | 68 | 68 | 0.46% | 0.51% | 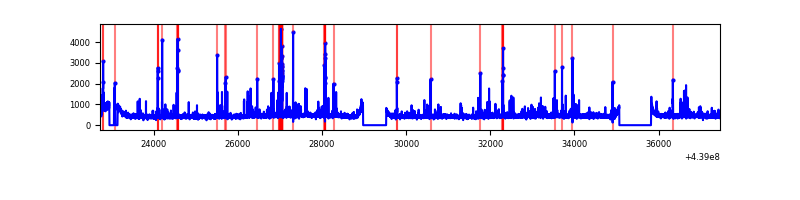 |
| D | 14735 | 13269 | 484 | 484 | 3.28% | 3.65% | 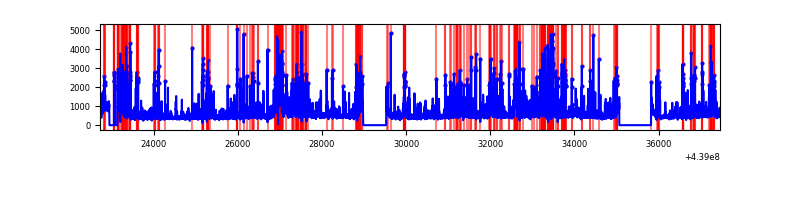 |
Top three noisy pixels from each quadrant. If the there are fewer than three noisy pixels in the level2.evt file, extra rows are filled as -1
| Pixel properties | Quadrant properties | ||||||
|---|---|---|---|---|---|---|---|
| Quadrant | DetID | PixID | Counts | Sigma | Mean | Median | Sigma |
| A | 10 | 83 | 2760865 | 8763.07 | 1509 | 1475 | 314.9 |
| A | 15 | 223 | 411870 | 1303.3 | 1509 | 1475 | 314.9 |
| A | 10 | 248 | 101351 | 317.18 | 1509 | 1475 | 314.9 |
| B | 5 | 172 | 1228347 | 4184.01 | 1483 | 1437 | 293.2 |
| B | 0 | 219 | 238873 | 809.7 | 1483 | 1437 | 293.2 |
| B | 0 | 200 | 219333 | 743.07 | 1483 | 1437 | 293.2 |
| C | 14 | 254 | 370954 | 1053.74 | 1480 | 1490 | 350.6 |
| C | 15 | 158 | 105997 | 298.06 | 1480 | 1490 | 350.6 |
| C | 4 | 254 | 77306 | 216.23 | 1480 | 1490 | 350.6 |
| D | 1 | 52 | 1123230 | 3012.35 | 1455 | 1412 | 372.4 |
| D | 13 | 249 | 665827 | 1784.11 | 1455 | 1412 | 372.4 |
| D | 2 | 249 | 643280 | 1723.57 | 1455 | 1412 | 372.4 |
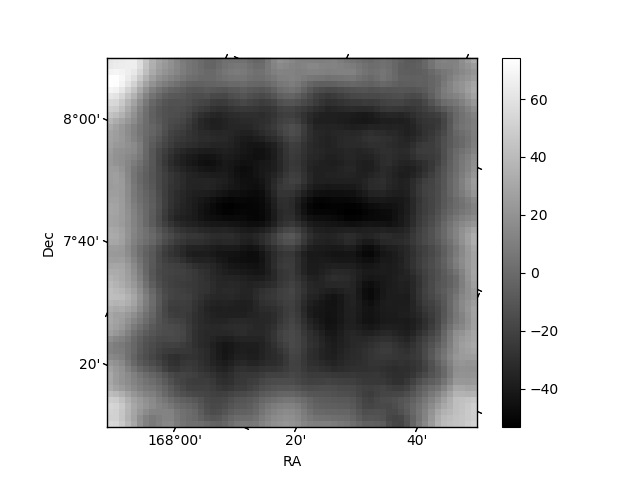
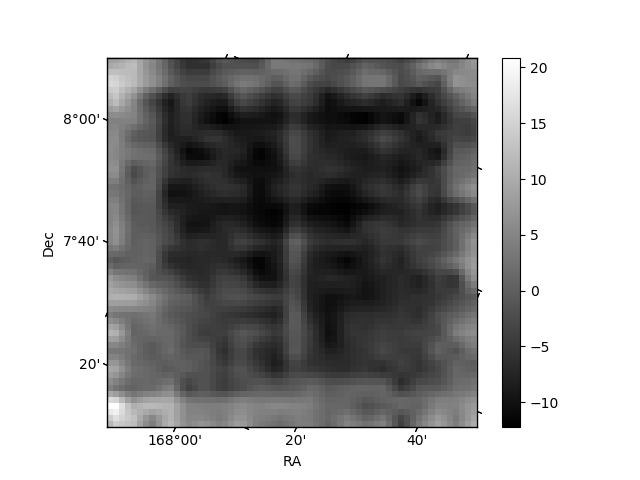
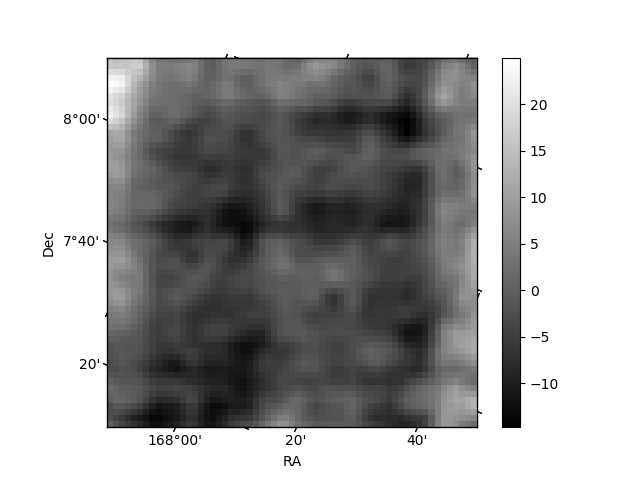
Histogram calculated using DETX and DETY for each event in the final _common_clean file
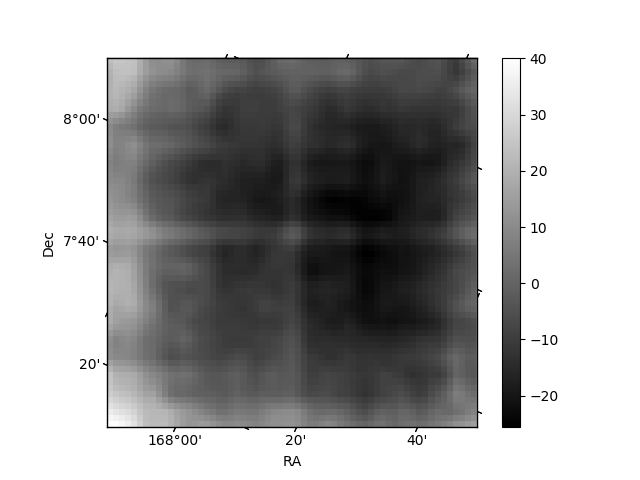
| Quadrant A | 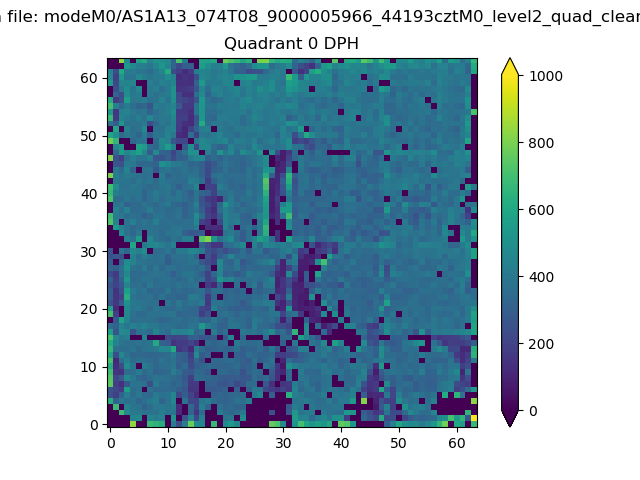 |
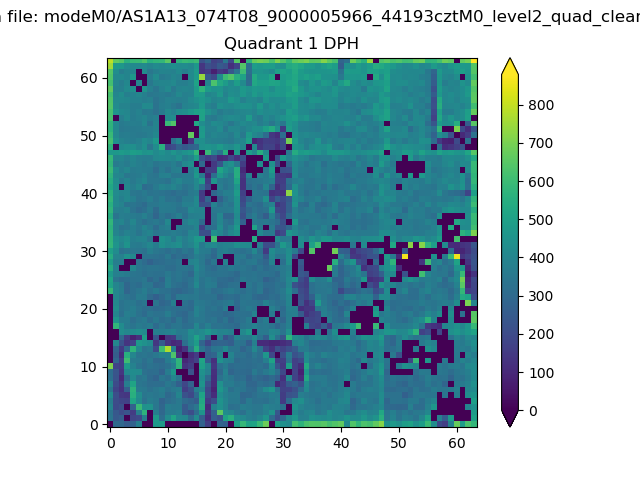 |
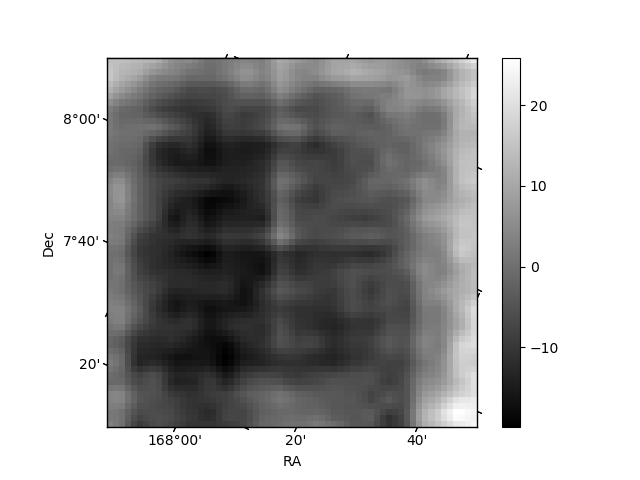
Quadrant B |
|---|---|---|---|
| Quadrant D | 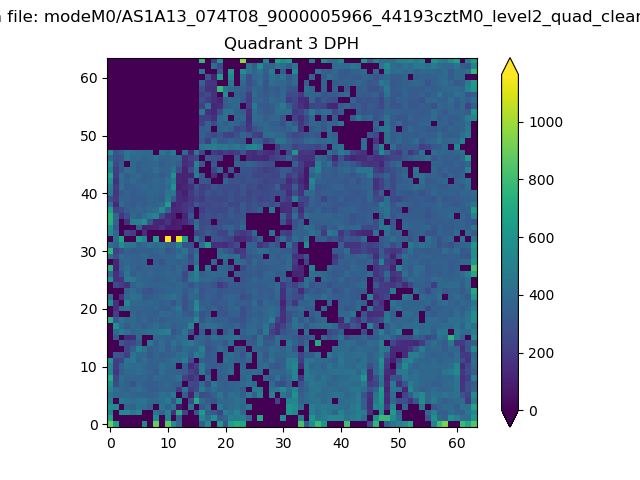 |
 |
Quadrant C |
| Plot type | Count rate plots | Images |
|---|---|---|
| Comparison with Poisson distribution Blue bars denote a histogram of data divided into 1 sec bins. Red curve is a Poisson curve with rate = median count rate of data. |
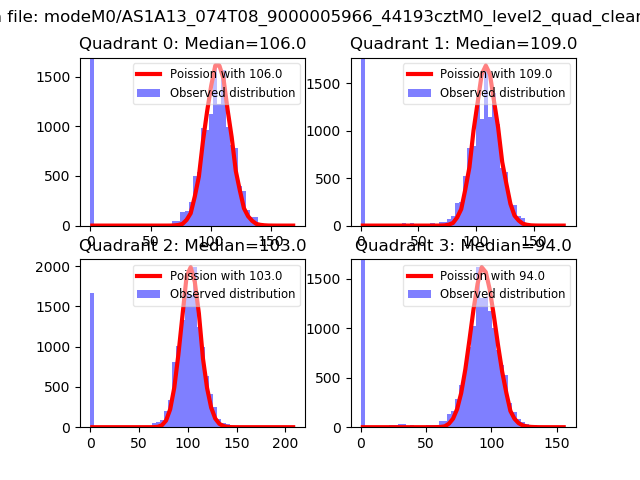 |
 |
| Quadrant-wise count rates Data is divided into 100 sec bins |
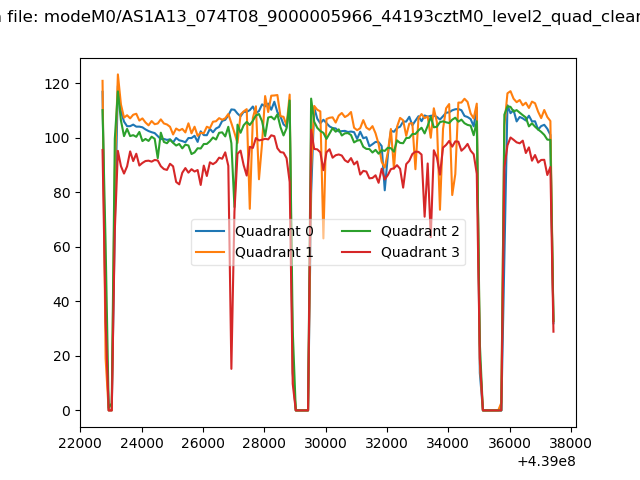 |
|
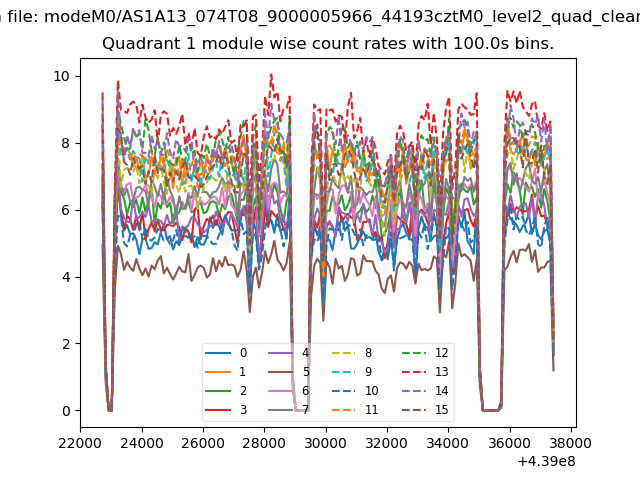
| Module-wise count rates for Quadrant A Data is divided into 100 sec bins |
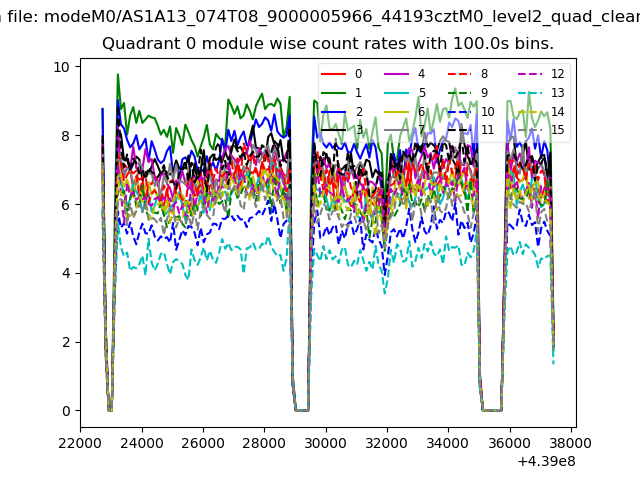 |
 |
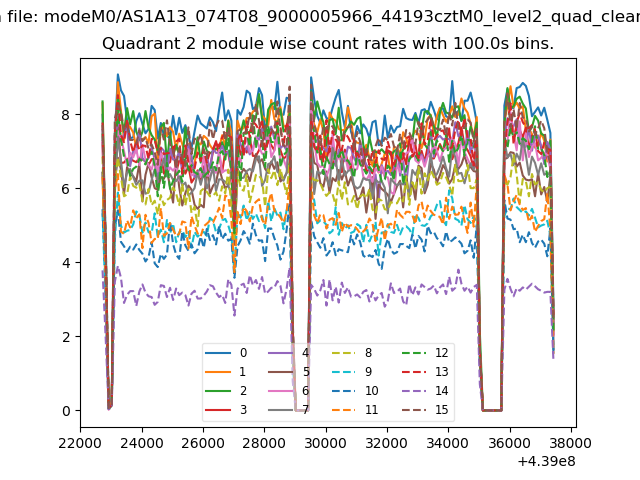
| Module-wise count rates for Quadrant B Data is divided into 100 sec bins |
 |
 |
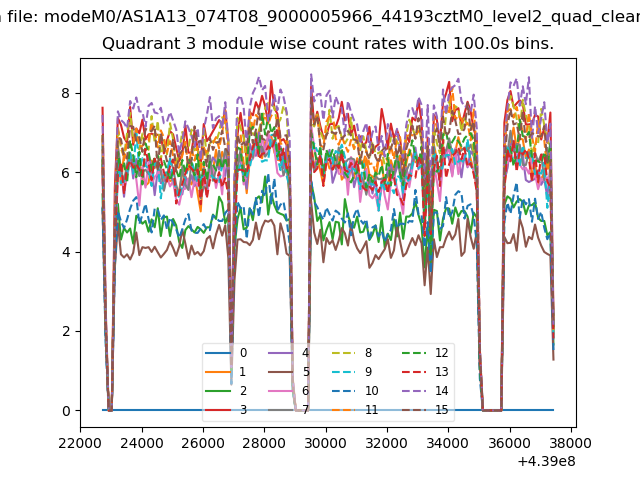
| Module-wise count rates for Quadrant C Data is divided into 100 sec bins |
 |
 |
| Module-wise count rates for Quadrant D Data is divided into 100 sec bins |
 |
 |
| Parameter | Plot |
|---|---|
| CZT HV Monitor | 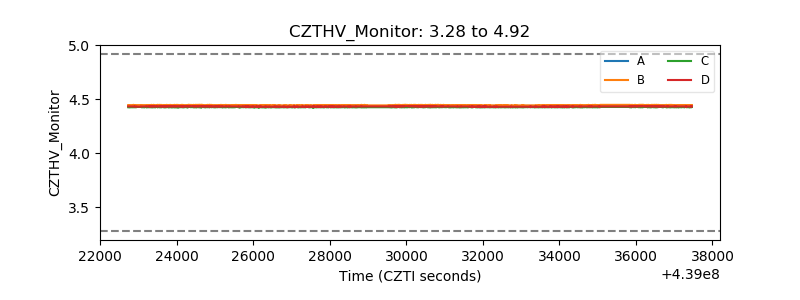 |
| D_VDD | 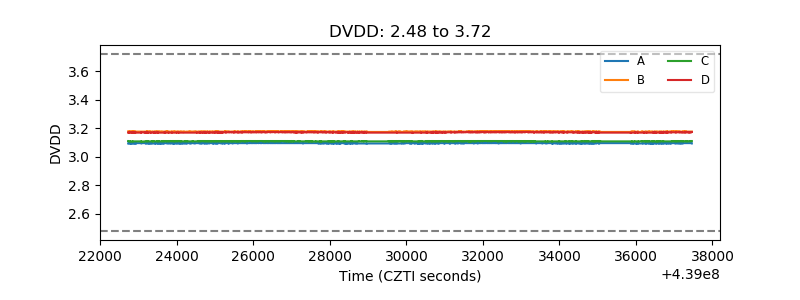 |
| Temperature 1 | 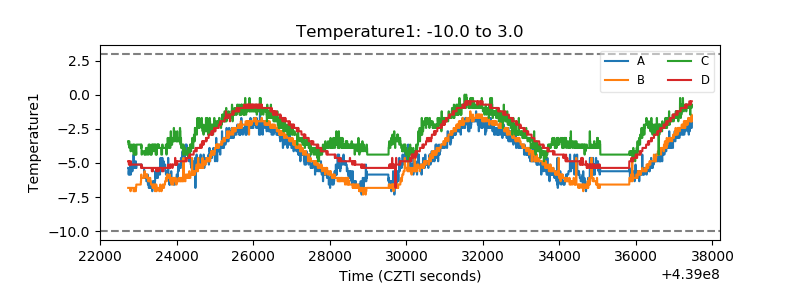 |
| Veto HV Monitor | 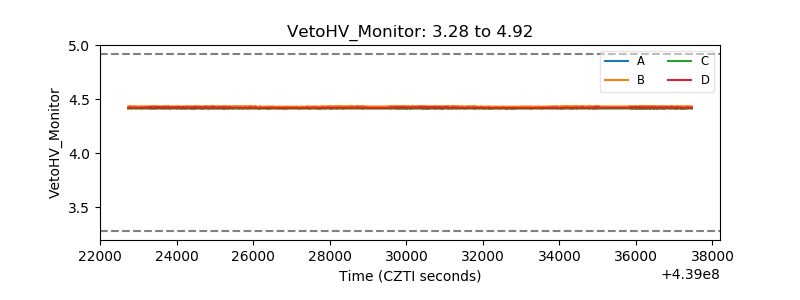 |
| Veto LLD |  |
| Alpha Counter | 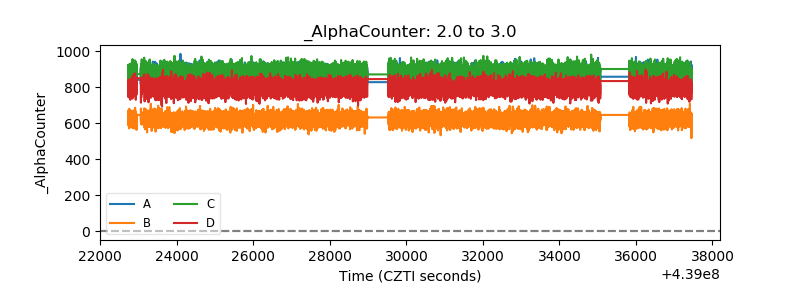 |
| _CPM_Rate | 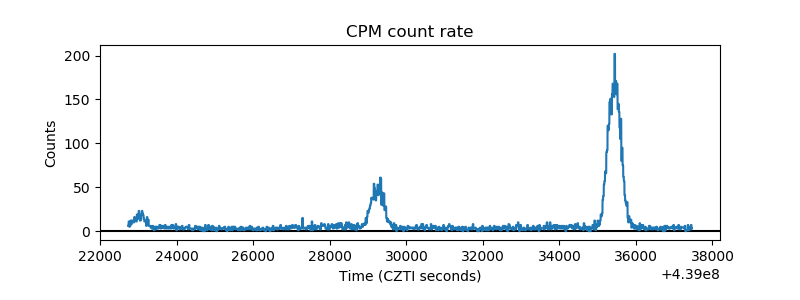 |
| CZT Counter | 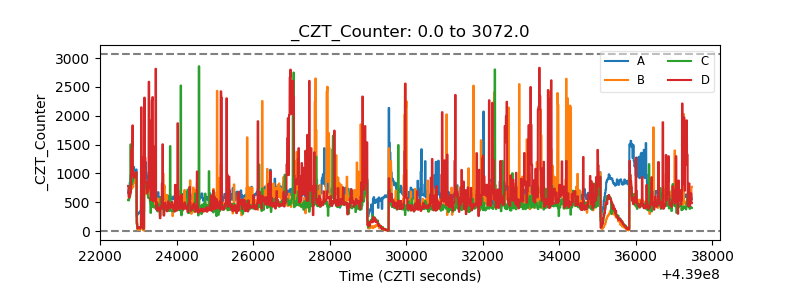 |
| +2.5 Volts monitor | 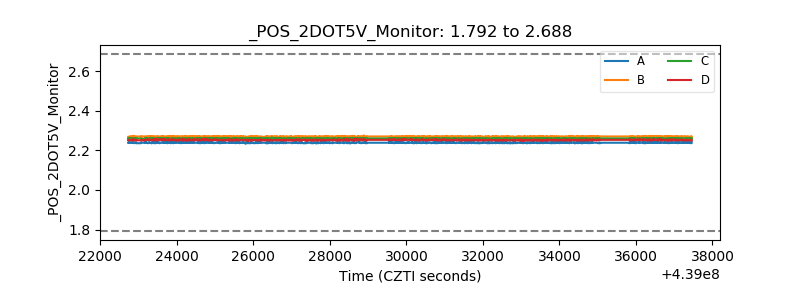 |
| +5 Volts monitor | 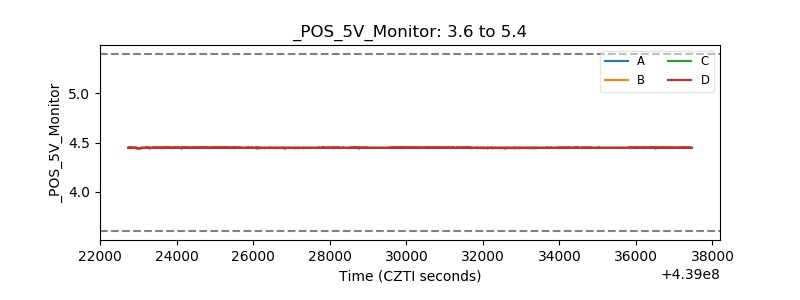 |
| _ROLL_ROT | 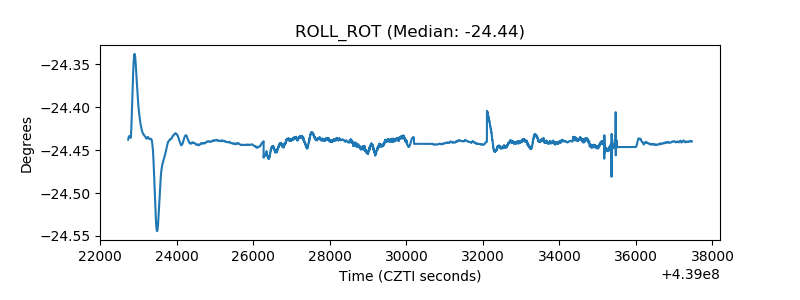 |
| _Roll_DEC | 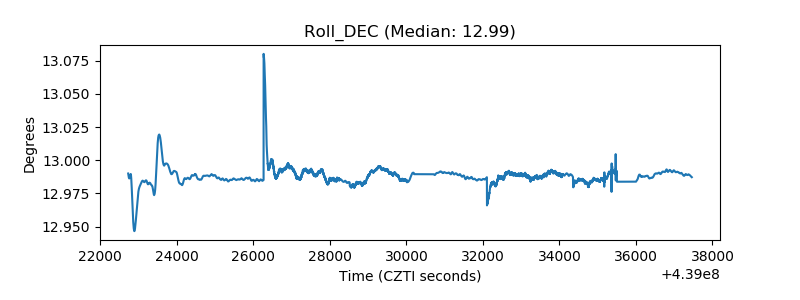 |
| _Roll_RA | 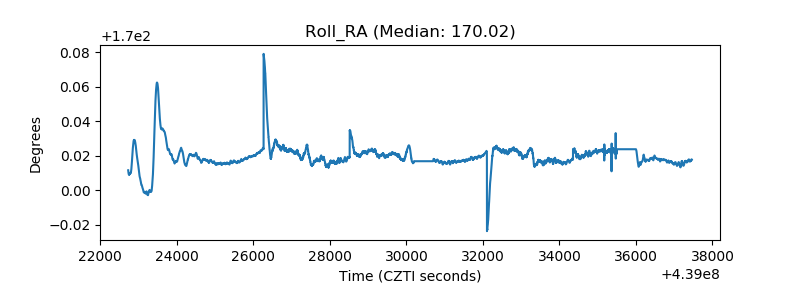 |
| Veto Counter | 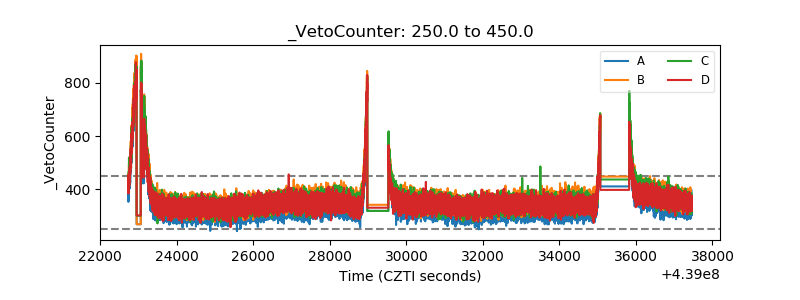 |