| Param | Original file | Final file |
|---|---|---|
| Filename | modeM0/AS1A13_074T08_9000005966_44194cztM0_level2.fits | modeM0/AS1A13_074T08_9000005966_44194cztM0_level2_quad_clean.evt |
| Size (bytes) | 476,429,760 | 106,862,400 |
| Size | 454.4 MB | 101.9 MB |
| Events in quadrant A | 5,034,285 | 708,635 |
| Events in quadrant B | 4,021,879 | 729,828 |
| Events in quadrant C | 3,140,602 | 706,245 |
| Events in quadrant D | 4,921,840 | 626,342 |
| Mode M0 | |||
|---|---|---|---|
| Quadrant | BADHDUFLAG | Total packets | Discarded packets |
| A | 0 | 20539 | 1 |
| B | 0 | 16243 | 1 |
| C | 0 | 13999 | 1 |
| D | 0 | 19120 | 1 |
| Mode SS | |||
|---|---|---|---|
| Quadrant | BADHDUFLAG | Total packets | Discarded packets |
| A | 0 | 136 | 0 |
| B | 0 | 136 | 0 |
| C | 0 | 136 | 0 |
| D | 0 | 136 | 0 |
| Mode M9 | |||
|---|---|---|---|
| Quadrant | BADHDUFLAG | Total packets | Discarded packets |
| A | 0 | 9 | 0 |
| B | 0 | 9 | 0 |
| C | 0 | 9 | 0 |
| D | 0 | 9 | 0 |
| Quadrant | Total seconds | Saturated seconds | Saturation percentage |
|---|---|---|---|
| A | 6662 | 203 | 3.047133% |
| B | 6662 | 191 | 2.867007% |
| C | 6663 | 81 | 1.215669% |
| D | 6662 | 330 | 4.953467% |
Noise dominated data is calculated using 1-second bins in cleaned event files. If a bin has >2000 counts, and if more than 50% of those come from <1% of pixels, then it is considered to be noise-dominated and hence unusable.
| Quadrant | # 1 sec bins | Bins with >0 counts | Bins with >2000 counts | High rate bins dominated by noise | Noise dominated (total time) | Noise dominated (detector-on time) | Marked lightcurve |
|---|---|---|---|---|---|---|---|
| A | 7577 | 6663 | 56 | 56 | 0.74% | 0.84% | 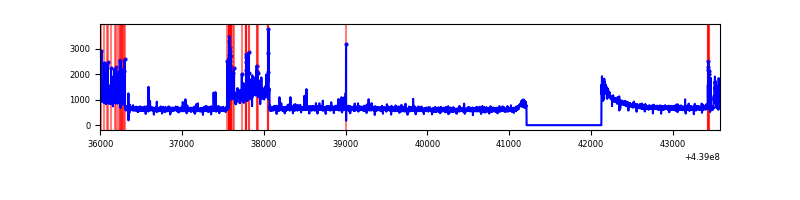 |
| B | 7577 | 6663 | 69 | 69 | 0.91% | 1.04% | 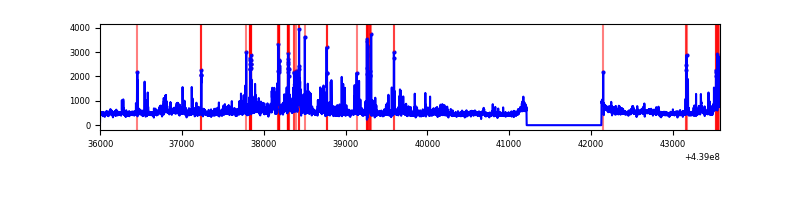 |
| C | 7578 | 6664 | 13 | 13 | 0.17% | 0.20% | 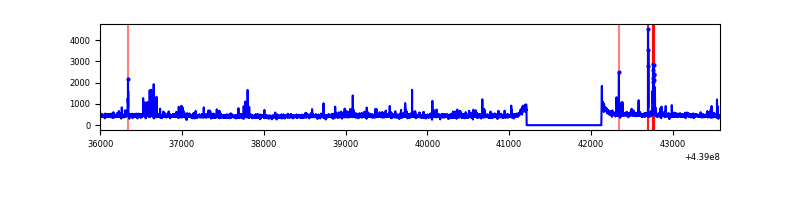 |
| D | 7577 | 6663 | 236 | 236 | 3.11% | 3.54% | 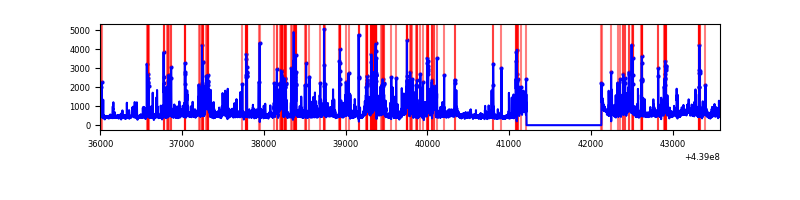 |
Top three noisy pixels from each quadrant. If the there are fewer than three noisy pixels in the level2.evt file, extra rows are filled as -1
| Pixel properties | Quadrant properties | ||||||
|---|---|---|---|---|---|---|---|
| Quadrant | DetID | PixID | Counts | Sigma | Mean | Median | Sigma |
| A | 10 | 83 | 1474143 | 9349.59 | 760 | 742 | 157.6 |
| A | 15 | 223 | 510438 | 3234.32 | 760 | 742 | 157.6 |
| A | 15 | 174 | 69838 | 438.45 | 760 | 742 | 157.6 |
| B | 5 | 172 | 368039 | 2451.43 | 755 | 731 | 149.8 |
| B | 0 | 230 | 193140 | 1284.15 | 755 | 731 | 149.8 |
| B | 0 | 219 | 126030 | 836.25 | 755 | 731 | 149.8 |
| C | 14 | 254 | 119317 | 666.46 | 749 | 752 | 177.9 |
| C | 4 | 254 | 66254 | 368.19 | 749 | 752 | 177.9 |
| C | 3 | 233 | 19179 | 103.58 | 749 | 752 | 177.9 |
| D | 1 | 52 | 739034 | 3873.83 | 739 | 713 | 190.6 |
| D | 11 | 176 | 330736 | 1731.57 | 739 | 713 | 190.6 |
| D | 13 | 249 | 326534 | 1709.52 | 739 | 713 | 190.6 |
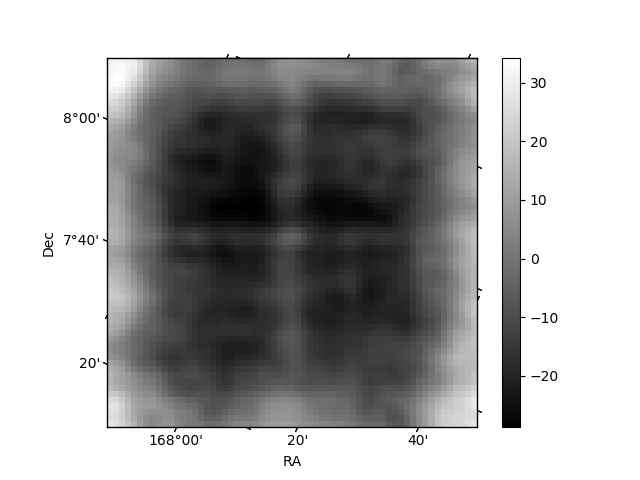
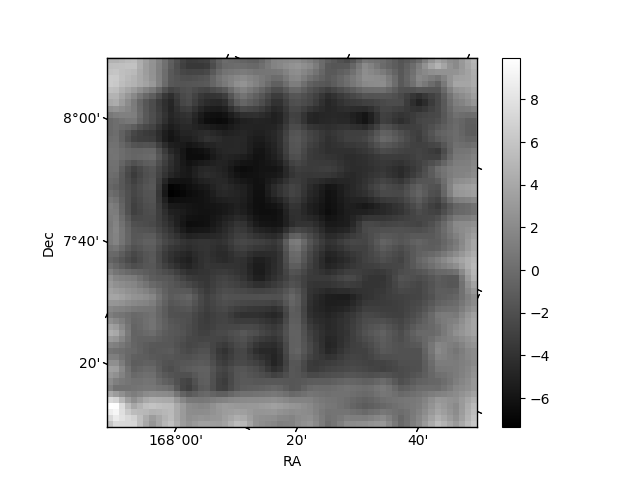
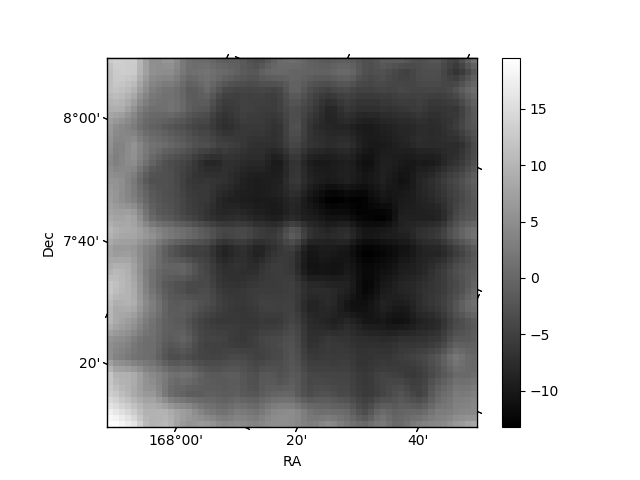
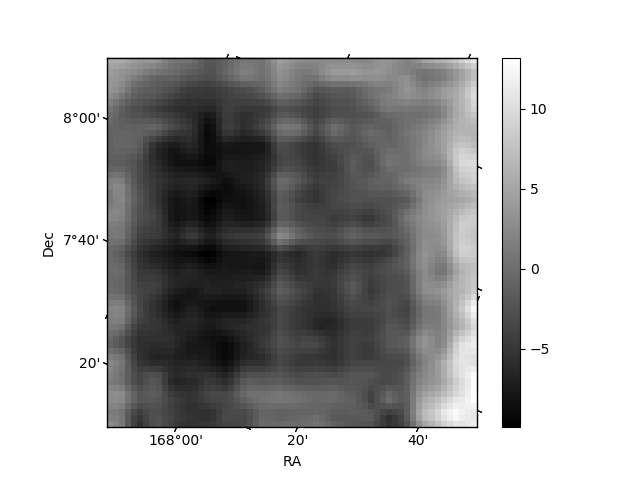
Histogram calculated using DETX and DETY for each event in the final _common_clean file
| Quadrant A | 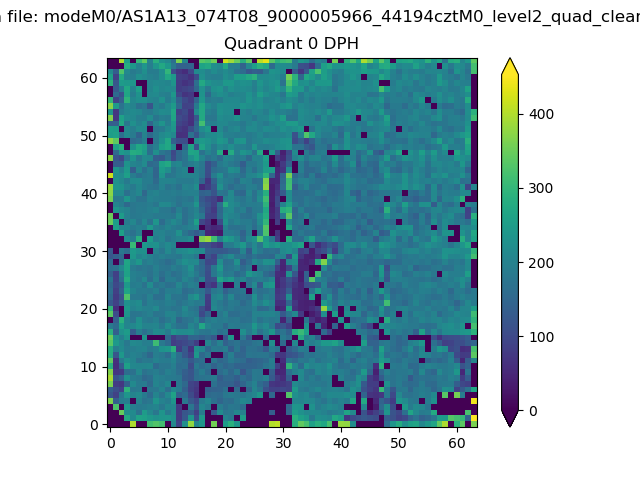 |
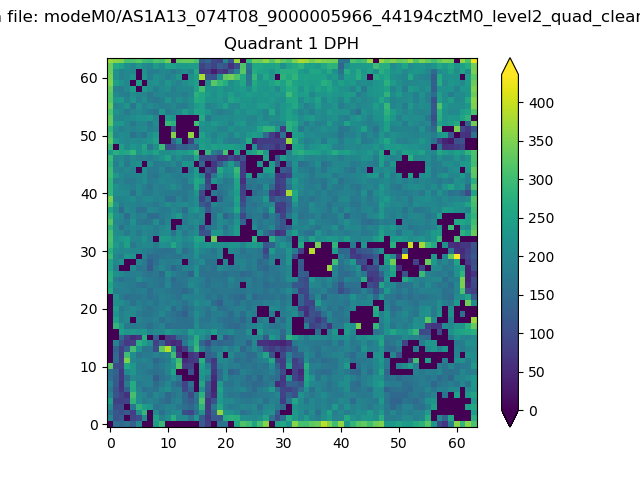 |
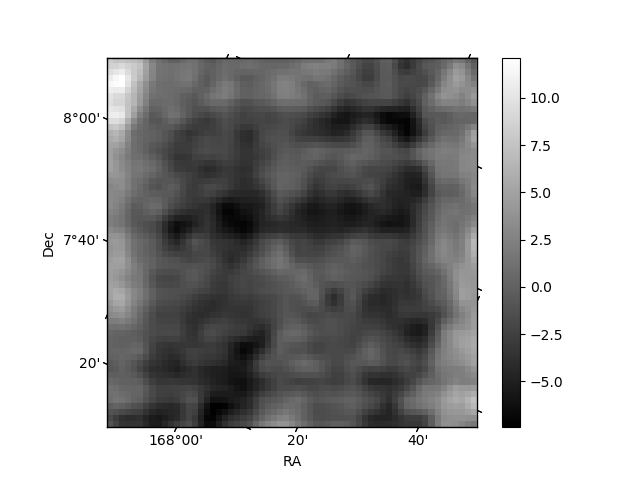
Quadrant B |
|---|---|---|---|
| Quadrant D | 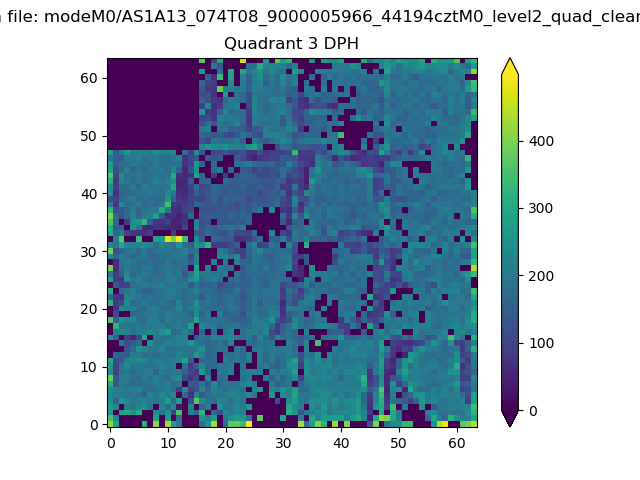 |
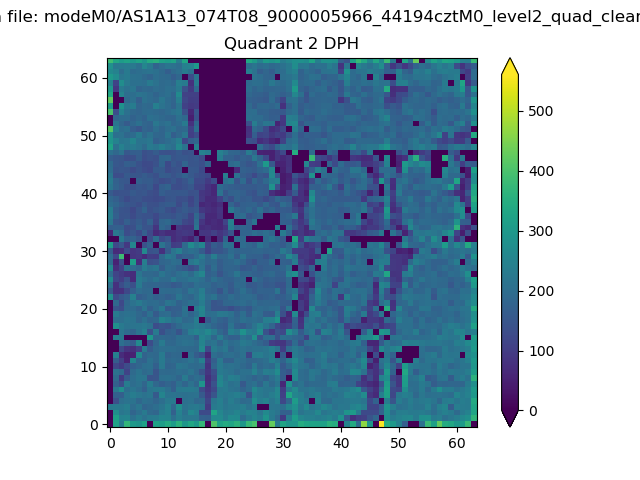 |
Quadrant C |
| Plot type | Count rate plots | Images |
|---|---|---|
| Comparison with Poisson distribution Blue bars denote a histogram of data divided into 1 sec bins. Red curve is a Poisson curve with rate = median count rate of data. |
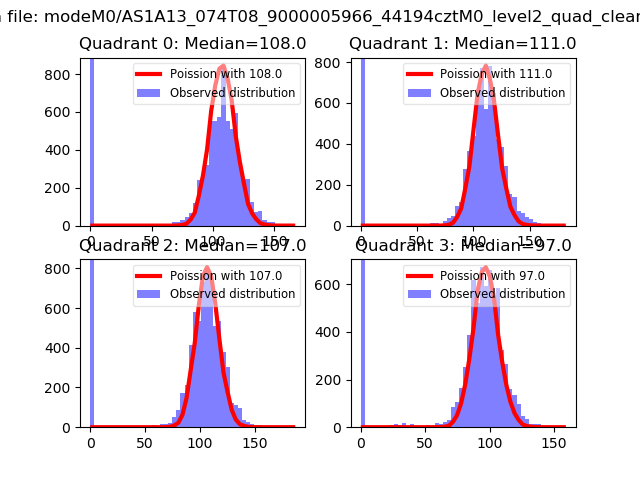 |
 |
| Quadrant-wise count rates Data is divided into 100 sec bins |
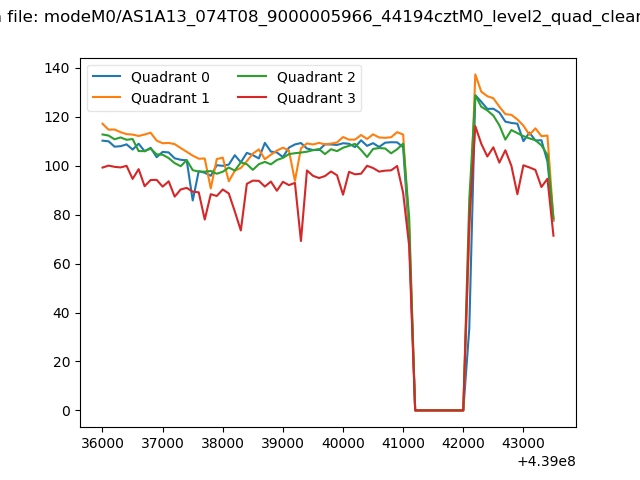 |
|
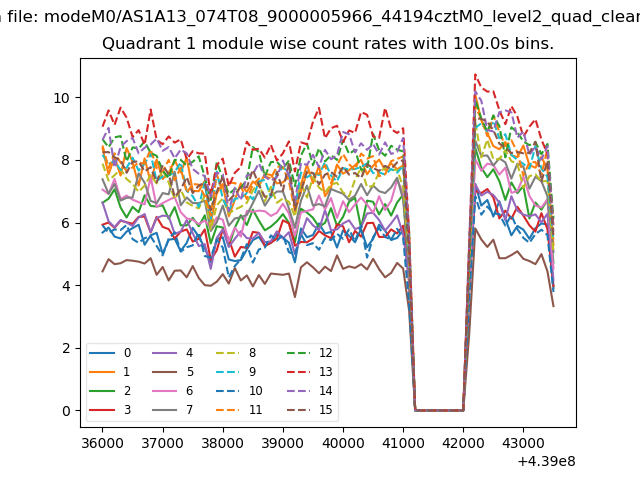
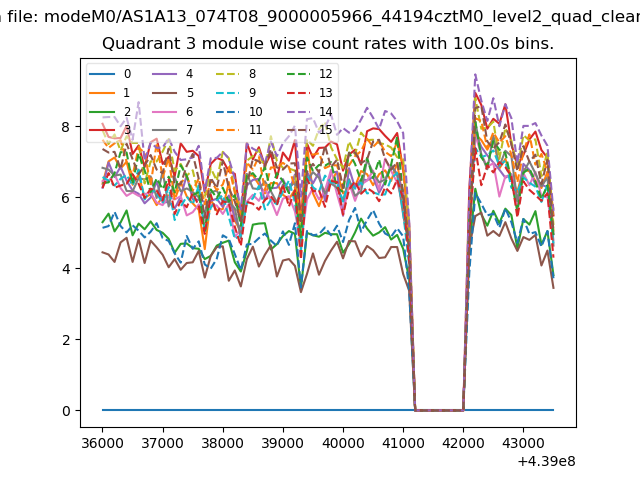
| Module-wise count rates for Quadrant A Data is divided into 100 sec bins |
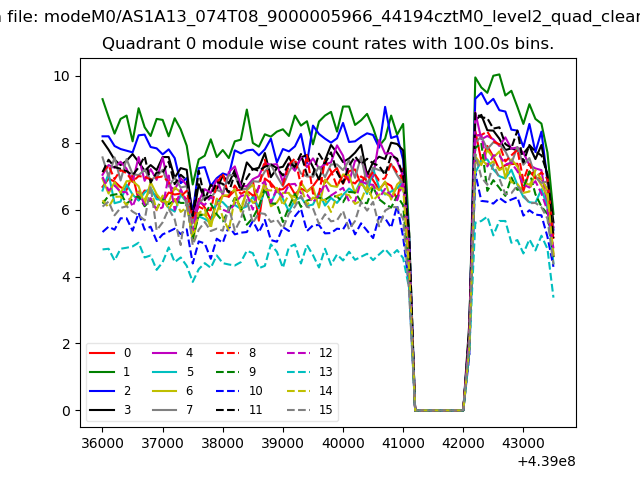 |
 |
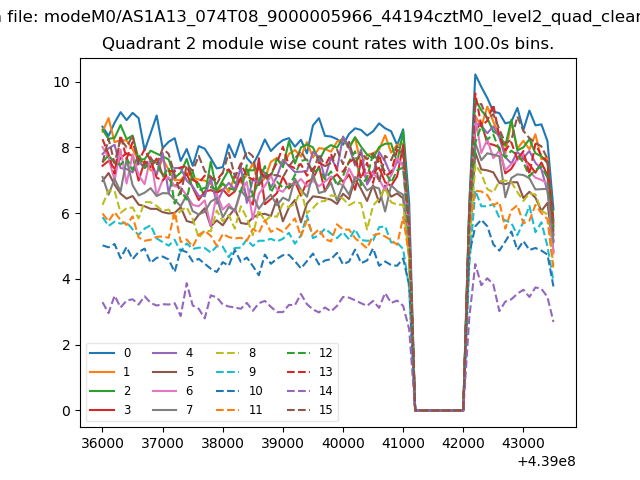
| Module-wise count rates for Quadrant B Data is divided into 100 sec bins |
 |
 |
| Module-wise count rates for Quadrant C Data is divided into 100 sec bins |
 |
 |
| Module-wise count rates for Quadrant D Data is divided into 100 sec bins |
 |
 |
| Parameter | Plot |
|---|---|
| CZT HV Monitor | 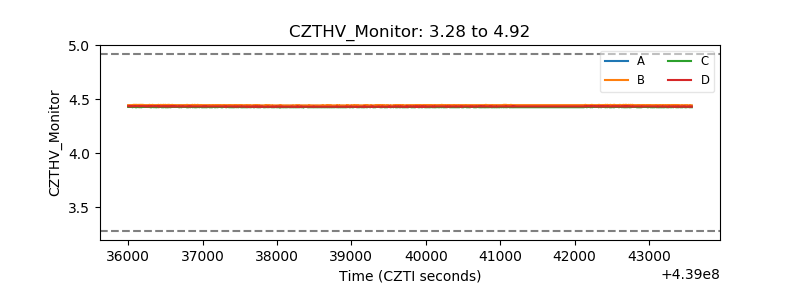 |
| D_VDD | 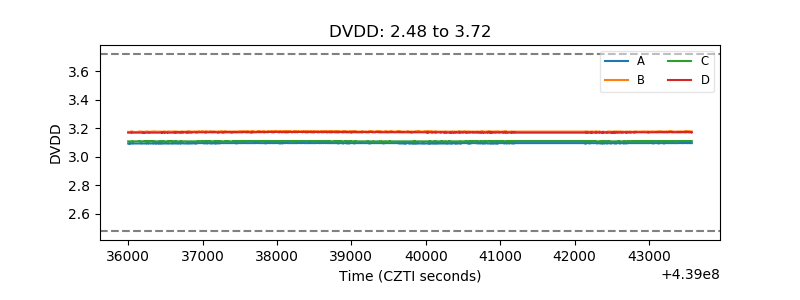 |
| Temperature 1 | 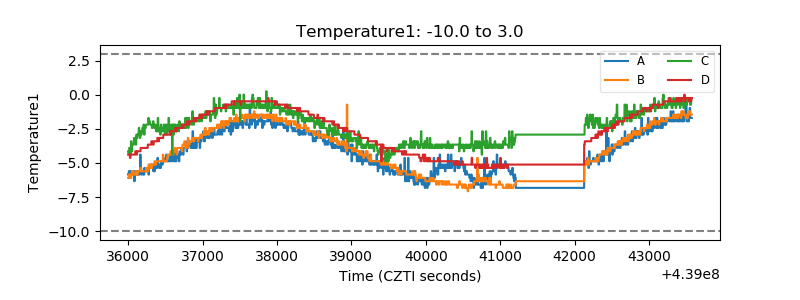 |
| Veto HV Monitor | 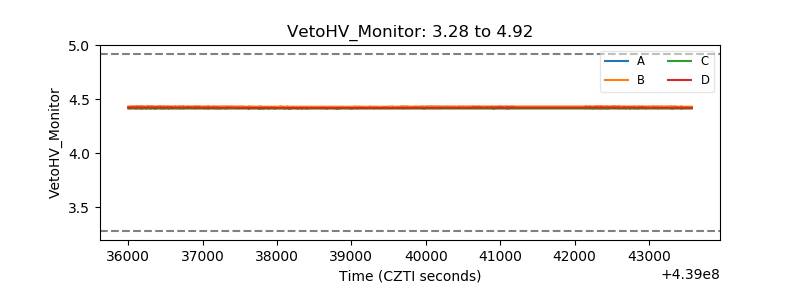 |
| Veto LLD | 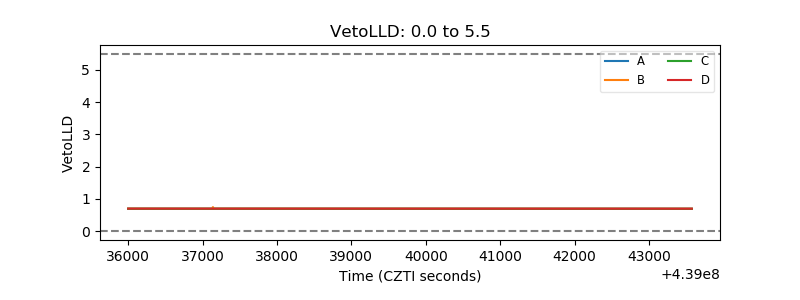 |
| Alpha Counter | 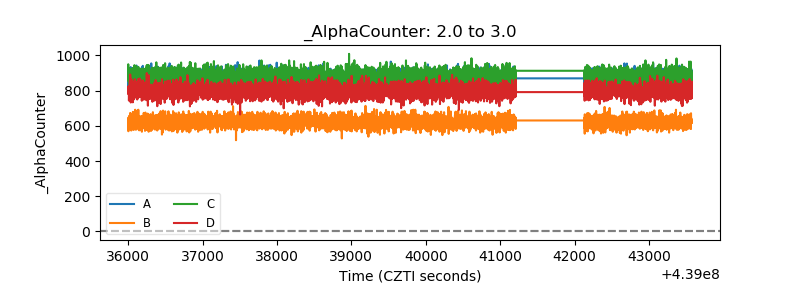 |
| _CPM_Rate | 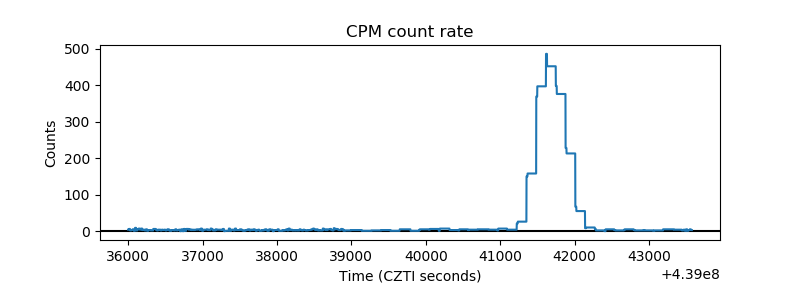 |
| CZT Counter |  |
| +2.5 Volts monitor | 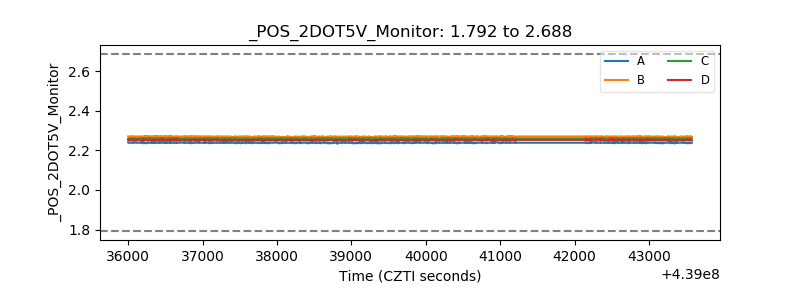 |
| +5 Volts monitor | 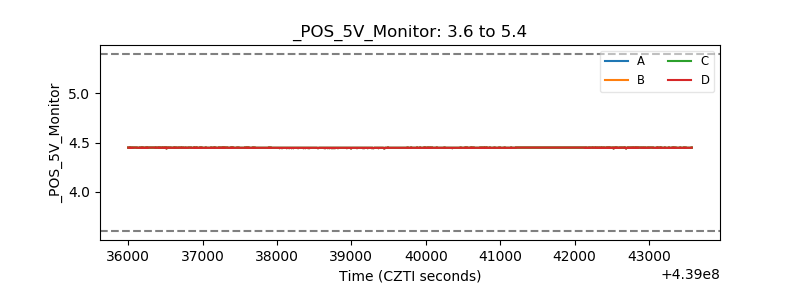 |
| _ROLL_ROT | 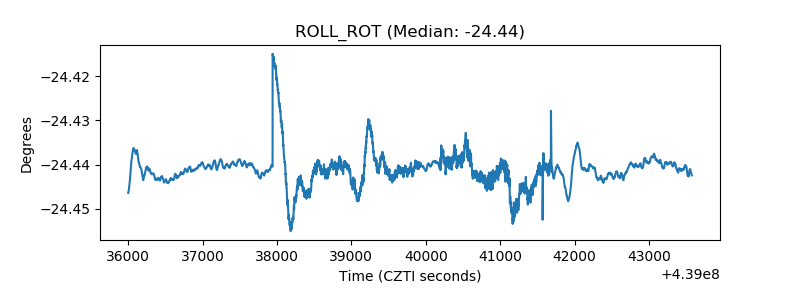 |
| _Roll_DEC | 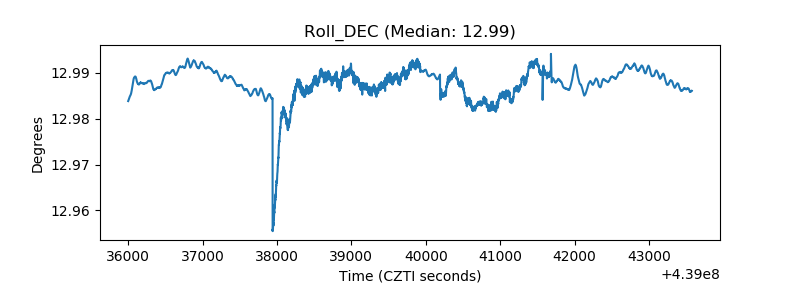 |
| _Roll_RA | 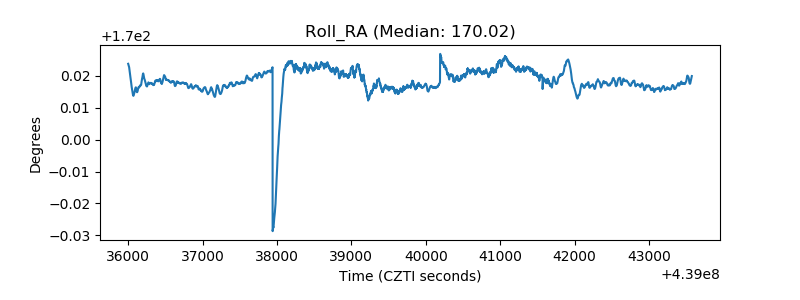 |
| Veto Counter | 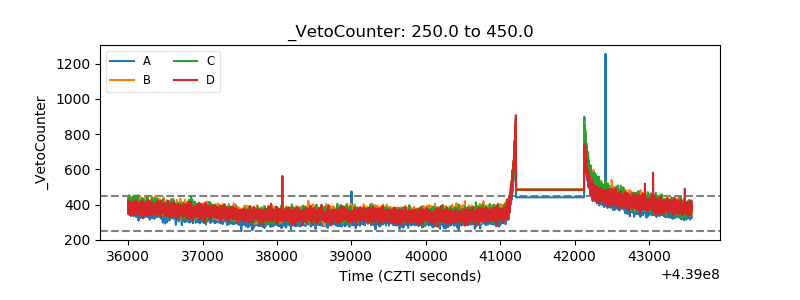 |