| Param | Original file | Final file |
|---|---|---|
| Filename | modeM0/AS1A13_074T08_9000005966_44197cztM0_level2.fits | modeM0/AS1A13_074T08_9000005966_44197cztM0_level2_quad_clean.evt |
| Size (bytes) | 555,670,080 | 116,095,680 |
| Size | 529.9 MB | 110.7 MB |
| Events in quadrant A | 5,068,827 | 807,193 |
| Events in quadrant B | 4,576,280 | 825,420 |
| Events in quadrant C | 3,432,954 | 800,443 |
| Events in quadrant D | 6,975,295 | 618,426 |
| Mode M0 | |||
|---|---|---|---|
| Quadrant | BADHDUFLAG | Total packets | Discarded packets |
| A | 0 | 20281 | 2 |
| B | 0 | 18135 | 3 |
| C | 0 | 14550 | 2 |
| D | 0 | 25350 | 2 |
| Mode SS | |||
|---|---|---|---|
| Quadrant | BADHDUFLAG | Total packets | Discarded packets |
| A | 0 | 136 | 0 |
| B | 0 | 136 | 0 |
| C | 0 | 136 | 0 |
| D | 0 | 136 | 0 |
| Mode M9 | |||
|---|---|---|---|
| Quadrant | BADHDUFLAG | Total packets | Discarded packets |
| A | 0 | 13 | 0 |
| B | 0 | 14 | 0 |
| C | 0 | 14 | 0 |
| D | 0 | 14 | 0 |
| Quadrant | Total seconds | Saturated seconds | Saturation percentage |
|---|---|---|---|
| A | 6651 | 171 | 2.571042% |
| B | 6650 | 229 | 3.443609% |
| C | 6650 | 62 | 0.932331% |
| D | 6650 | 1204 | 18.105263% |
Noise dominated data is calculated using 1-second bins in cleaned event files. If a bin has >2000 counts, and if more than 50% of those come from <1% of pixels, then it is considered to be noise-dominated and hence unusable.
| Quadrant | # 1 sec bins | Bins with >0 counts | Bins with >2000 counts | High rate bins dominated by noise | Noise dominated (total time) | Noise dominated (detector-on time) | Marked lightcurve |
|---|---|---|---|---|---|---|---|
| A | 7871 | 6652 | 32 | 32 | 0.41% | 0.48% | 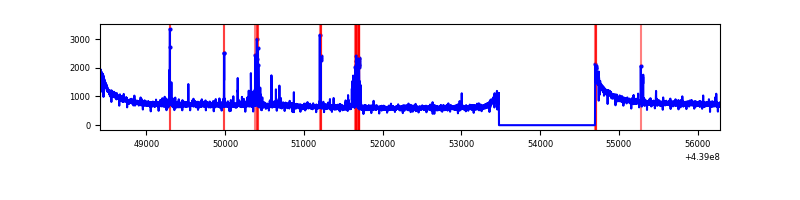 |
| B | 7870 | 6651 | 78 | 78 | 0.99% | 1.17% | 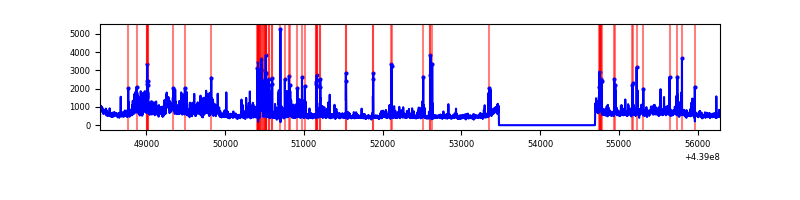 |
| C | 7870 | 6651 | 16 | 16 | 0.20% | 0.24% | 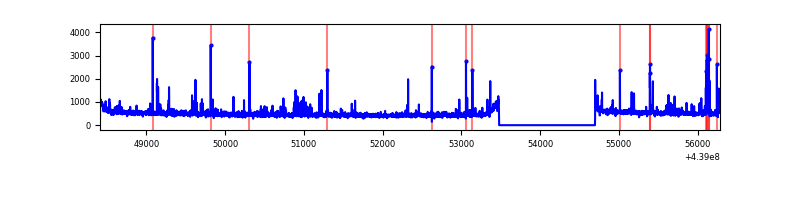 |
| D | 7870 | 6651 | 993 | 993 | 12.62% | 14.93% | 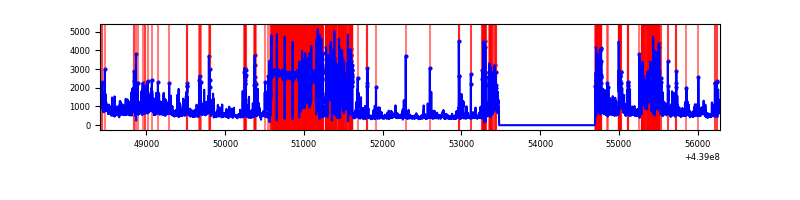 |
Top three noisy pixels from each quadrant. If the there are fewer than three noisy pixels in the level2.evt file, extra rows are filled as -1
| Pixel properties | Quadrant properties | ||||||
|---|---|---|---|---|---|---|---|
| Quadrant | DetID | PixID | Counts | Sigma | Mean | Median | Sigma |
| A | 10 | 83 | 1681997 | 9952.63 | 824 | 808 | 168.9 |
| A | 14 | 254 | 75404 | 441.61 | 824 | 808 | 168.9 |
| A | 14 | 159 | 65166 | 381.0 | 824 | 808 | 168.9 |
| B | 0 | 219 | 490845 | 3094.65 | 814 | 792 | 158.4 |
| B | 0 | 200 | 275923 | 1737.43 | 814 | 792 | 158.4 |
| B | 5 | 172 | 149698 | 940.33 | 814 | 792 | 158.4 |
| C | 14 | 254 | 182568 | 957.73 | 811 | 817 | 189.8 |
| C | 4 | 254 | 66051 | 343.75 | 811 | 817 | 189.8 |
| C | 3 | 233 | 9273 | 44.56 | 811 | 817 | 189.8 |
| D | 11 | 176 | 3042066 | 16667.23 | 732 | 712 | 182.5 |
| D | 1 | 52 | 238805 | 1304.8 | 732 | 712 | 182.5 |
| D | 5 | 222 | 234471 | 1281.05 | 732 | 712 | 182.5 |
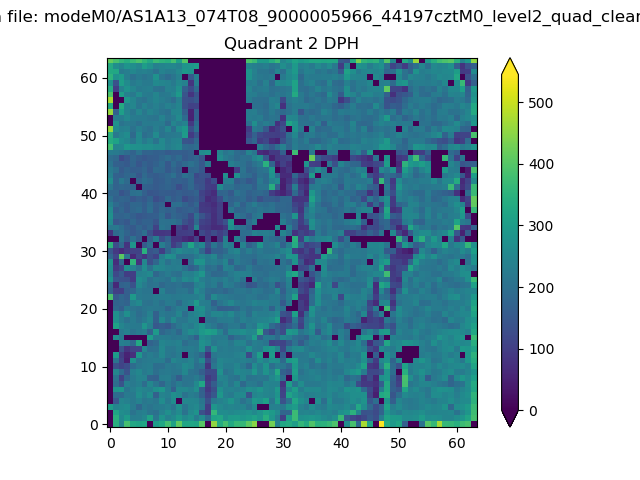
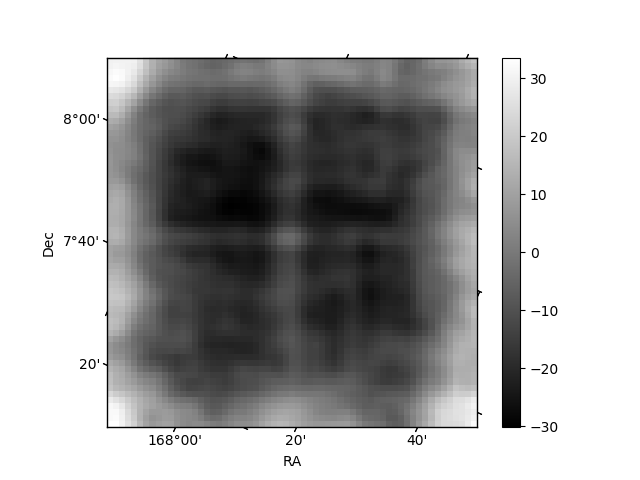
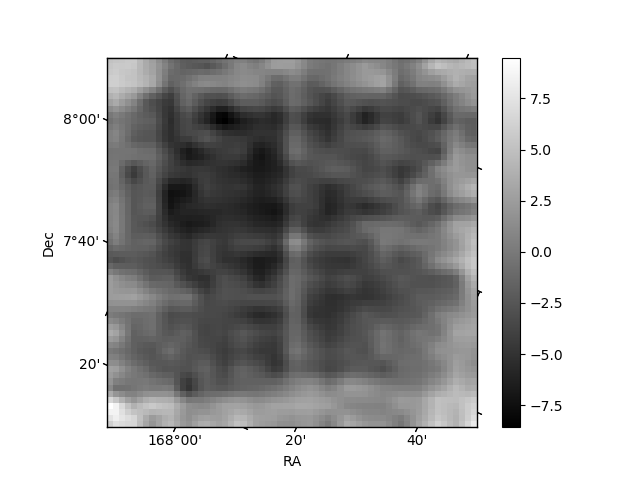
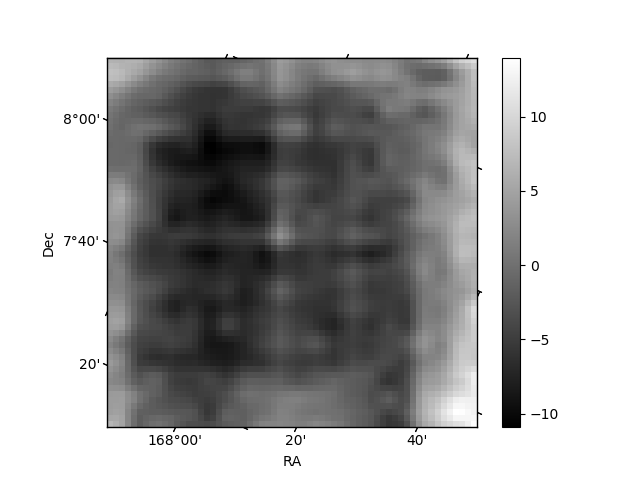
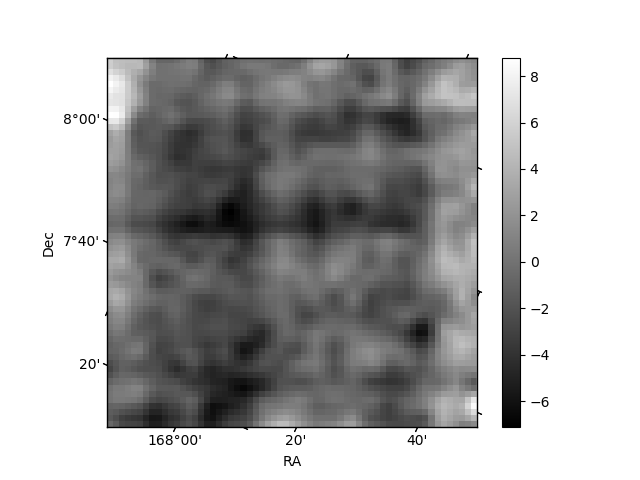
Histogram calculated using DETX and DETY for each event in the final _common_clean file
| Quadrant A | 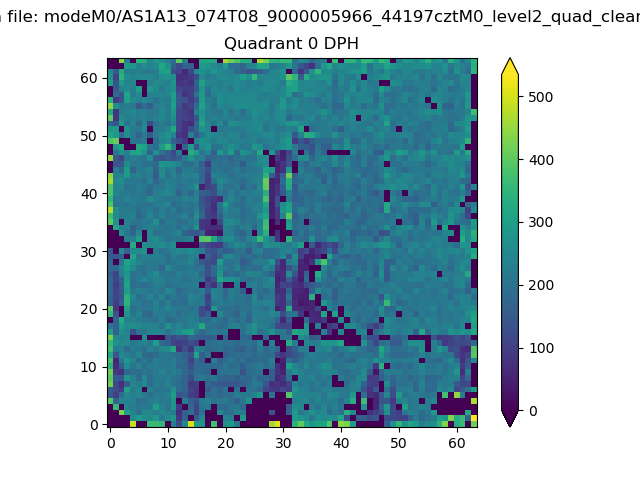 |
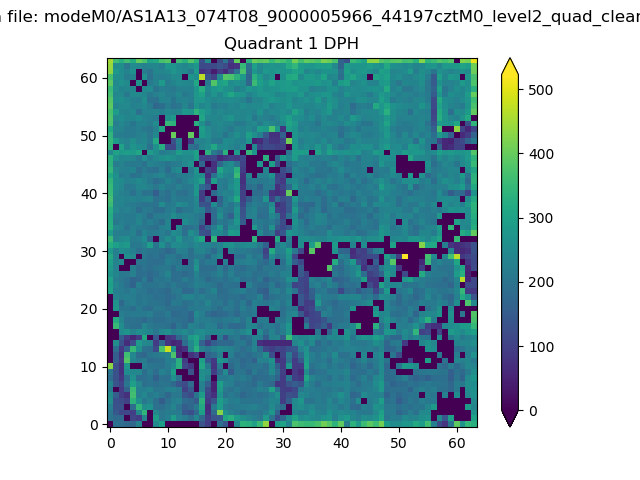 |
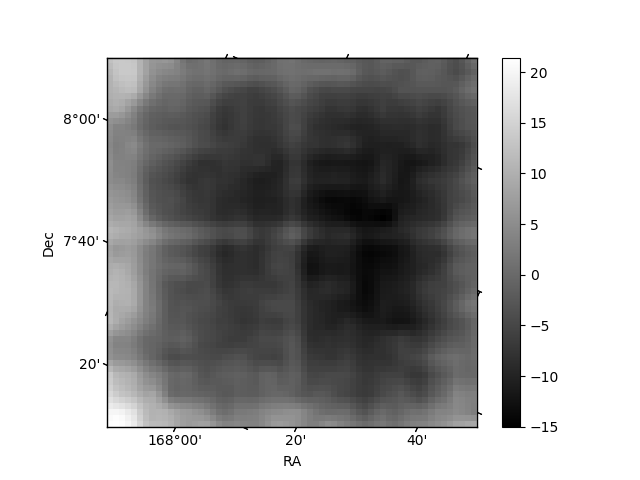
Quadrant B |
|---|---|---|---|
| Quadrant D | 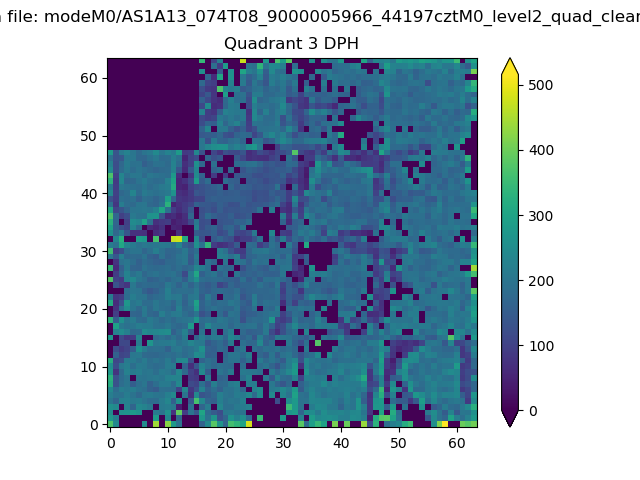 |
 |
Quadrant C |
| Plot type | Count rate plots | Images |
|---|---|---|
| Comparison with Poisson distribution Blue bars denote a histogram of data divided into 1 sec bins. Red curve is a Poisson curve with rate = median count rate of data. |
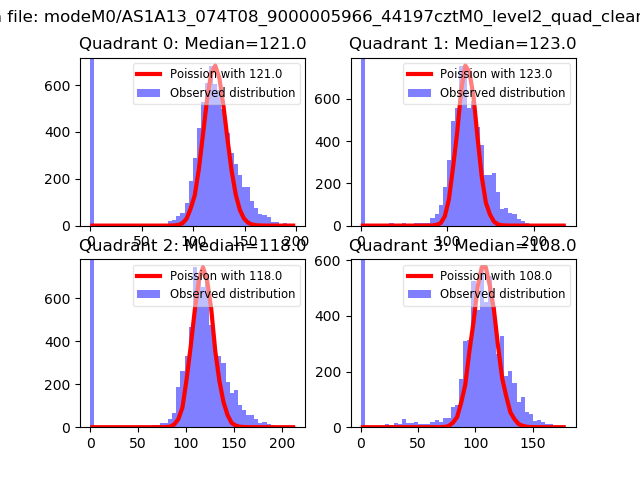 |
 |
| Quadrant-wise count rates Data is divided into 100 sec bins |
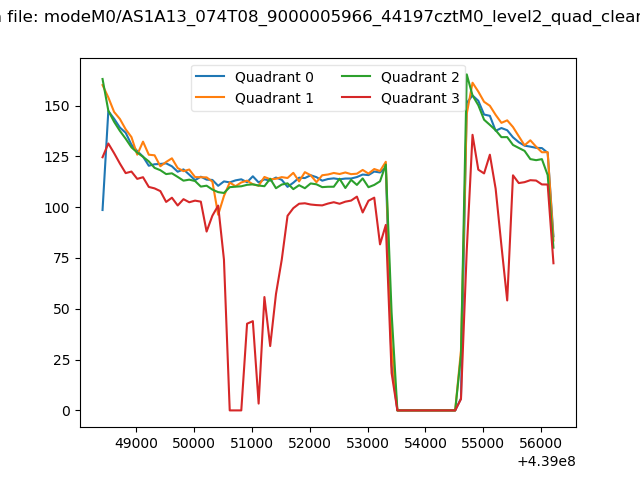 |
|
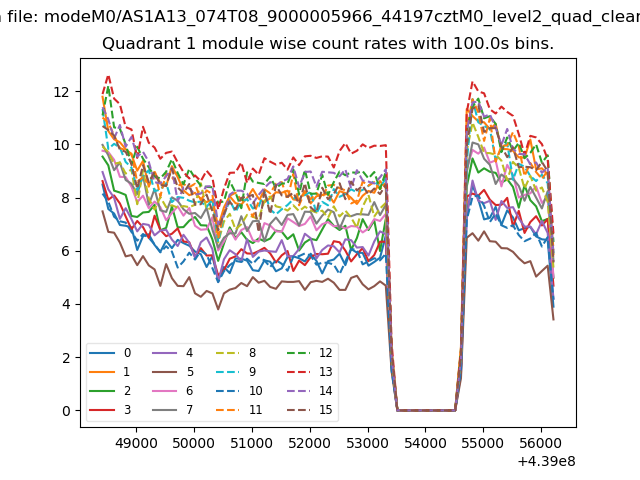
| Module-wise count rates for Quadrant A Data is divided into 100 sec bins |
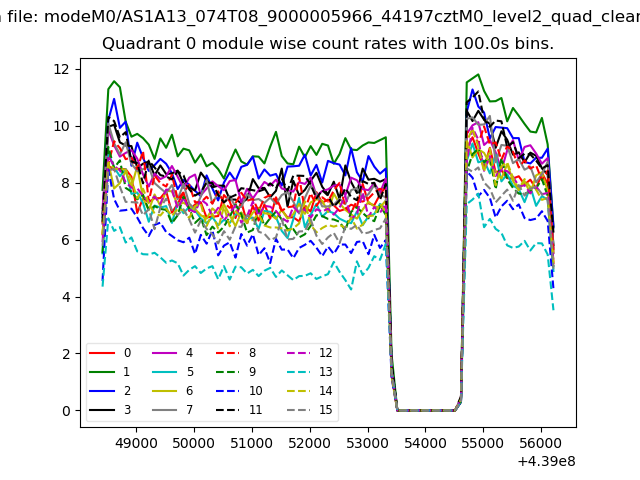 |
 |
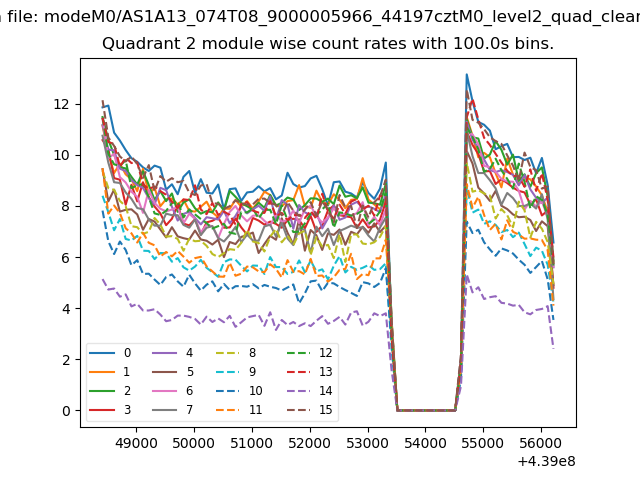
| Module-wise count rates for Quadrant B Data is divided into 100 sec bins |
 |
 |
| Module-wise count rates for Quadrant C Data is divided into 100 sec bins |
 |
 |
| Module-wise count rates for Quadrant D Data is divided into 100 sec bins |
 |
 |
| Parameter | Plot |
|---|---|
| CZT HV Monitor | 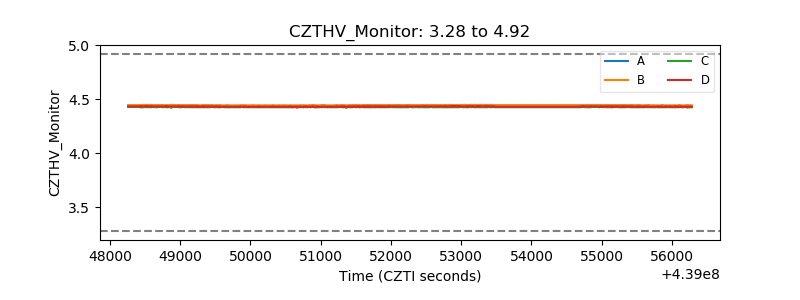 |
| D_VDD | 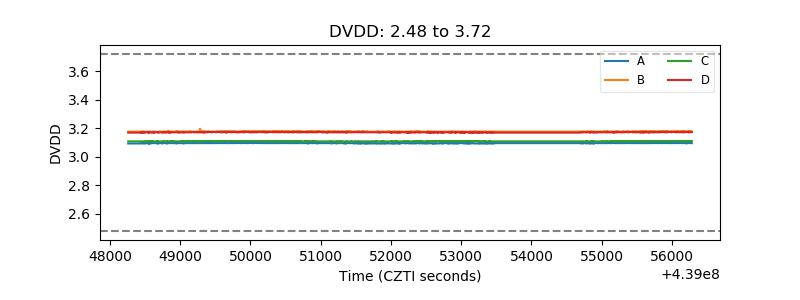 |
| Temperature 1 | 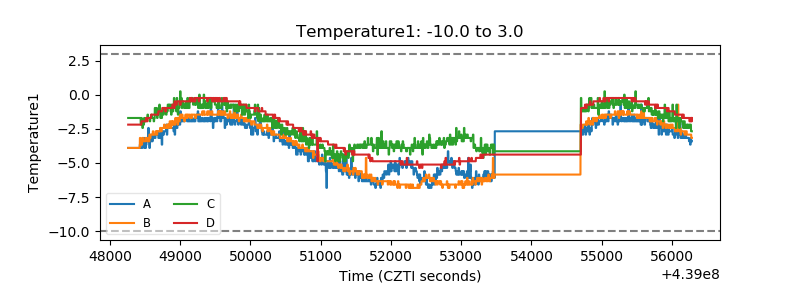 |
| Veto HV Monitor | 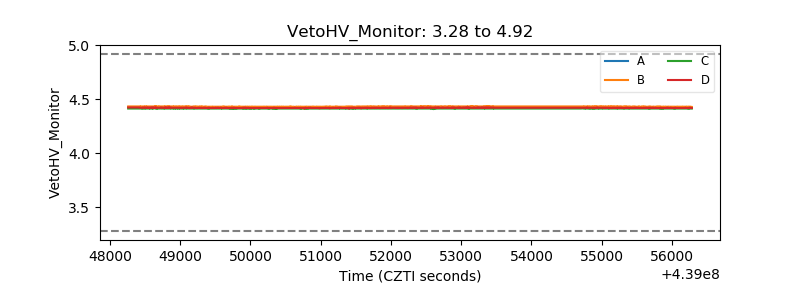 |
| Veto LLD | 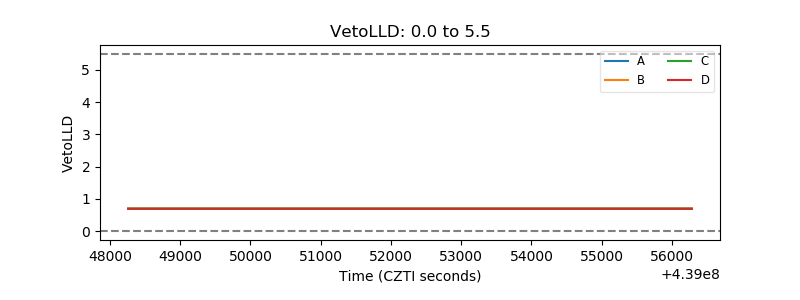 |
| Alpha Counter | 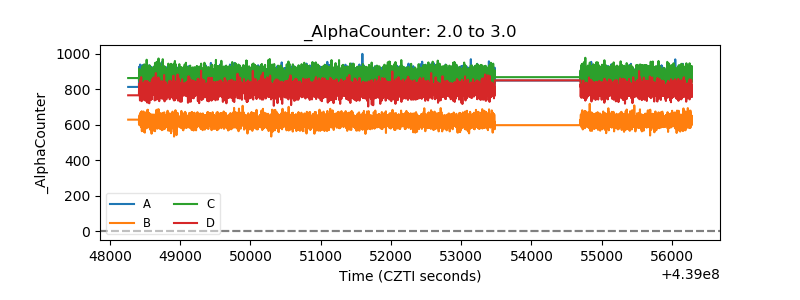 |
| _CPM_Rate | 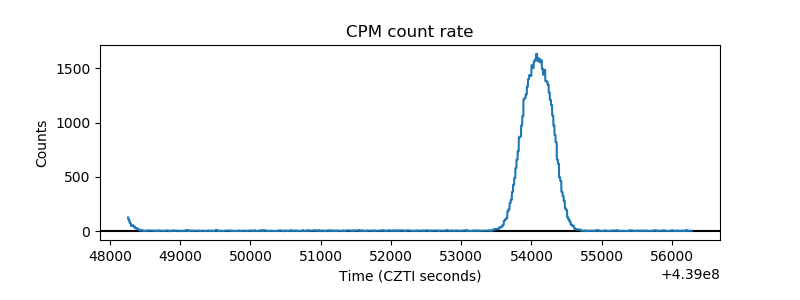 |
| CZT Counter | 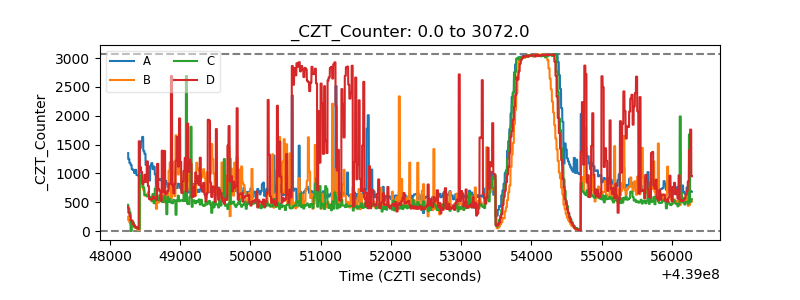 |
| +2.5 Volts monitor | 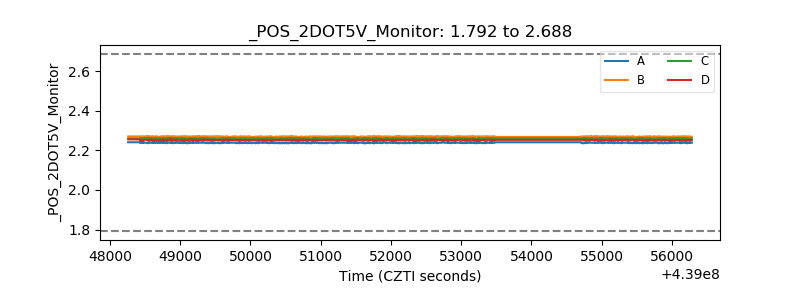 |
| +5 Volts monitor | 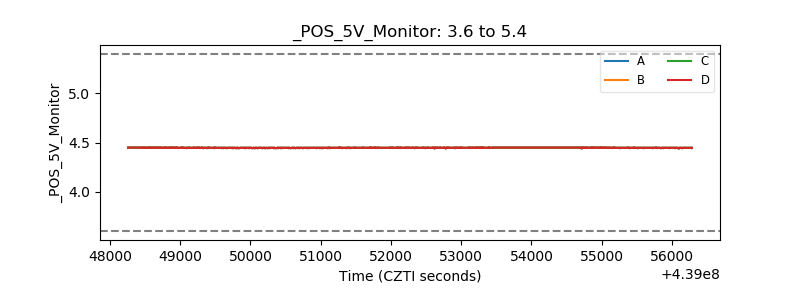 |
| _ROLL_ROT | 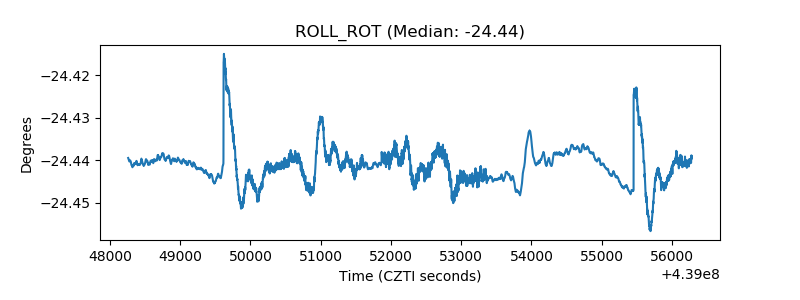 |
| _Roll_DEC | 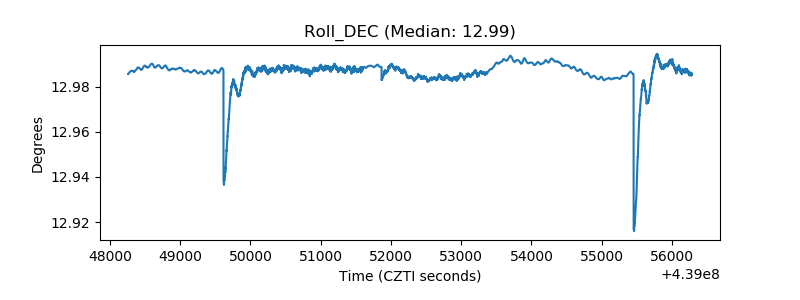 |
| _Roll_RA | 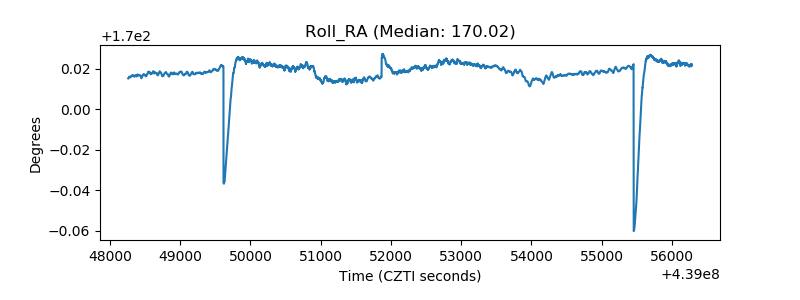 |
| Veto Counter | 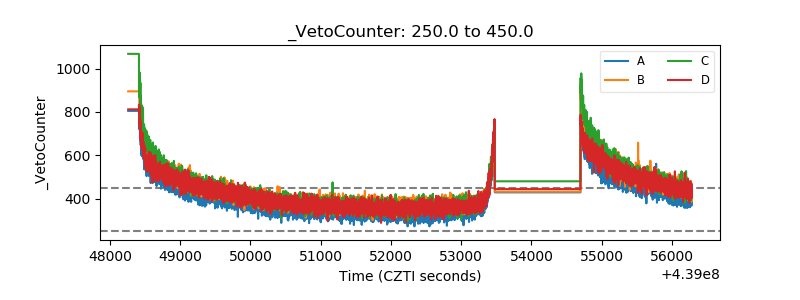 |