| Param | Original file | Final file |
|---|---|---|
| Filename | modeM0/AS1A13_074T08_9000005966_44198cztM0_level2.fits | modeM0/AS1A13_074T08_9000005966_44198cztM0_level2_quad_clean.evt |
| Size (bytes) | 212,011,200 | 50,454,720 |
| Size | 202.2 MB | 48.1 MB |
| Events in quadrant A | 2,056,905 | 350,692 |
| Events in quadrant B | 1,768,235 | 354,627 |
| Events in quadrant C | 1,462,326 | 340,017 |
| Events in quadrant D | 2,350,614 | 290,719 |
| Mode M0 | |||
|---|---|---|---|
| Quadrant | BADHDUFLAG | Total packets | Discarded packets |
| A | 0 | 8284 | 1 |
| B | 0 | 7116 | 1 |
| C | 0 | 6032 | 1 |
| D | 0 | 8810 | 1 |
| Mode SS | |||
|---|---|---|---|
| Quadrant | BADHDUFLAG | Total packets | Discarded packets |
| A | 0 | 54 | 0 |
| B | 0 | 54 | 0 |
| C | 0 | 54 | 0 |
| D | 0 | 54 | 0 |
| Quadrant | Total seconds | Saturated seconds | Saturation percentage |
|---|---|---|---|
| A | 2678 | 15 | 0.560119% |
| B | 2678 | 61 | 2.277819% |
| C | 2679 | 18 | 0.671892% |
| D | 2679 | 225 | 8.398656% |
Noise dominated data is calculated using 1-second bins in cleaned event files. If a bin has >2000 counts, and if more than 50% of those come from <1% of pixels, then it is considered to be noise-dominated and hence unusable.
| Quadrant | # 1 sec bins | Bins with >0 counts | Bins with >2000 counts | High rate bins dominated by noise | Noise dominated (total time) | Noise dominated (detector-on time) | Marked lightcurve |
|---|---|---|---|---|---|---|---|
| A | 2678 | 2678 | 1 | 1 | 0.04% | 0.04% | 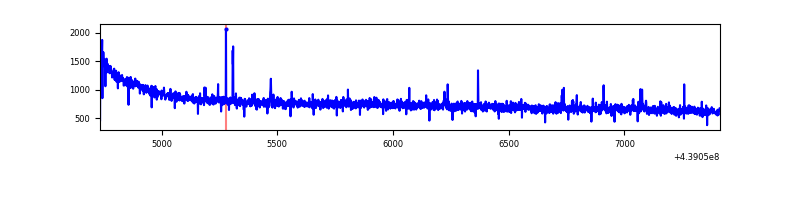 |
| B | 2678 | 2678 | 27 | 27 | 1.01% | 1.01% | 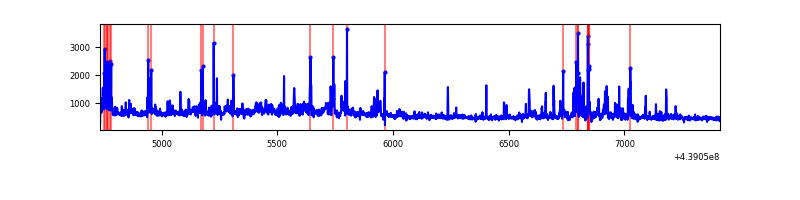 |
| C | 2679 | 2679 | 12 | 12 | 0.45% | 0.45% | 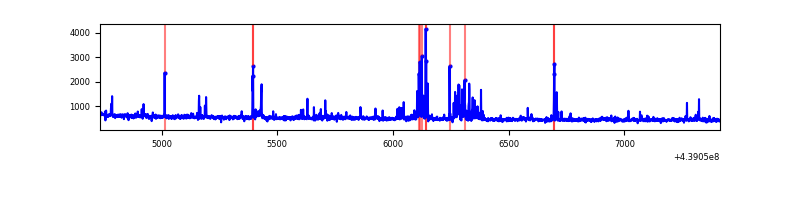 |
| D | 2679 | 2679 | 176 | 176 | 6.57% | 6.57% | 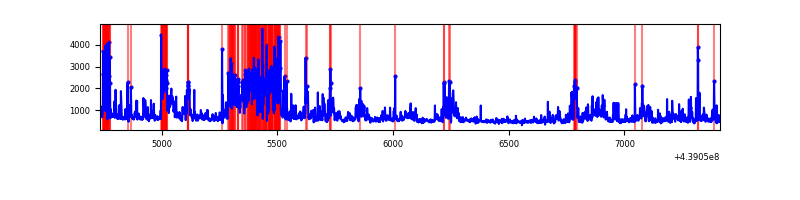 |
Top three noisy pixels from each quadrant. If the there are fewer than three noisy pixels in the level2.evt file, extra rows are filled as -1
| Pixel properties | Quadrant properties | ||||||
|---|---|---|---|---|---|---|---|
| Quadrant | DetID | PixID | Counts | Sigma | Mean | Median | Sigma |
| A | 10 | 83 | 706245 | 9997.14 | 341 | 334 | 70.6 |
| A | 2 | 79 | 15276 | 211.61 | 341 | 334 | 70.6 |
| A | 15 | 174 | 5619 | 74.85 | 341 | 334 | 70.6 |
| B | 5 | 172 | 129726 | 1986.95 | 336 | 328 | 65.1 |
| B | 0 | 200 | 68562 | 1047.75 | 336 | 328 | 65.1 |
| B | 0 | 219 | 57426 | 876.76 | 336 | 328 | 65.1 |
| C | 14 | 254 | 111455 | 1416.03 | 333 | 336 | 78.5 |
| C | 4 | 254 | 35438 | 447.32 | 333 | 336 | 78.5 |
| C | 12 | 249 | 5054 | 60.12 | 333 | 336 | 78.5 |
| D | 11 | 176 | 527507 | 6481.43 | 323 | 313 | 81.3 |
| D | 1 | 52 | 164543 | 2019.08 | 323 | 313 | 81.3 |
| D | 13 | 171 | 109326 | 1340.23 | 323 | 313 | 81.3 |
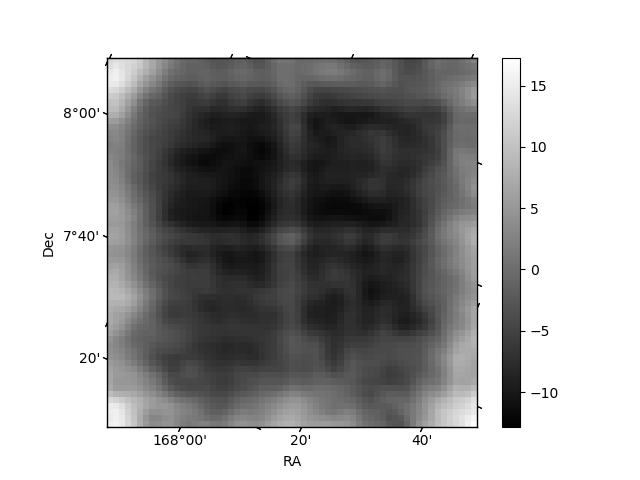
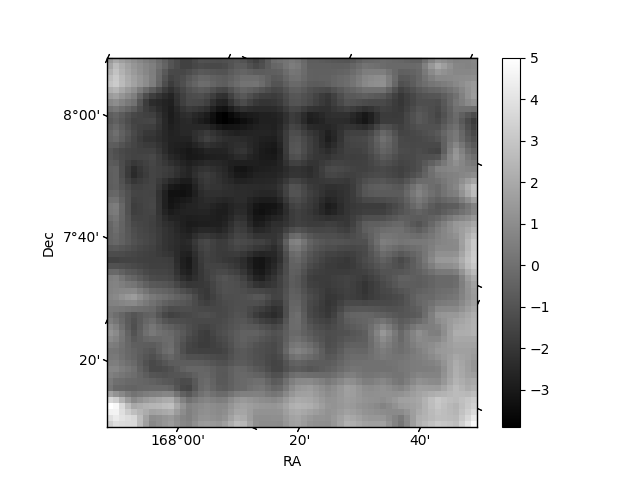
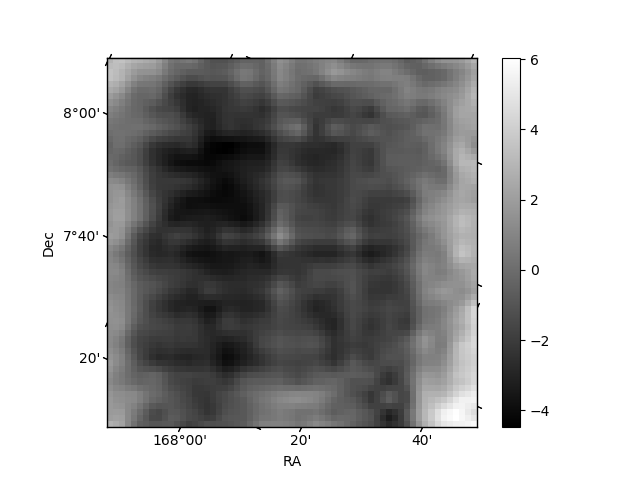
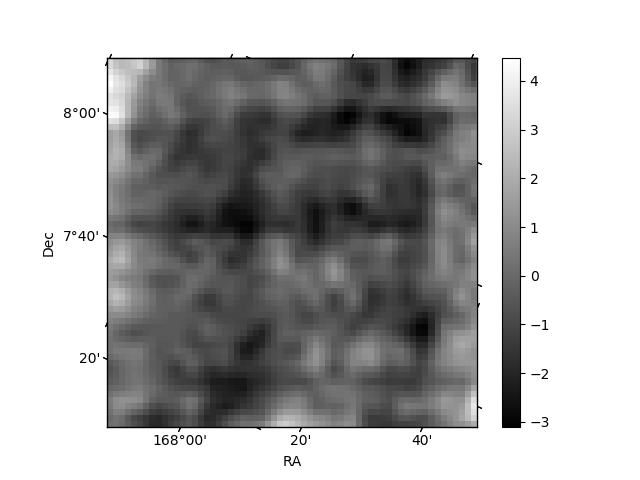
Histogram calculated using DETX and DETY for each event in the final _common_clean file
| Quadrant A | 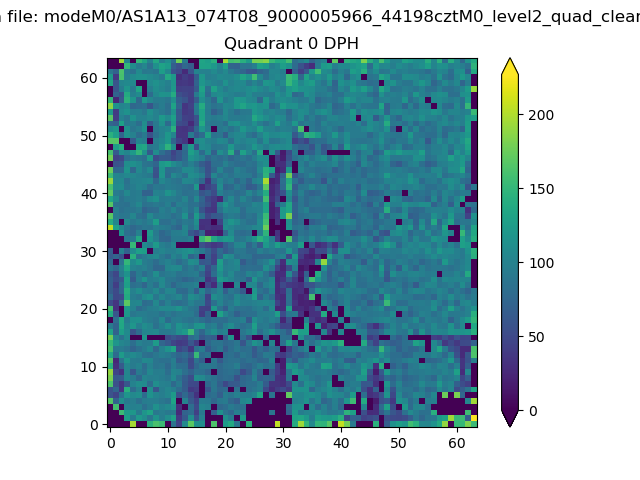 |
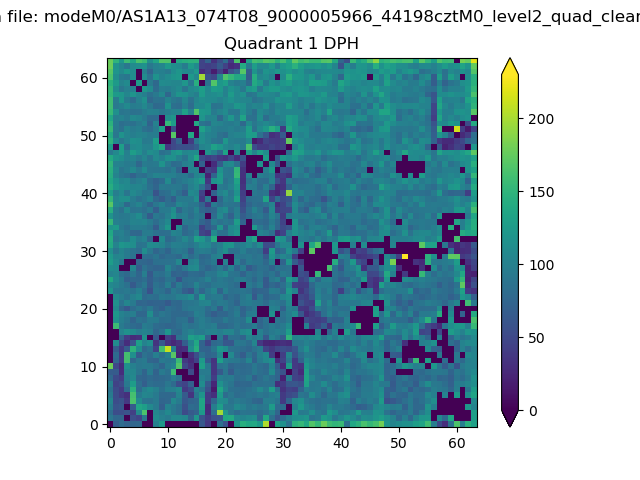 |
Quadrant B |
|---|---|---|---|
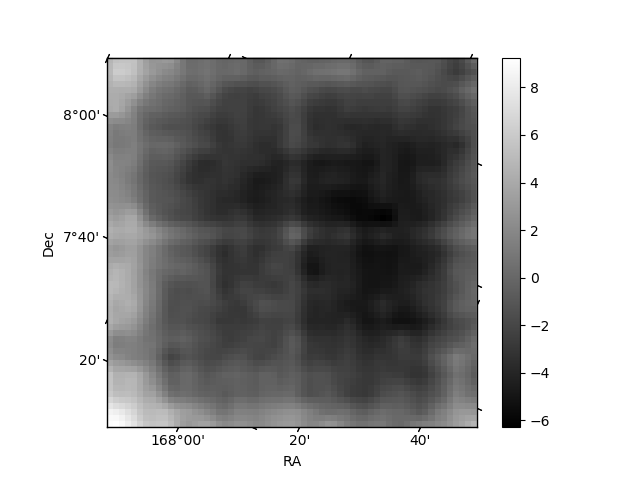
| Quadrant D | 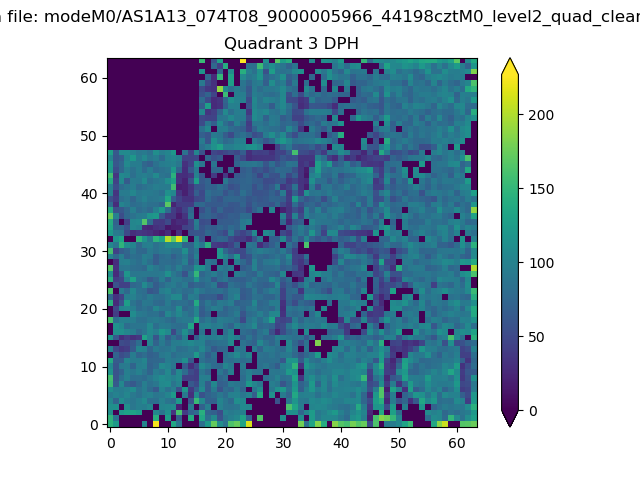 |
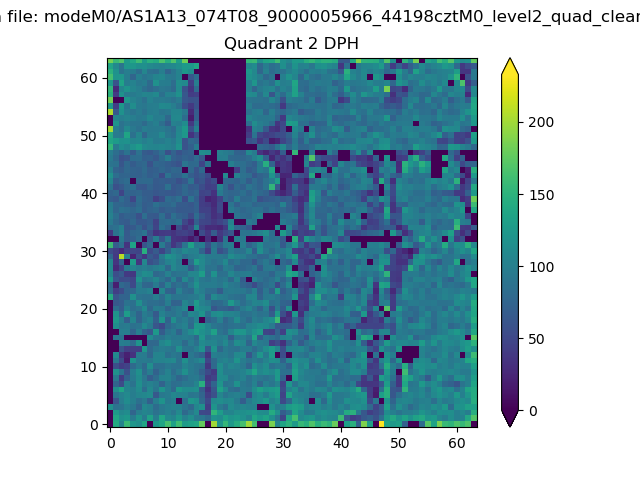 |
Quadrant C |
| Plot type | Count rate plots | Images |
|---|---|---|
| Comparison with Poisson distribution Blue bars denote a histogram of data divided into 1 sec bins. Red curve is a Poisson curve with rate = median count rate of data. |
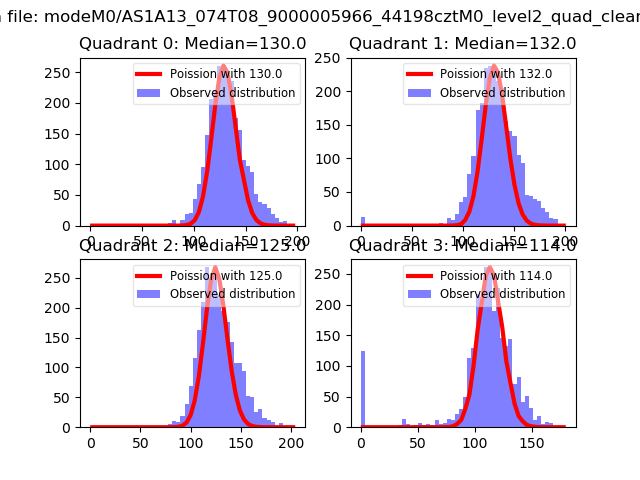 |
 |
| Quadrant-wise count rates Data is divided into 100 sec bins |
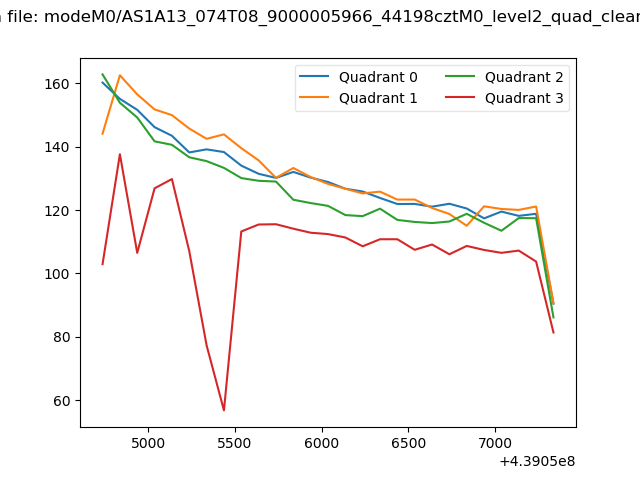 |
|
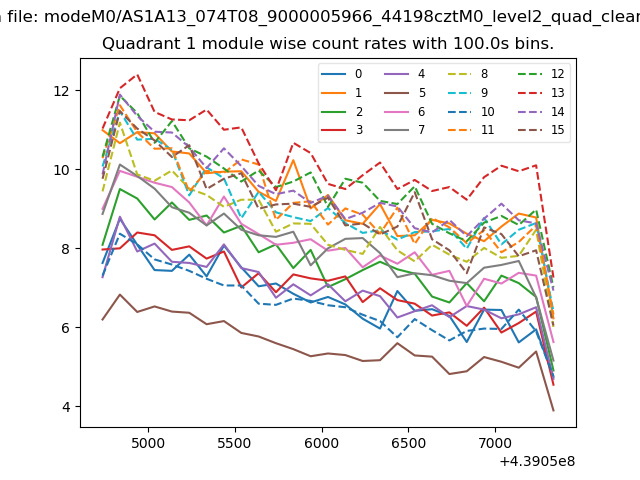
| Module-wise count rates for Quadrant A Data is divided into 100 sec bins |
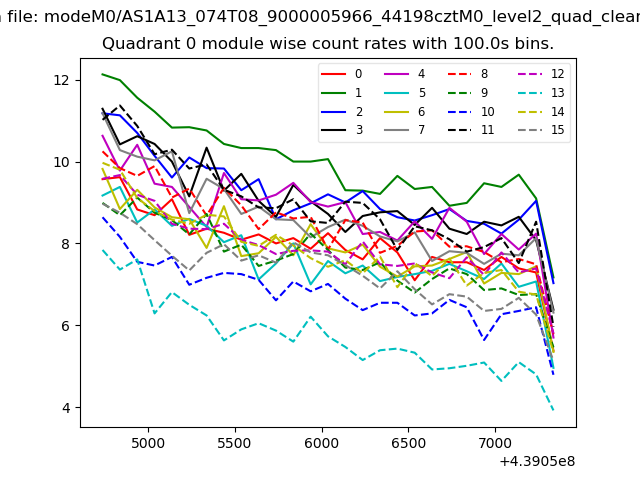 |
 |
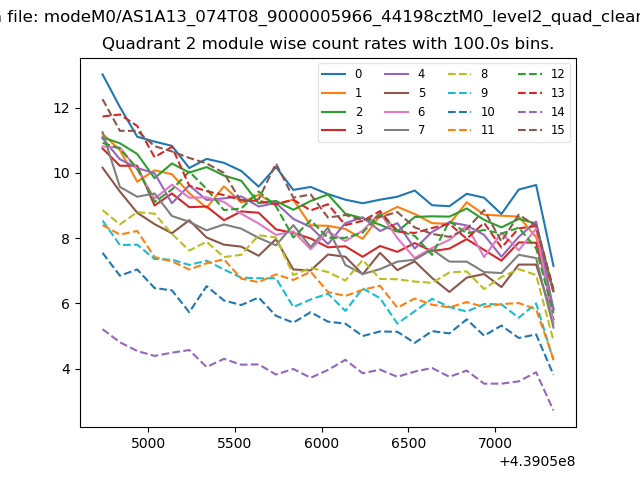
| Module-wise count rates for Quadrant B Data is divided into 100 sec bins |
 |
 |
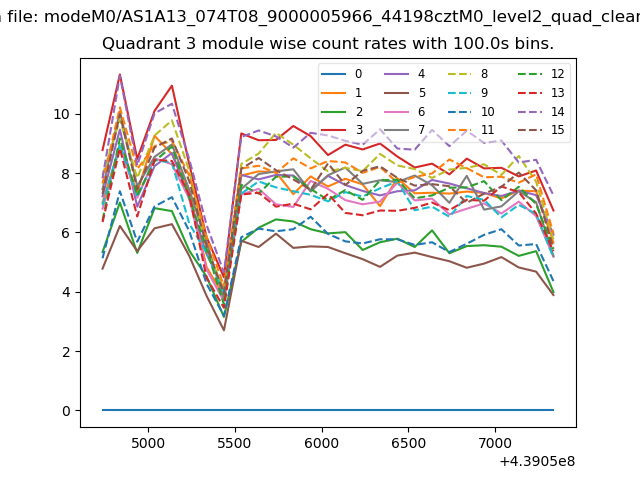
| Module-wise count rates for Quadrant C Data is divided into 100 sec bins |
 |
 |
| Module-wise count rates for Quadrant D Data is divided into 100 sec bins |
 |
 |
| Parameter | Plot |
|---|---|
| CZT HV Monitor | 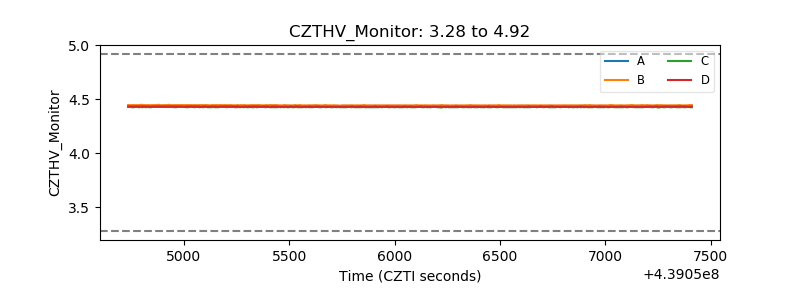 |
| D_VDD | 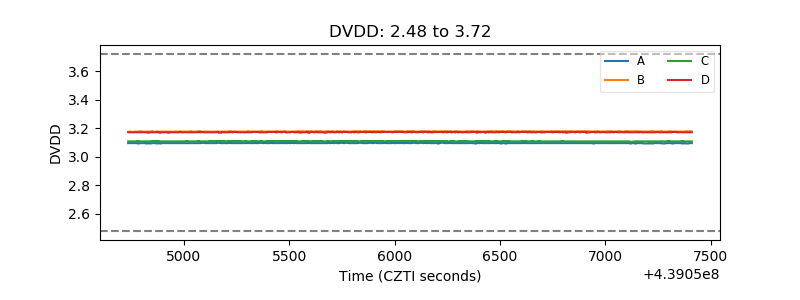 |
| Temperature 1 | 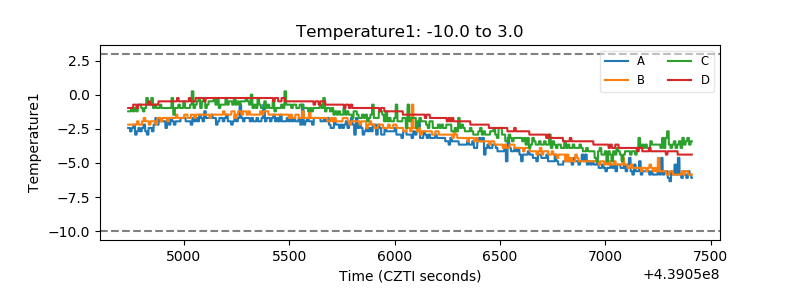 |
| Veto HV Monitor | 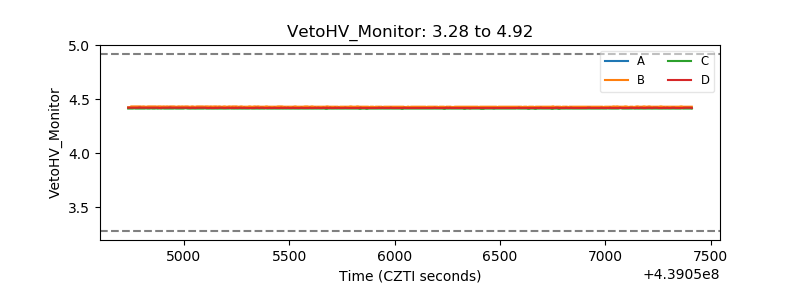 |
| Veto LLD | 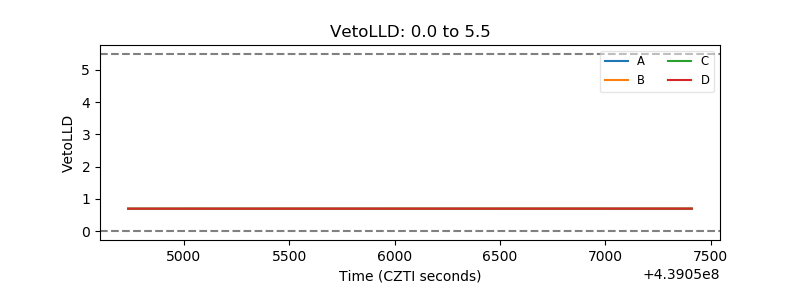 |
| Alpha Counter | 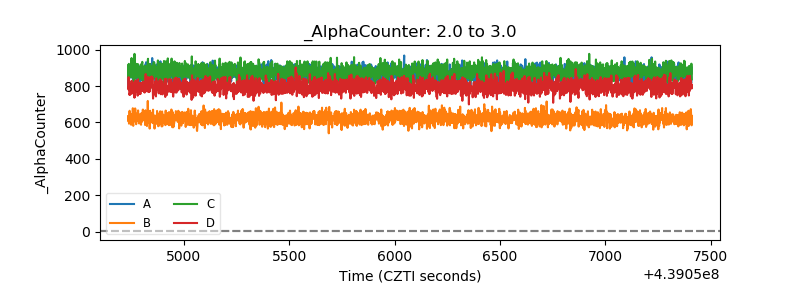 |
| _CPM_Rate | 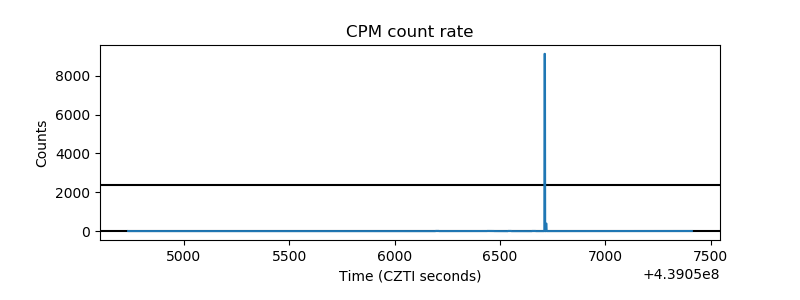 |
| CZT Counter | 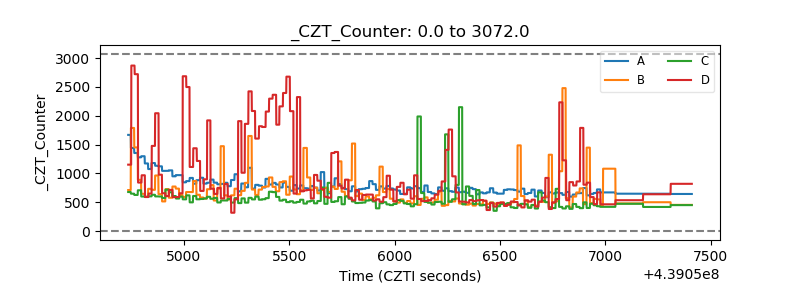 |
| +2.5 Volts monitor | 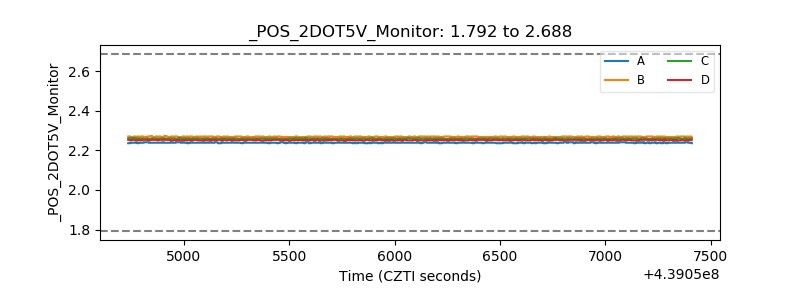 |
| +5 Volts monitor | 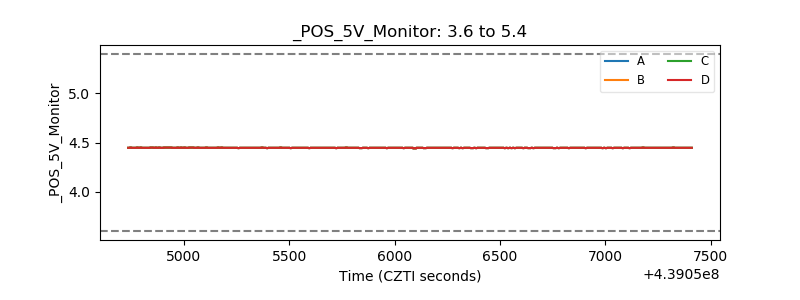 |
| _ROLL_ROT | 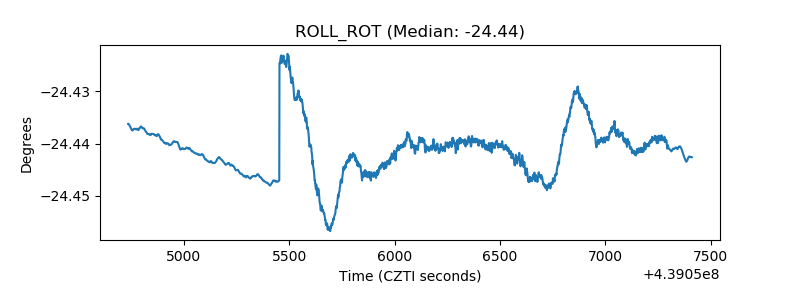 |
| _Roll_DEC | 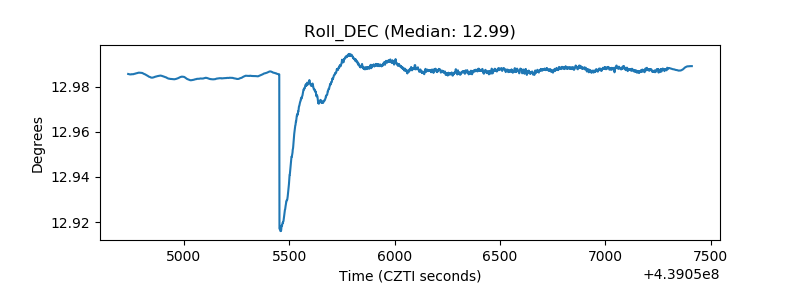 |
| _Roll_RA | 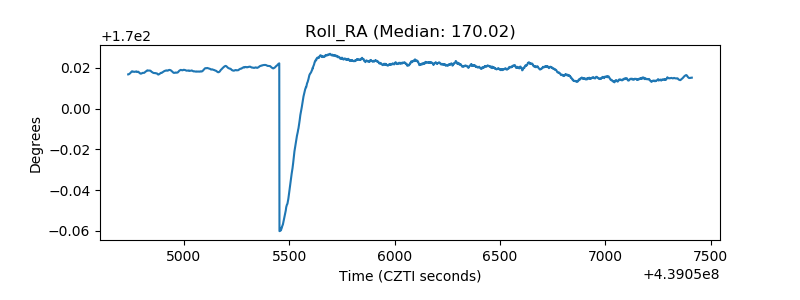 |
| Veto Counter | 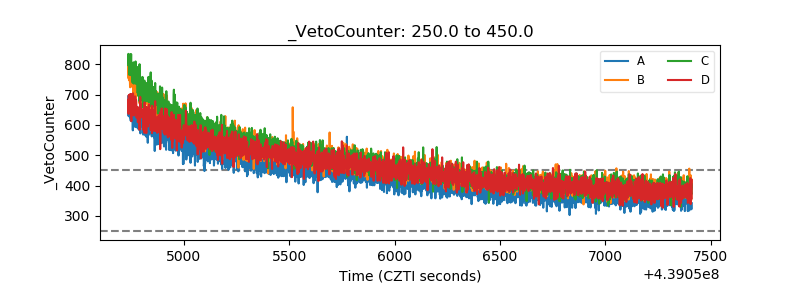 |