| Param | Original file | Final file |
|---|---|---|
| Filename | modeM0/AS1A13_074T09_9000005968_44198cztM0_level2.fits | modeM0/AS1A13_074T09_9000005968_44198cztM0_level2_quad_clean.evt |
| Size (bytes) | 262,759,680 | 63,241,920 |
| Size | 250.6 MB | 60.3 MB |
| Events in quadrant A | 2,633,374 | 423,625 |
| Events in quadrant B | 2,060,424 | 443,457 |
| Events in quadrant C | 1,995,921 | 426,963 |
| Events in quadrant D | 2,767,477 | 376,430 |
| Mode SS | |||
|---|---|---|---|
| Quadrant | BADHDUFLAG | Total packets | Discarded packets |
| A | 0 | 72 | 0 |
| B | 0 | 72 | 0 |
| C | 0 | 72 | 0 |
| D | 0 | 72 | 0 |
| Mode M0 | |||
|---|---|---|---|
| Quadrant | BADHDUFLAG | Total packets | Discarded packets |
| A | 0 | 10447 | 1 |
| B | 0 | 8447 | 1 |
| C | 0 | 8237 | 1 |
| D | 0 | 10683 | 2 |
| Mode M9 | |||
|---|---|---|---|
| Quadrant | BADHDUFLAG | Total packets | Discarded packets |
| A | 0 | 12 | 0 |
| B | 0 | 12 | 0 |
| C | 0 | 12 | 0 |
| D | 0 | 12 | 0 |
| Quadrant | Total seconds | Saturated seconds | Saturation percentage |
|---|---|---|---|
| A | 3448 | 159 | 4.611369% |
| B | 3448 | 127 | 3.683295% |
| C | 3448 | 95 | 2.755220% |
| D | 3447 | 231 | 6.701480% |
Noise dominated data is calculated using 1-second bins in cleaned event files. If a bin has >2000 counts, and if more than 50% of those come from <1% of pixels, then it is considered to be noise-dominated and hence unusable.
| Quadrant | # 1 sec bins | Bins with >0 counts | Bins with >2000 counts | High rate bins dominated by noise | Noise dominated (total time) | Noise dominated (detector-on time) | Marked lightcurve |
|---|---|---|---|---|---|---|---|
| A | 4668 | 3449 | 7 | 7 | 0.15% | 0.20% | 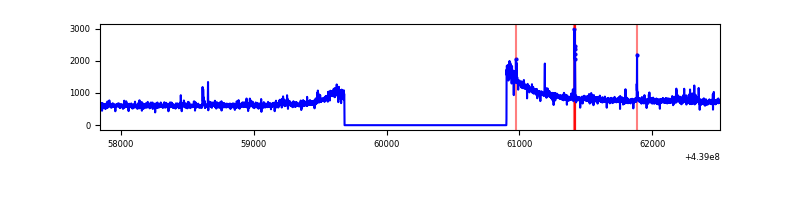 |
| B | 4668 | 3449 | 23 | 23 | 0.49% | 0.67% | 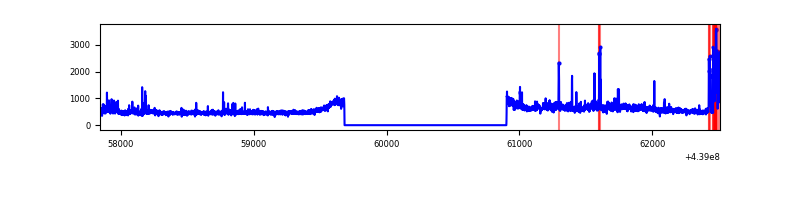 |
| C | 4668 | 3449 | 22 | 22 | 0.47% | 0.64% | 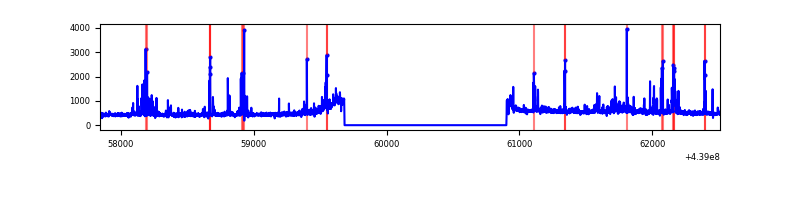 |
| D | 4667 | 3448 | 126 | 126 | 2.70% | 3.65% | 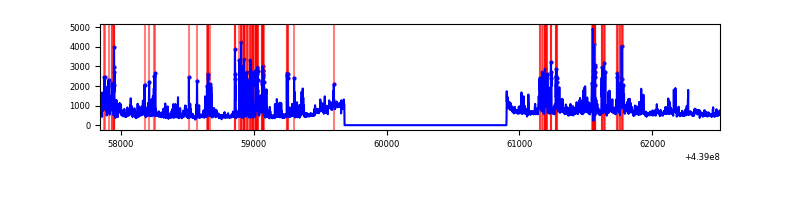 |
Top three noisy pixels from each quadrant. If the there are fewer than three noisy pixels in the level2.evt file, extra rows are filled as -1
| Pixel properties | Quadrant properties | ||||||
|---|---|---|---|---|---|---|---|
| Quadrant | DetID | PixID | Counts | Sigma | Mean | Median | Sigma |
| A | 10 | 83 | 845202 | 9068.92 | 443 | 434 | 93.1 |
| A | 2 | 79 | 46153 | 490.81 | 443 | 434 | 93.1 |
| A | 15 | 223 | 11356 | 117.25 | 443 | 434 | 93.1 |
| B | 5 | 172 | 93608 | 1064.34 | 442 | 430 | 87.5 |
| B | 0 | 230 | 70147 | 796.36 | 442 | 430 | 87.5 |
| B | 0 | 219 | 42091 | 475.88 | 442 | 430 | 87.5 |
| C | 14 | 254 | 197124 | 1867.68 | 442 | 445 | 105.3 |
| C | 4 | 254 | 45916 | 431.8 | 442 | 445 | 105.3 |
| C | 3 | 233 | 13797 | 126.79 | 442 | 445 | 105.3 |
| D | 13 | 249 | 304719 | 2744.6 | 431 | 417 | 110.9 |
| D | 5 | 222 | 185013 | 1664.93 | 431 | 417 | 110.9 |
| D | 11 | 176 | 177326 | 1595.6 | 431 | 417 | 110.9 |
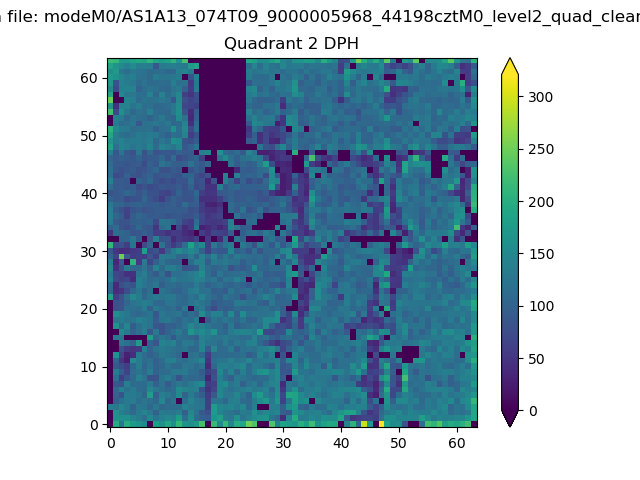
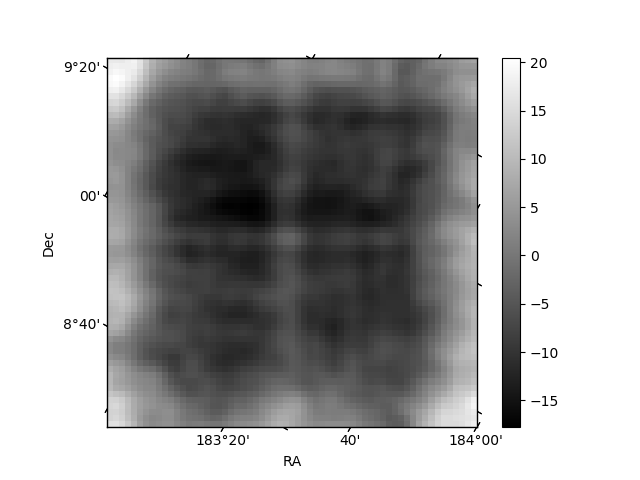
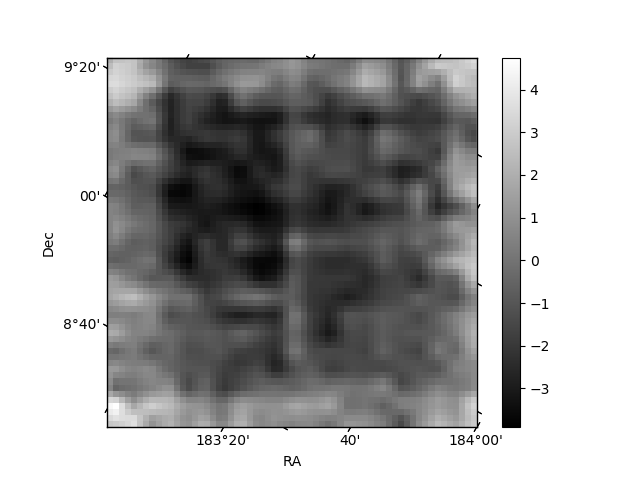
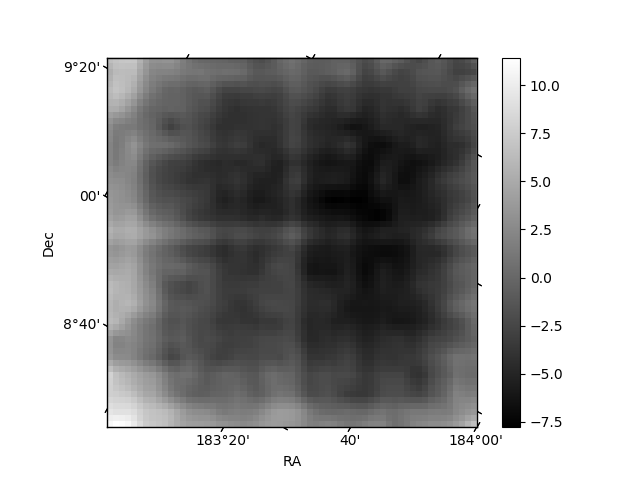
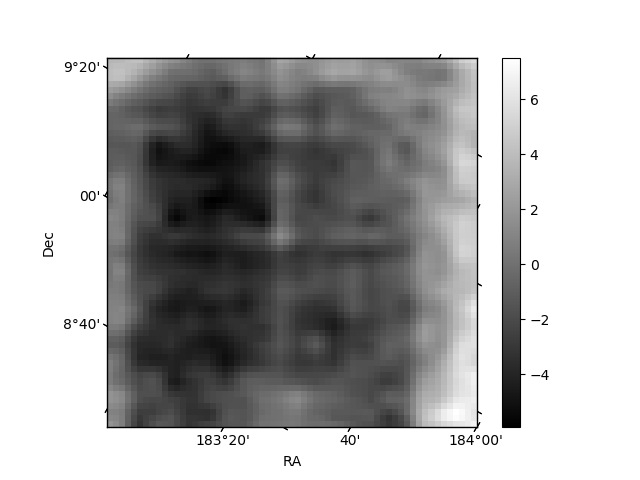
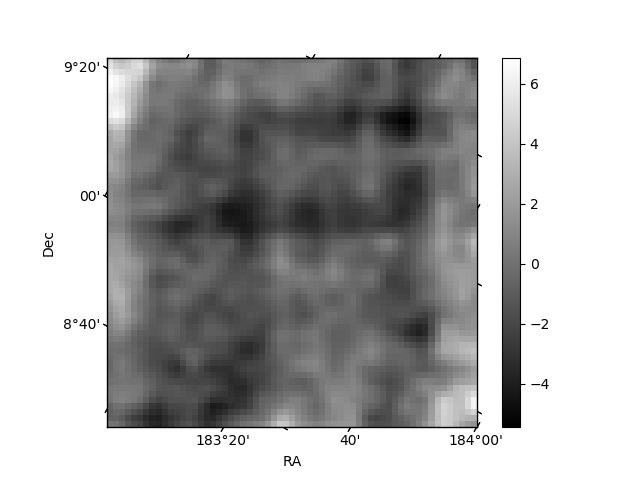
Histogram calculated using DETX and DETY for each event in the final _common_clean file
| Quadrant A | 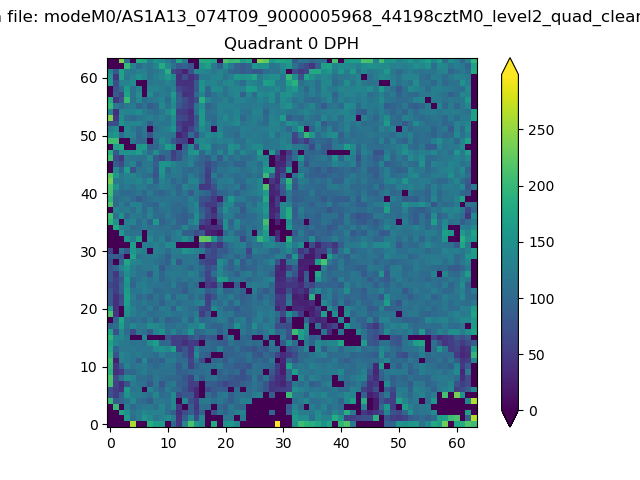 |
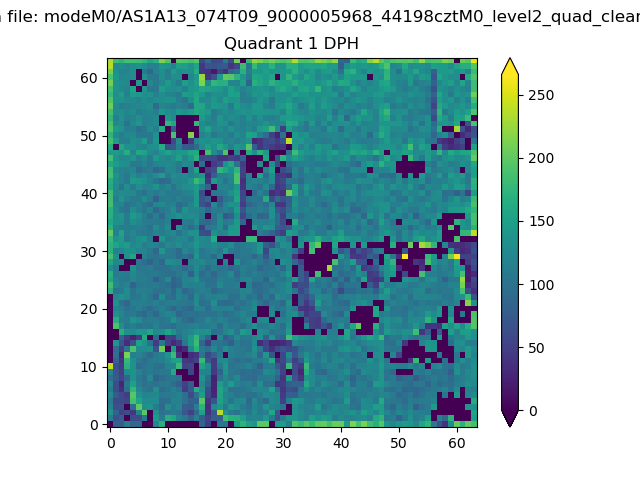 |
Quadrant B |
|---|---|---|---|
| Quadrant D | 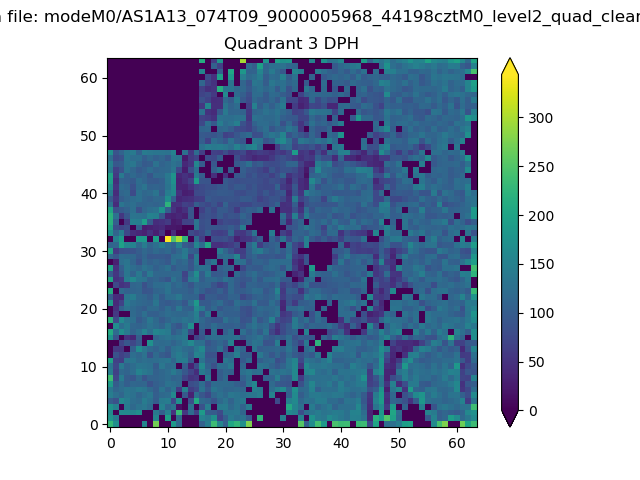 |
 |
Quadrant C |
| Plot type | Count rate plots | Images |
|---|---|---|
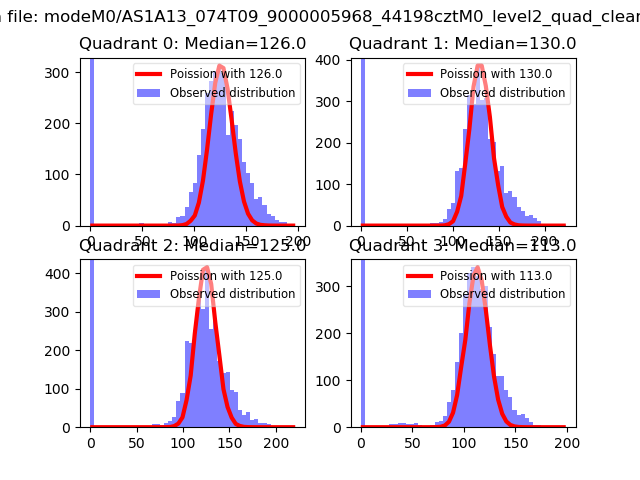
| Comparison with Poisson distribution Blue bars denote a histogram of data divided into 1 sec bins. Red curve is a Poisson curve with rate = median count rate of data. |
 |
 |
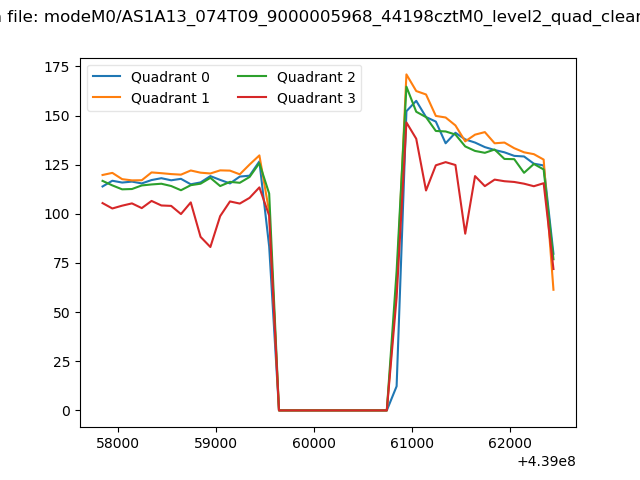
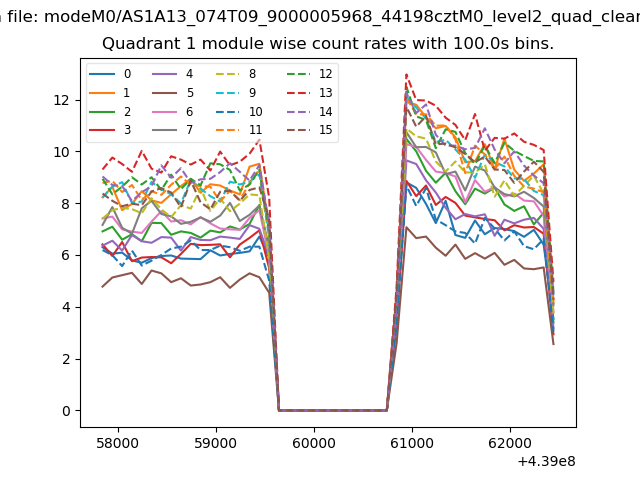
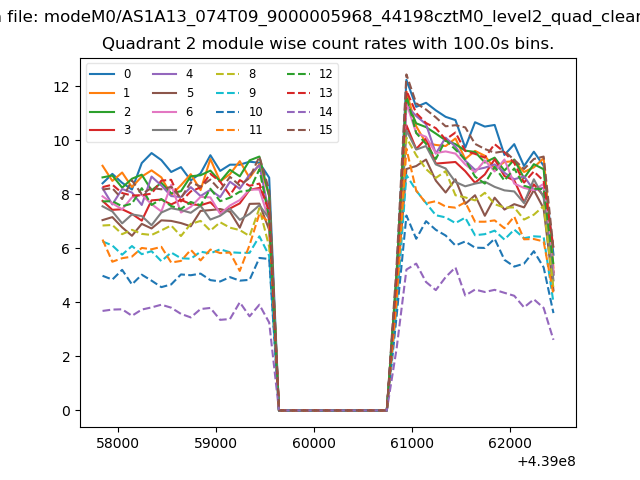
| Quadrant-wise count rates Data is divided into 100 sec bins |
 |
|
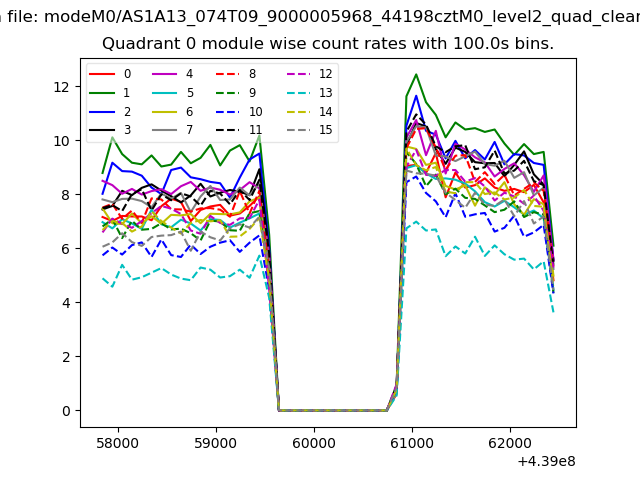
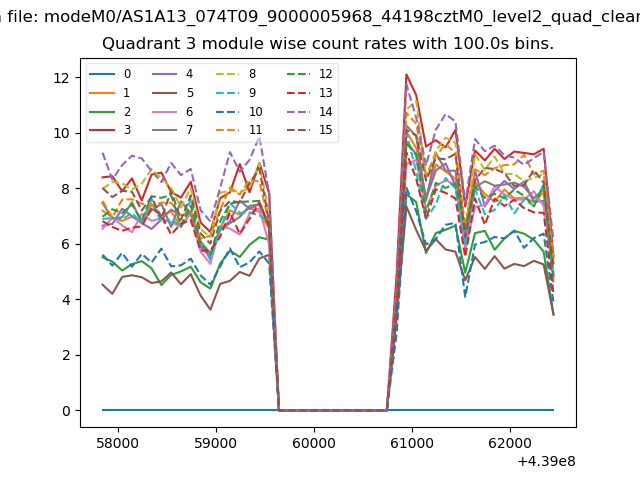
| Module-wise count rates for Quadrant A Data is divided into 100 sec bins |
 |
 |
| Module-wise count rates for Quadrant B Data is divided into 100 sec bins |
 |
 |
| Module-wise count rates for Quadrant C Data is divided into 100 sec bins |
 |
 |
| Module-wise count rates for Quadrant D Data is divided into 100 sec bins |
 |
 |
| Parameter | Plot |
|---|---|
| CZT HV Monitor | 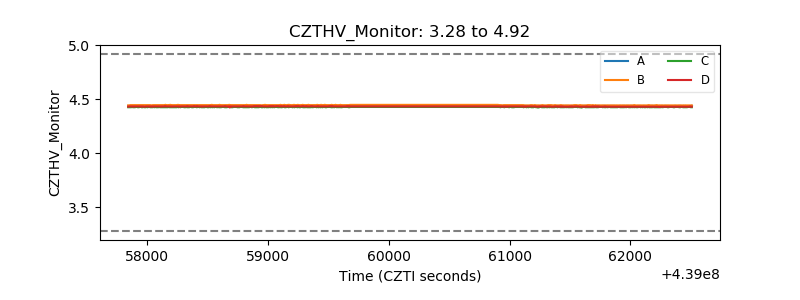 |
| D_VDD | 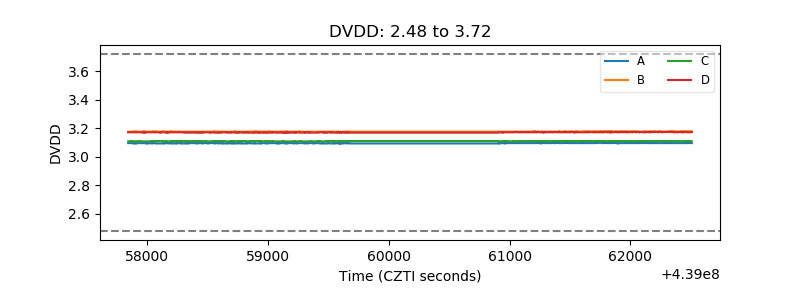 |
| Temperature 1 | 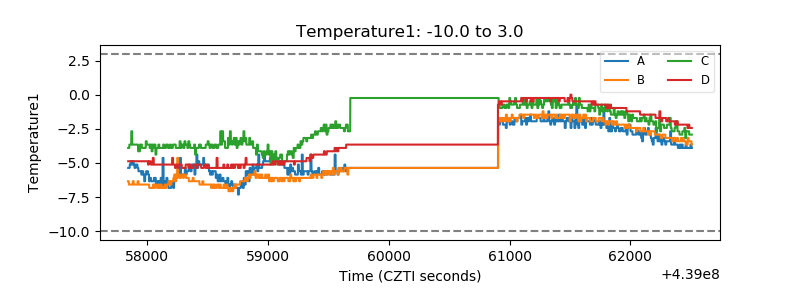 |
| Veto HV Monitor | 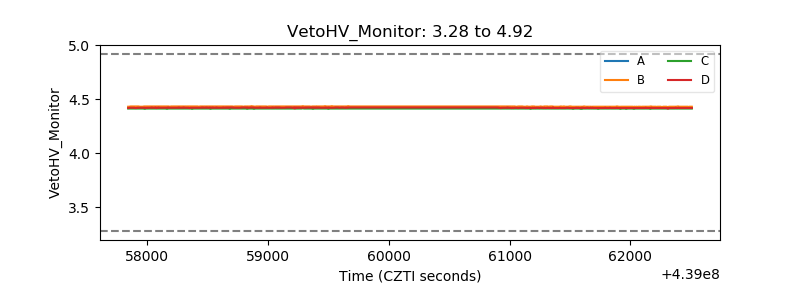 |
| Veto LLD | 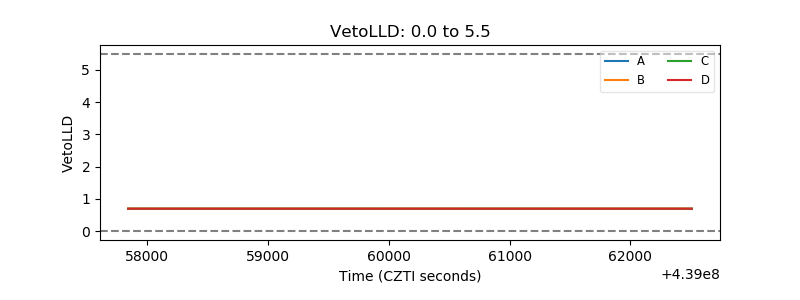 |
| Alpha Counter | 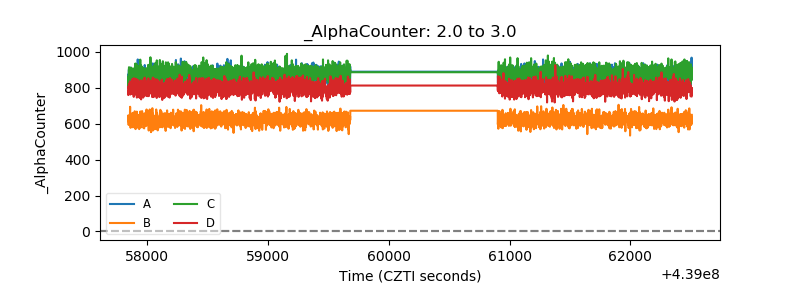 |
| _CPM_Rate | 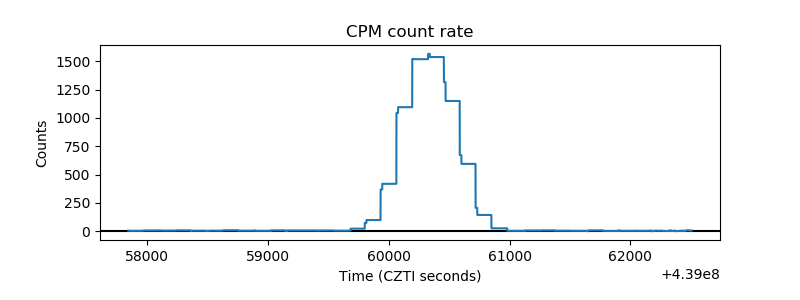 |
| CZT Counter | 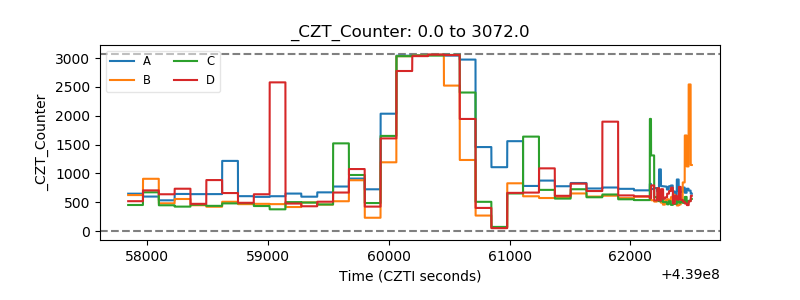 |
| +2.5 Volts monitor |  |
| +5 Volts monitor | 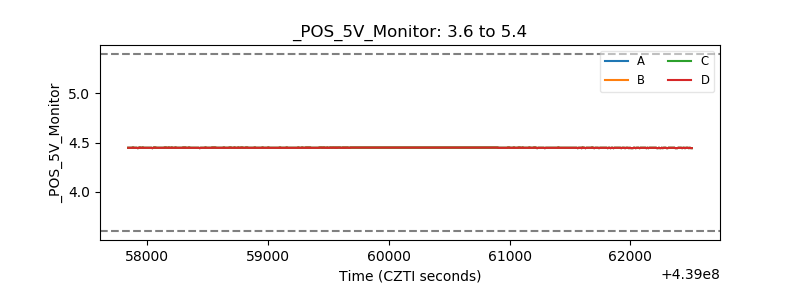 |
| _ROLL_ROT | 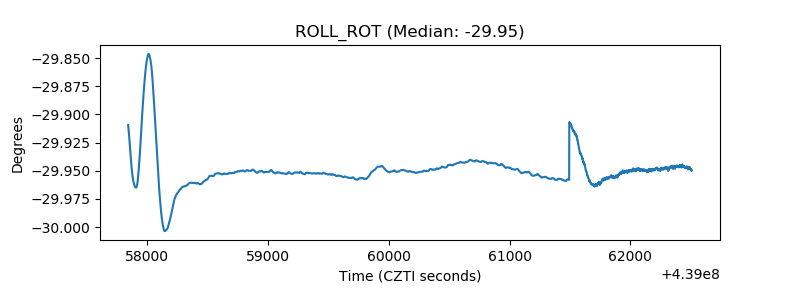 |
| _Roll_DEC | 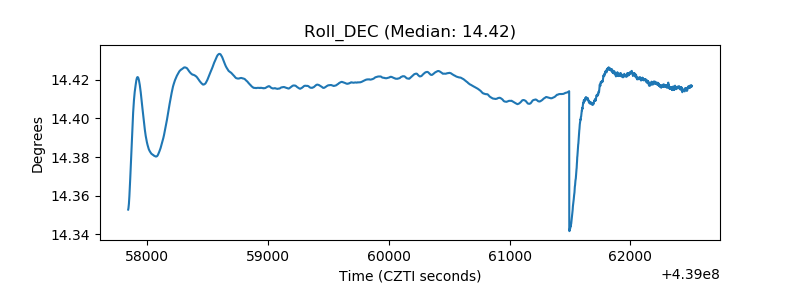 |
| _Roll_RA | 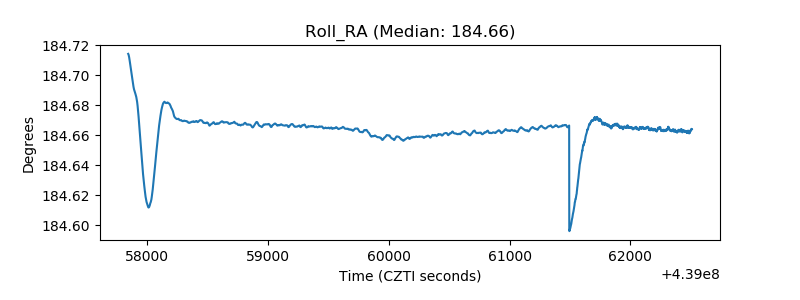 |
| Veto Counter | 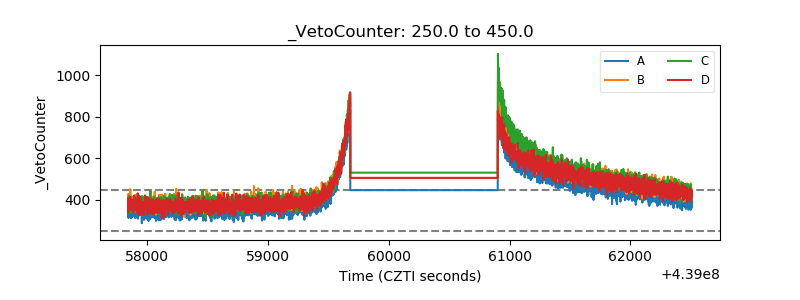 |