| Param | Original file | Final file |
|---|---|---|
| Filename | modeM0/AS1A13_074T09_9000005968_44199cztM0_level2.fits | modeM0/AS1A13_074T09_9000005968_44199cztM0_level2_quad_clean.evt |
| Size (bytes) | 540,023,040 | 115,623,360 |
| Size | 515.0 MB | 110.3 MB |
| Events in quadrant A | 5,046,660 | 801,312 |
| Events in quadrant B | 4,118,458 | 819,096 |
| Events in quadrant C | 3,638,402 | 800,131 |
| Events in quadrant D | 6,682,042 | 627,294 |
| Mode SS | |||
|---|---|---|---|
| Quadrant | BADHDUFLAG | Total packets | Discarded packets |
| A | 0 | 132 | 0 |
| B | 0 | 132 | 0 |
| C | 0 | 132 | 0 |
| D | 0 | 132 | 0 |
| Mode M0 | |||
|---|---|---|---|
| Quadrant | BADHDUFLAG | Total packets | Discarded packets |
| A | 0 | 19966 | 2 |
| B | 0 | 16519 | 2 |
| C | 0 | 15036 | 2 |
| D | 0 | 24386 | 2 |
| Mode M9 | |||
|---|---|---|---|
| Quadrant | BADHDUFLAG | Total packets | Discarded packets |
| A | 0 | 12 | 0 |
| B | 0 | 12 | 0 |
| C | 0 | 12 | 0 |
| D | 0 | 12 | 0 |
| Quadrant | Total seconds | Saturated seconds | Saturation percentage |
|---|---|---|---|
| A | 6500 | 231 | 3.553846% |
| B | 6500 | 304 | 4.676923% |
| C | 6500 | 127 | 1.953846% |
| D | 6500 | 1046 | 16.092308% |
Noise dominated data is calculated using 1-second bins in cleaned event files. If a bin has >2000 counts, and if more than 50% of those come from <1% of pixels, then it is considered to be noise-dominated and hence unusable.
| Quadrant | # 1 sec bins | Bins with >0 counts | Bins with >2000 counts | High rate bins dominated by noise | Noise dominated (total time) | Noise dominated (detector-on time) | Marked lightcurve |
|---|---|---|---|---|---|---|---|
| A | 7710 | 6501 | 8 | 8 | 0.10% | 0.12% | 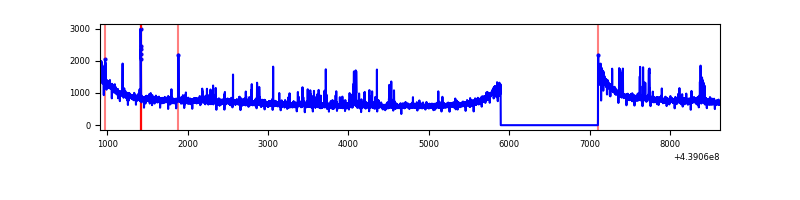 |
| B | 7710 | 6501 | 102 | 102 | 1.32% | 1.57% | 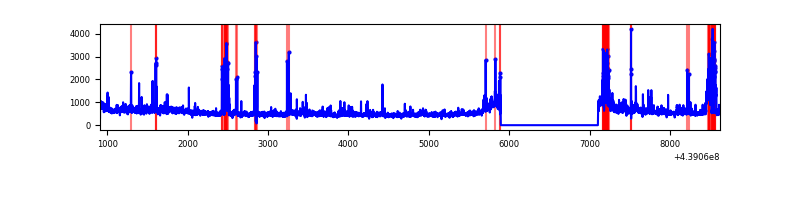 |
| C | 7710 | 6501 | 39 | 39 | 0.51% | 0.60% | 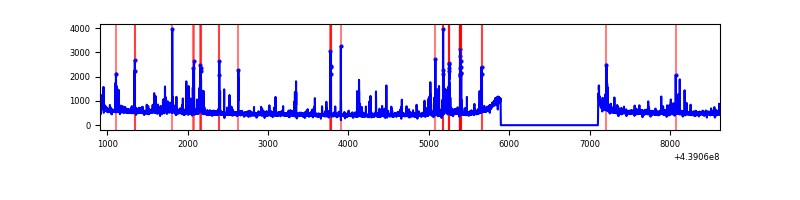 |
| D | 7710 | 6500 | 802 | 802 | 10.40% | 12.34% | 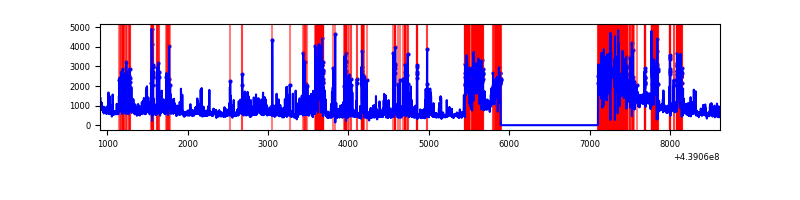 |
Top three noisy pixels from each quadrant. If the there are fewer than three noisy pixels in the level2.evt file, extra rows are filled as -1
| Pixel properties | Quadrant properties | ||||||
|---|---|---|---|---|---|---|---|
| Quadrant | DetID | PixID | Counts | Sigma | Mean | Median | Sigma |
| A | 10 | 83 | 1649619 | 9727.57 | 821 | 806 | 169.5 |
| A | 2 | 79 | 123085 | 721.41 | 821 | 806 | 169.5 |
| A | 0 | 243 | 35240 | 203.15 | 821 | 806 | 169.5 |
| B | 5 | 172 | 300403 | 1912.43 | 812 | 791 | 156.7 |
| B | 5 | 255 | 201943 | 1283.96 | 812 | 791 | 156.7 |
| B | 0 | 219 | 93350 | 590.81 | 812 | 791 | 156.7 |
| C | 14 | 254 | 314399 | 1636.12 | 816 | 823 | 191.7 |
| C | 4 | 254 | 66743 | 343.94 | 816 | 823 | 191.7 |
| C | 3 | 233 | 46752 | 239.64 | 816 | 823 | 191.7 |
| D | 1 | 52 | 1835964 | 9909.98 | 738 | 717 | 185.2 |
| D | 11 | 176 | 450234 | 2427.31 | 738 | 717 | 185.2 |
| D | 8 | 131 | 306557 | 1651.48 | 738 | 717 | 185.2 |
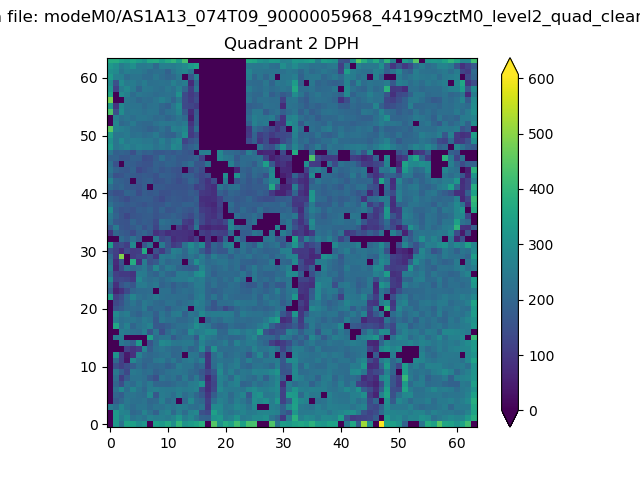
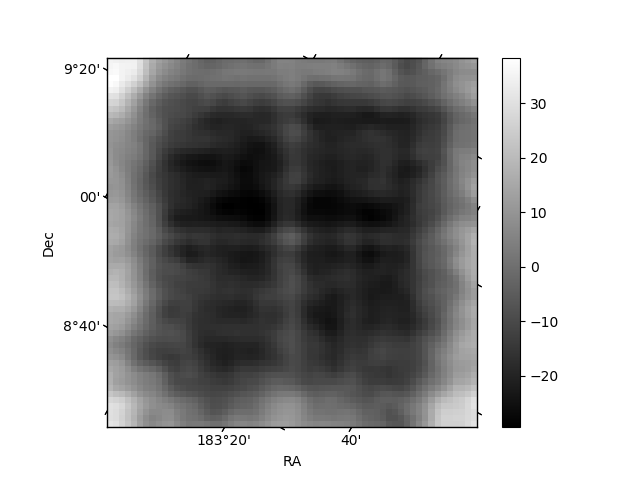
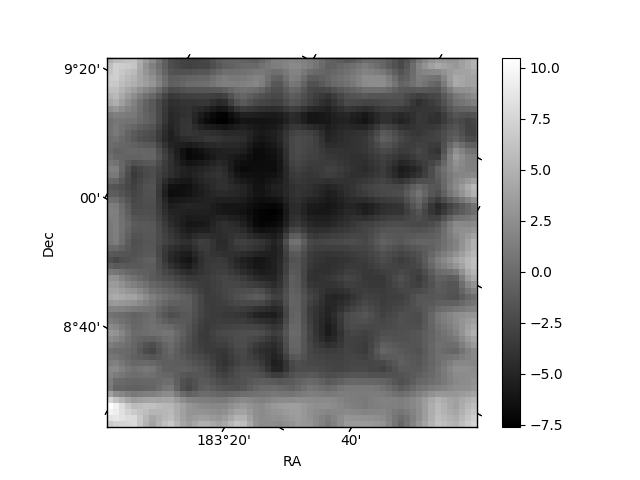
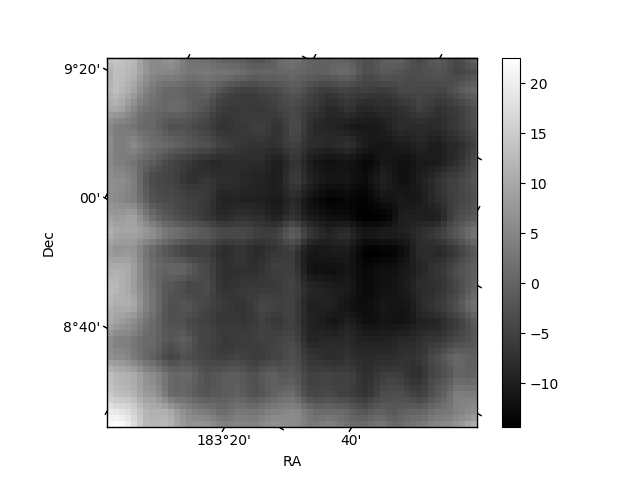
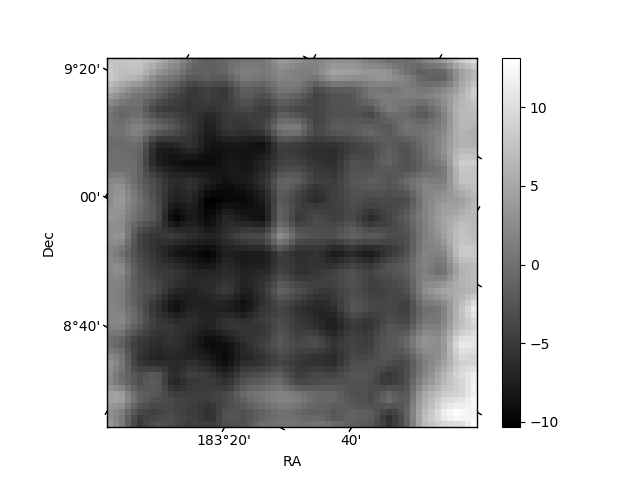
Histogram calculated using DETX and DETY for each event in the final _common_clean file
| Quadrant A | 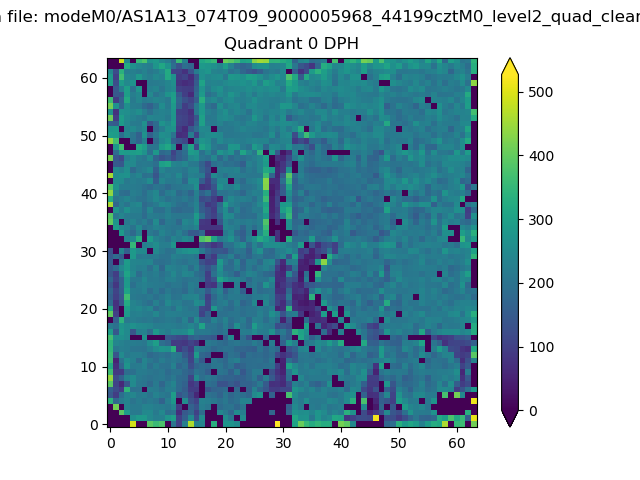 |
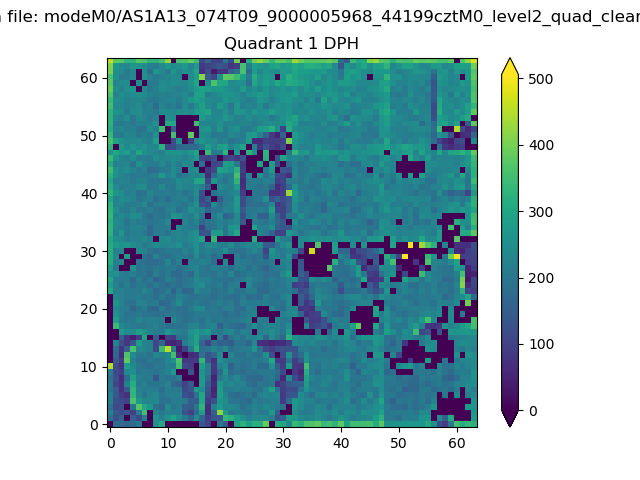 |
Quadrant B |
|---|---|---|---|
| Quadrant D | 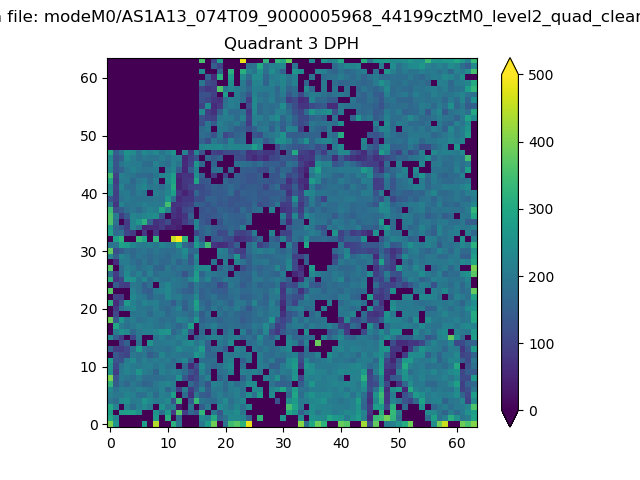 |
 |
Quadrant C |
| Plot type | Count rate plots | Images |
|---|---|---|
| Comparison with Poisson distribution Blue bars denote a histogram of data divided into 1 sec bins. Red curve is a Poisson curve with rate = median count rate of data. |
 |
 |
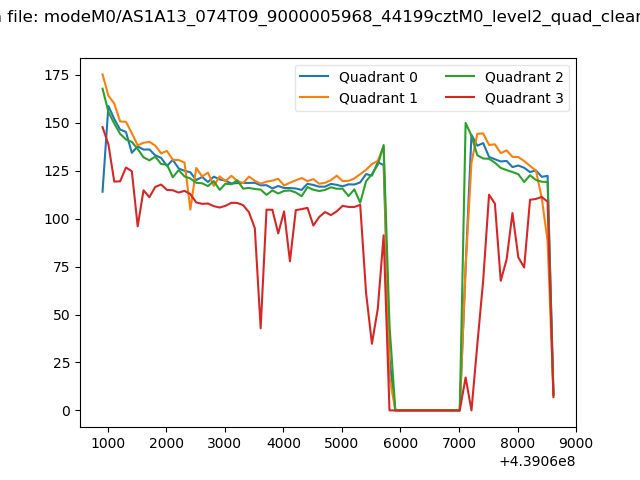
| Quadrant-wise count rates Data is divided into 100 sec bins |
 |
|
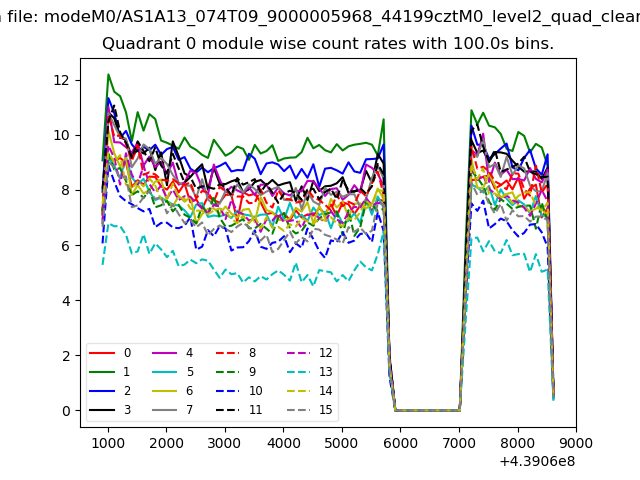
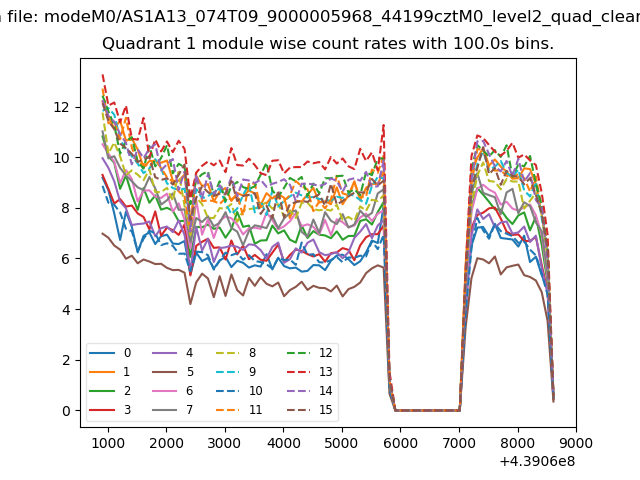
| Module-wise count rates for Quadrant A Data is divided into 100 sec bins |
 |
 |
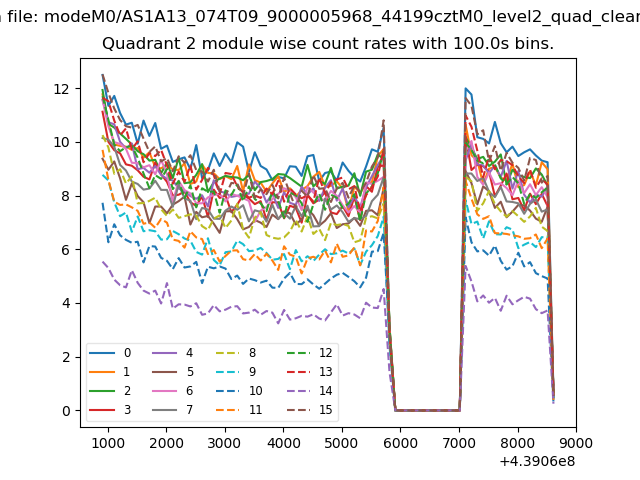
| Module-wise count rates for Quadrant B Data is divided into 100 sec bins |
 |
 |
| Module-wise count rates for Quadrant C Data is divided into 100 sec bins |
 |
 |
| Module-wise count rates for Quadrant D Data is divided into 100 sec bins |
 |
 |
| Parameter | Plot |
|---|---|
| CZT HV Monitor | 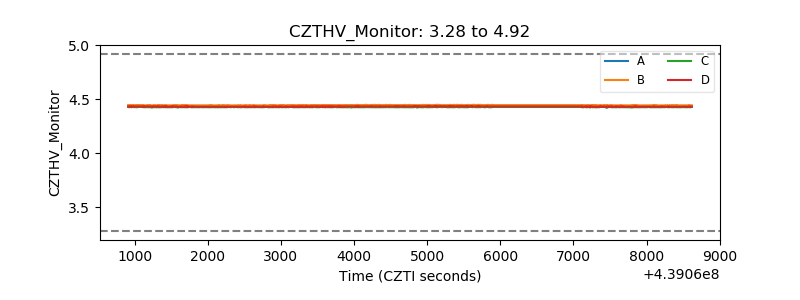 |
| D_VDD | 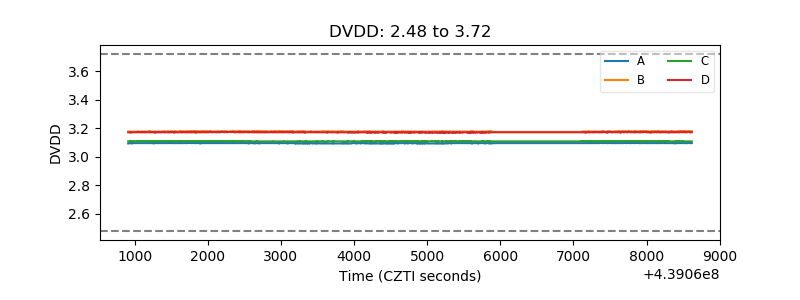 |
| Temperature 1 | 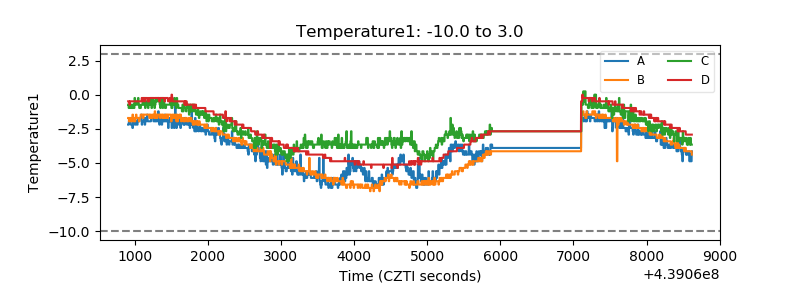 |
| Veto HV Monitor | 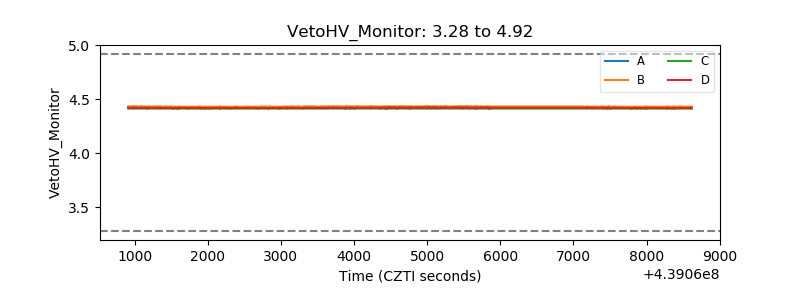 |
| Veto LLD | 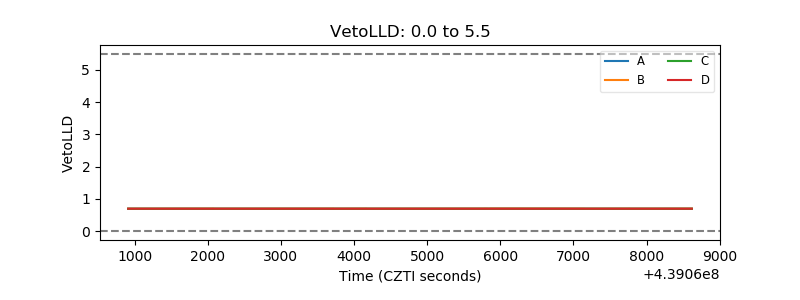 |
| Alpha Counter | 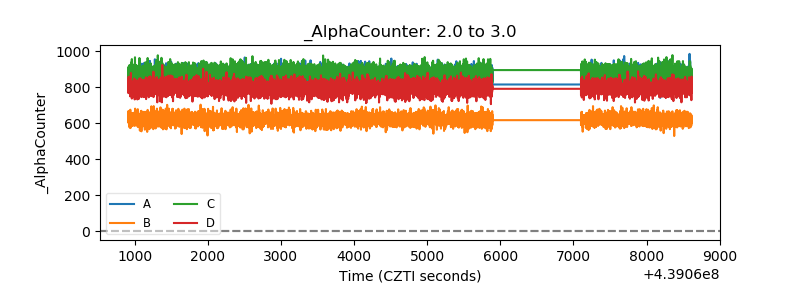 |
| _CPM_Rate | 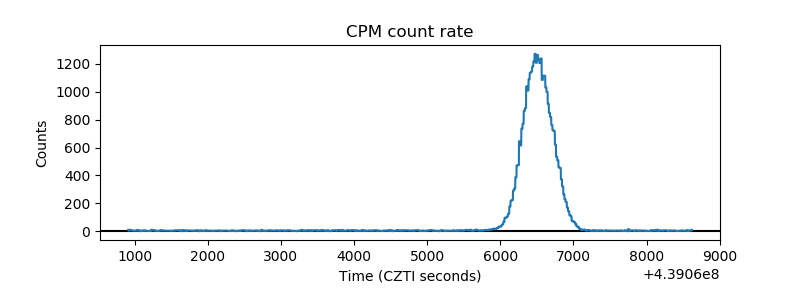 |
| CZT Counter | 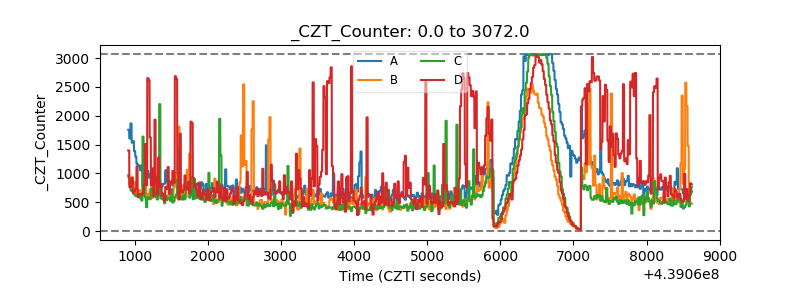 |
| +2.5 Volts monitor | 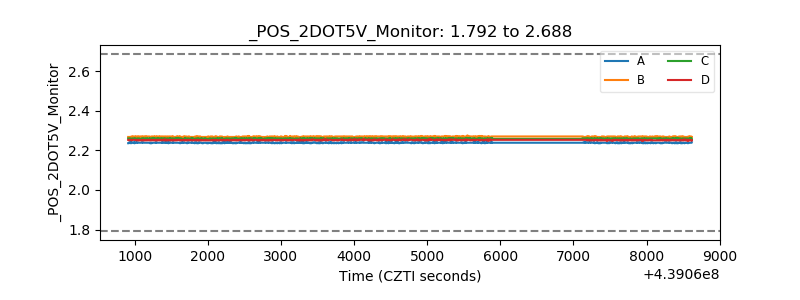 |
| +5 Volts monitor | 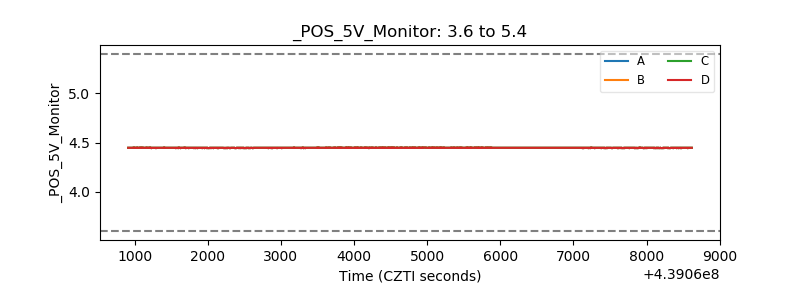 |
| _ROLL_ROT | 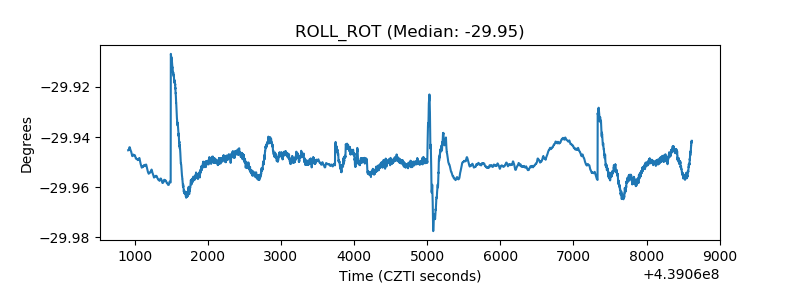 |
| _Roll_DEC | 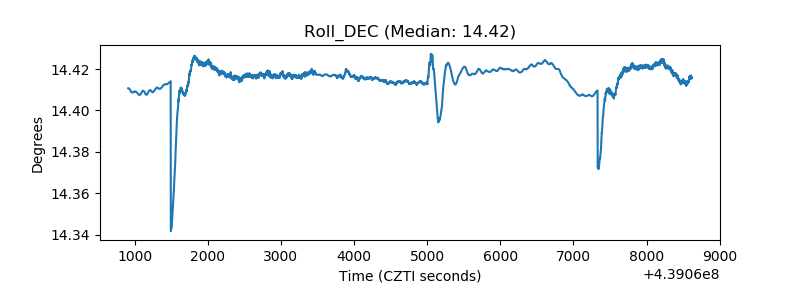 |
| _Roll_RA | 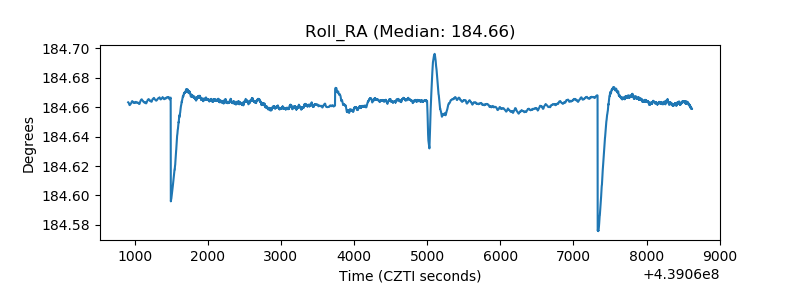 |
| Veto Counter | 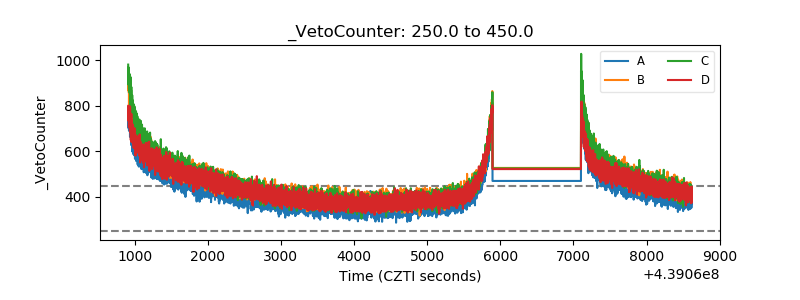 |