| Param | Original file | Final file |
|---|---|---|
| Filename | modeM0/AS1A13_074T09_9000005968_44202cztM0_level2.fits | modeM0/AS1A13_074T09_9000005968_44202cztM0_level2_quad_clean.evt |
| Size (bytes) | 570,352,320 | 123,140,160 |
| Size | 543.9 MB | 117.4 MB |
| Events in quadrant A | 5,611,740 | 822,255 |
| Events in quadrant B | 4,337,312 | 852,952 |
| Events in quadrant C | 3,901,092 | 832,308 |
| Events in quadrant D | 6,668,406 | 688,613 |
| Mode SS | |||
|---|---|---|---|
| Quadrant | BADHDUFLAG | Total packets | Discarded packets |
| A | 0 | 156 | 0 |
| B | 0 | 156 | 0 |
| C | 0 | 156 | 0 |
| D | 0 | 156 | 0 |
| Mode M0 | |||
|---|---|---|---|
| Quadrant | BADHDUFLAG | Total packets | Discarded packets |
| A | 0 | 22269 | 2 |
| B | 0 | 18184 | 2 |
| C | 0 | 17022 | 2 |
| D | 0 | 25245 | 2 |
| Mode M9 | |||
|---|---|---|---|
| Quadrant | BADHDUFLAG | Total packets | Discarded packets |
| A | 0 | 13 | 0 |
| B | 0 | 13 | 0 |
| C | 0 | 13 | 0 |
| D | 0 | 13 | 0 |
| Quadrant | Total seconds | Saturated seconds | Saturation percentage |
|---|---|---|---|
| A | 7653 | 381 | 4.978440% |
| B | 7653 | 271 | 3.541095% |
| C | 7653 | 104 | 1.358944% |
| D | 7654 | 905 | 11.823883% |
Noise dominated data is calculated using 1-second bins in cleaned event files. If a bin has >2000 counts, and if more than 50% of those come from <1% of pixels, then it is considered to be noise-dominated and hence unusable.
| Quadrant | # 1 sec bins | Bins with >0 counts | Bins with >2000 counts | High rate bins dominated by noise | Noise dominated (total time) | Noise dominated (detector-on time) | Marked lightcurve |
|---|---|---|---|---|---|---|---|
| A | 8868 | 7655 | 79 | 79 | 0.89% | 1.03% | 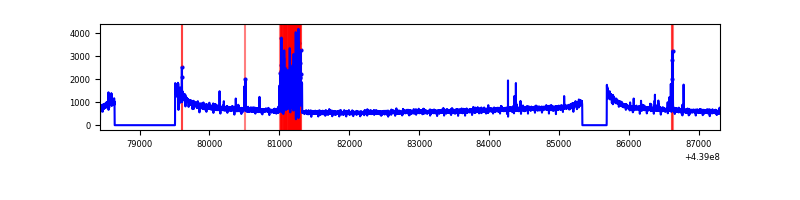 |
| B | 8868 | 7655 | 35 | 35 | 0.39% | 0.46% | 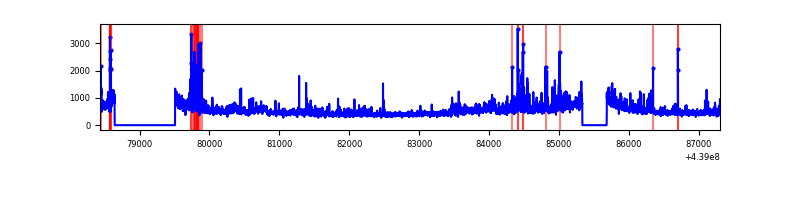 |
| C | 8868 | 7655 | 26 | 26 | 0.29% | 0.34% | 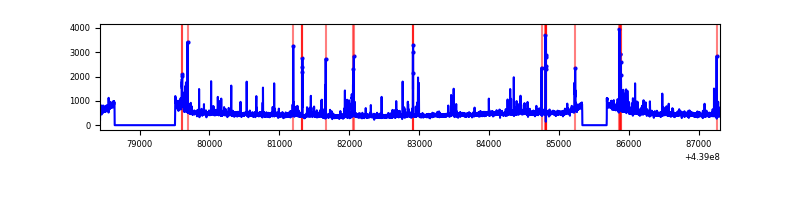 |
| D | 8869 | 7656 | 592 | 592 | 6.67% | 7.73% | 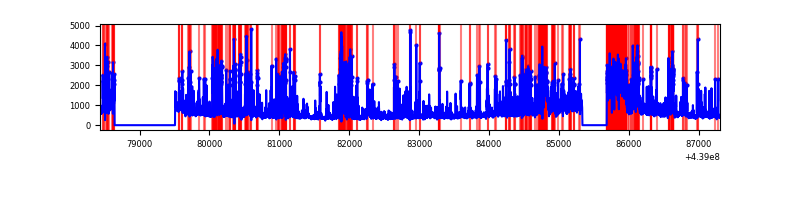 |
Top three noisy pixels from each quadrant. If the there are fewer than three noisy pixels in the level2.evt file, extra rows are filled as -1
| Pixel properties | Quadrant properties | ||||||
|---|---|---|---|---|---|---|---|
| Quadrant | DetID | PixID | Counts | Sigma | Mean | Median | Sigma |
| A | 10 | 83 | 1766179 | 9427.02 | 894 | 875 | 187.3 |
| A | 15 | 223 | 319993 | 1704.14 | 894 | 875 | 187.3 |
| A | 15 | 174 | 30820 | 159.91 | 894 | 875 | 187.3 |
| B | 5 | 172 | 136056 | 763.38 | 896 | 867 | 177.1 |
| B | 0 | 200 | 130025 | 729.32 | 896 | 867 | 177.1 |
| B | 0 | 230 | 89875 | 502.61 | 896 | 867 | 177.1 |
| C | 14 | 254 | 174072 | 824.87 | 887 | 888 | 210.0 |
| C | 3 | 233 | 106914 | 505.0 | 887 | 888 | 210.0 |
| C | 4 | 254 | 97631 | 460.78 | 887 | 888 | 210.0 |
| D | 1 | 52 | 723076 | 3411.85 | 838 | 812 | 211.7 |
| D | 13 | 249 | 722114 | 3407.3 | 838 | 812 | 211.7 |
| D | 12 | 16 | 714442 | 3371.06 | 838 | 812 | 211.7 |
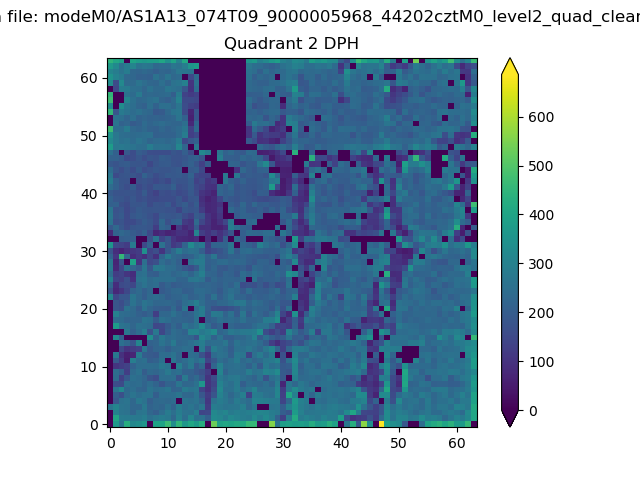
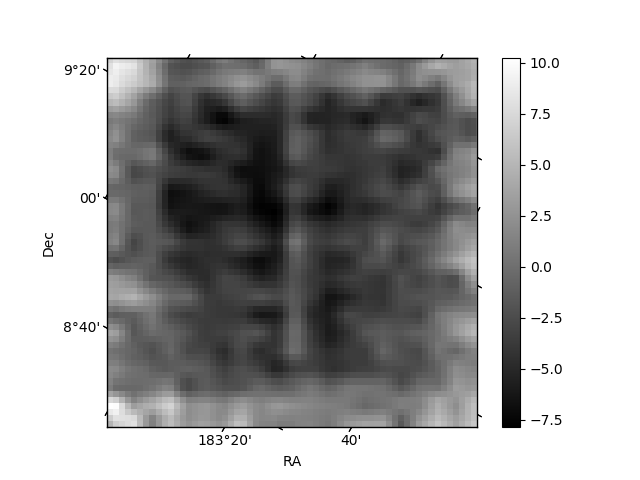
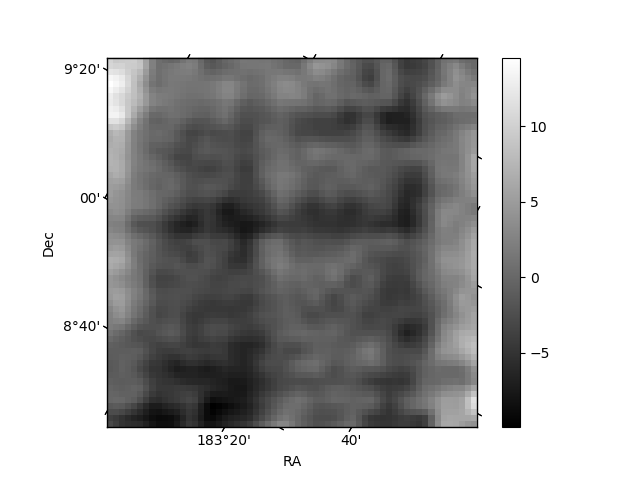
Histogram calculated using DETX and DETY for each event in the final _common_clean file
| Quadrant A |  |
 |
Quadrant B |
|---|---|---|---|
| Quadrant D | 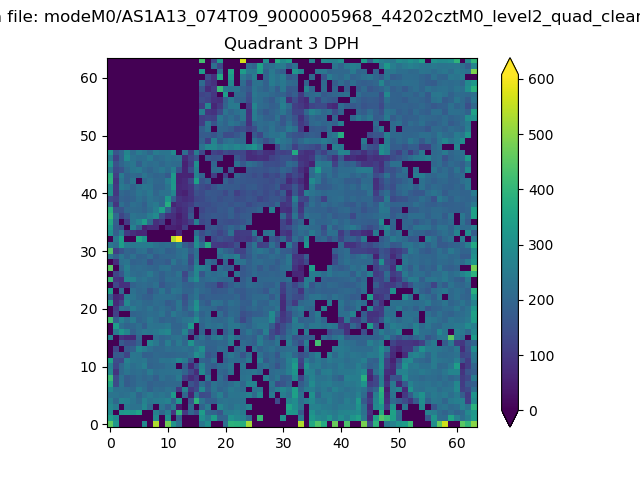 |
 |
Quadrant C |
| Plot type | Count rate plots | Images |
|---|---|---|
| Comparison with Poisson distribution Blue bars denote a histogram of data divided into 1 sec bins. Red curve is a Poisson curve with rate = median count rate of data. |
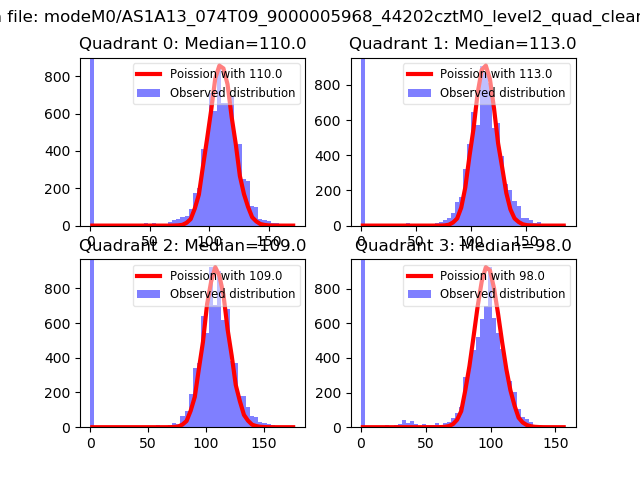 |
 |
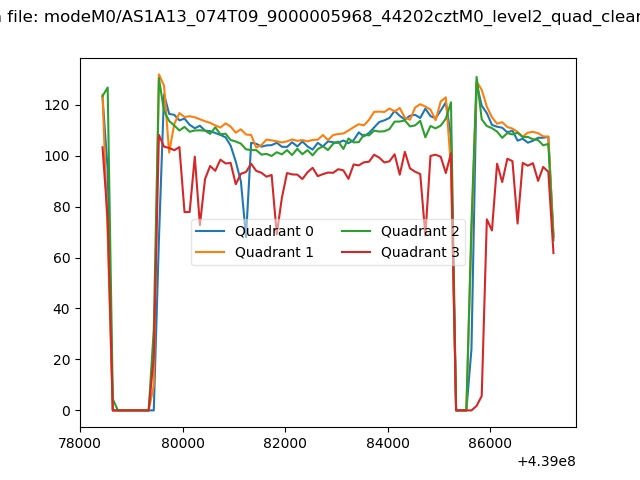
| Quadrant-wise count rates Data is divided into 100 sec bins |
 |
|
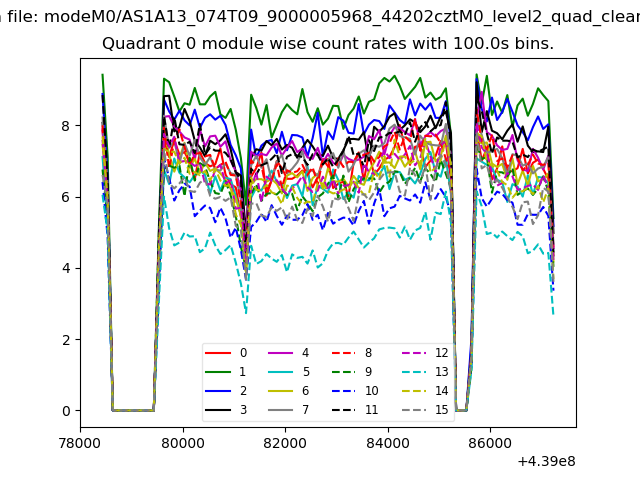
| Module-wise count rates for Quadrant A Data is divided into 100 sec bins |
 |
 |
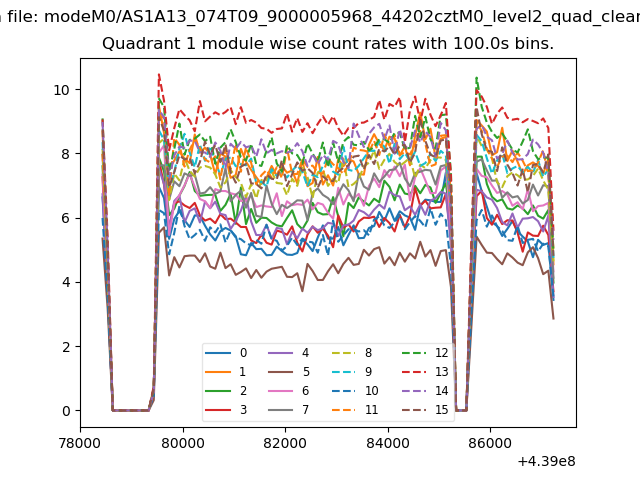
| Module-wise count rates for Quadrant B Data is divided into 100 sec bins |
 |
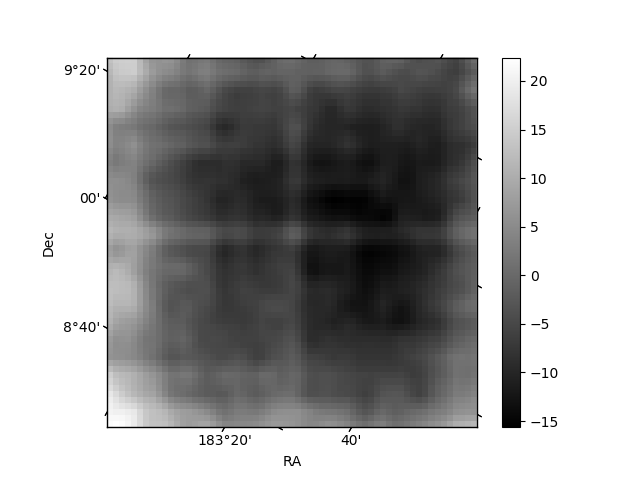 |
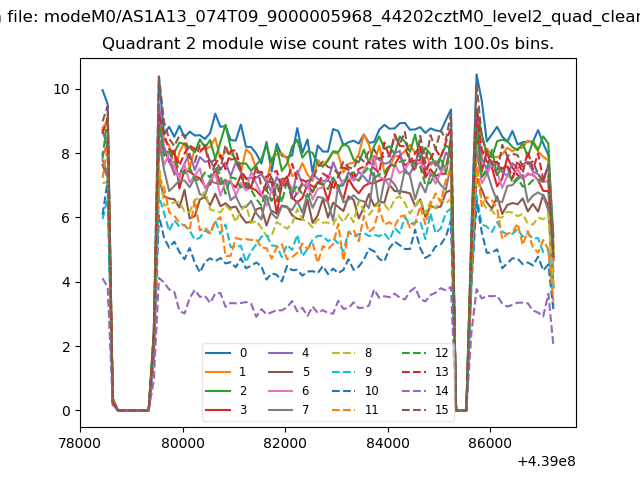
| Module-wise count rates for Quadrant C Data is divided into 100 sec bins |
 |
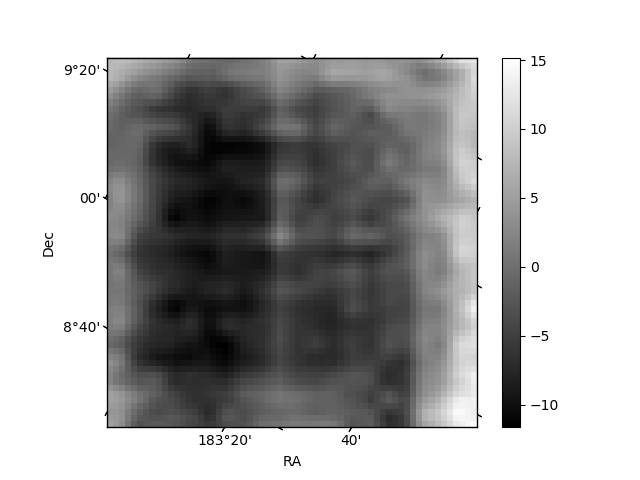 |
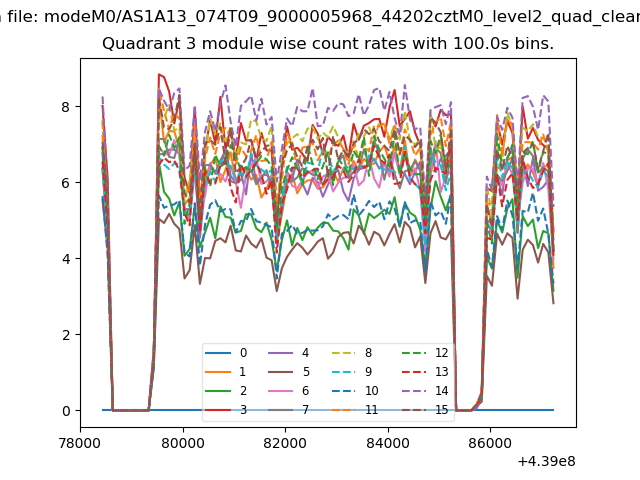
| Module-wise count rates for Quadrant D Data is divided into 100 sec bins |
 |
 |
| Parameter | Plot |
|---|---|
| CZT HV Monitor | 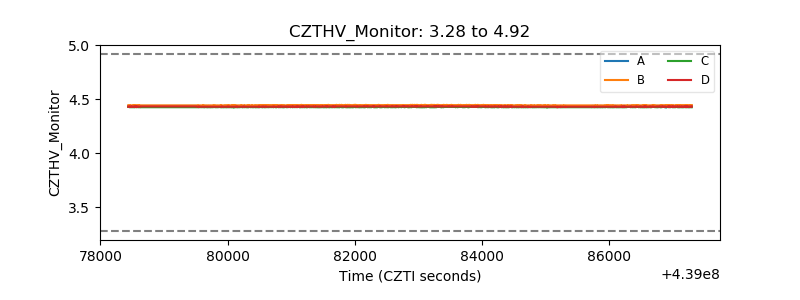 |
| D_VDD | 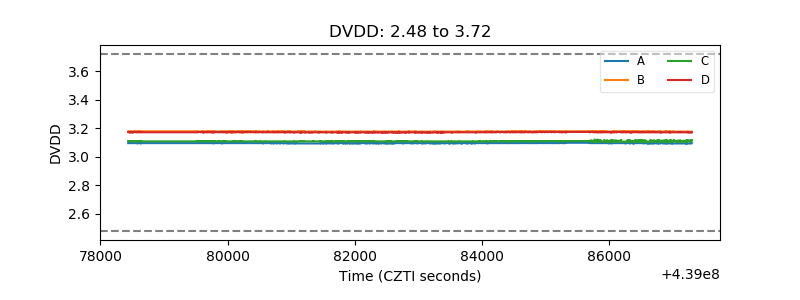 |
| Temperature 1 | 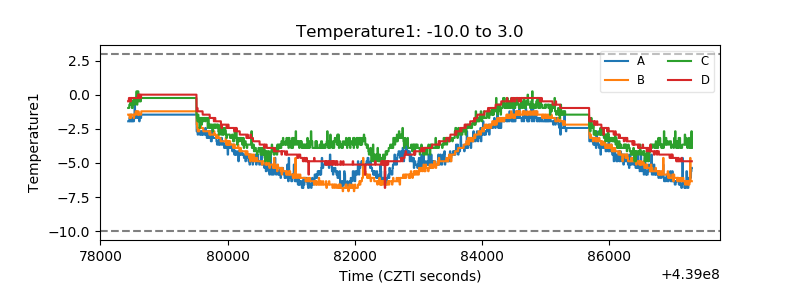 |
| Veto HV Monitor | 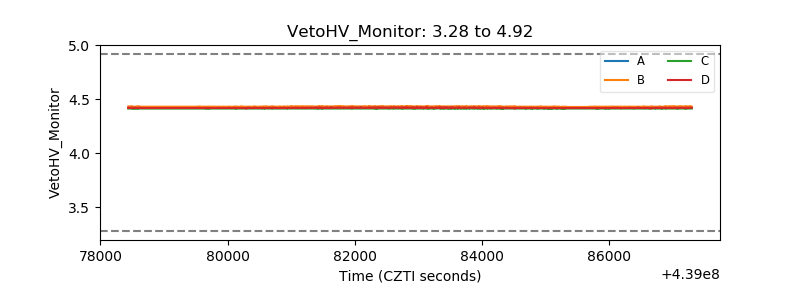 |
| Veto LLD | 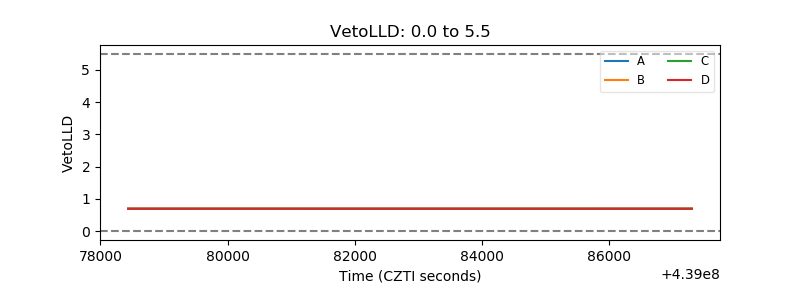 |
| Alpha Counter | 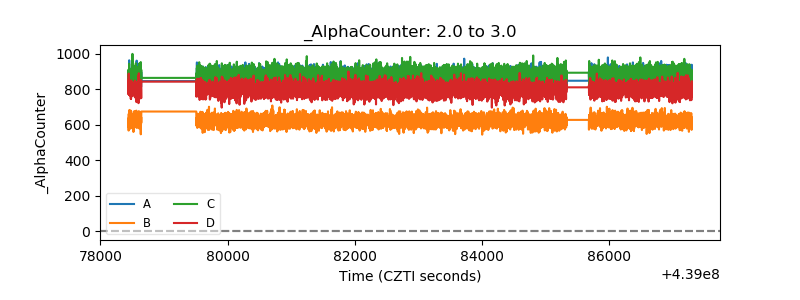 |
| _CPM_Rate |  |
| CZT Counter | 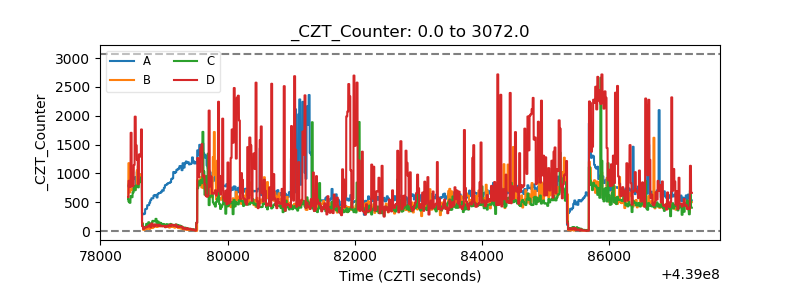 |
| +2.5 Volts monitor | 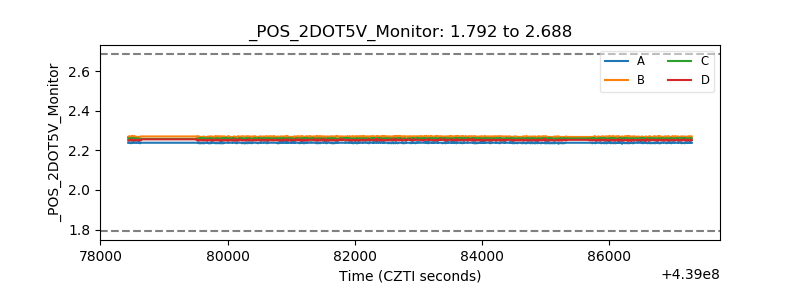 |
| +5 Volts monitor | 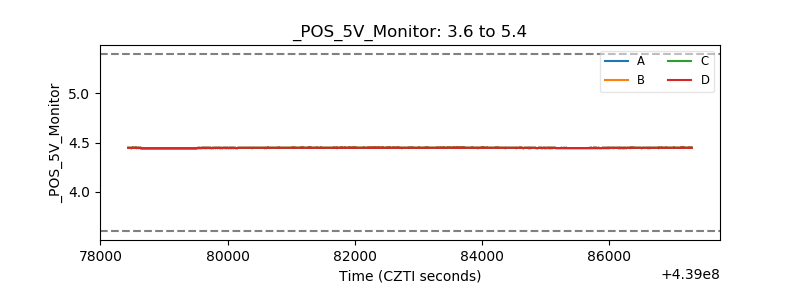 |
| _ROLL_ROT | 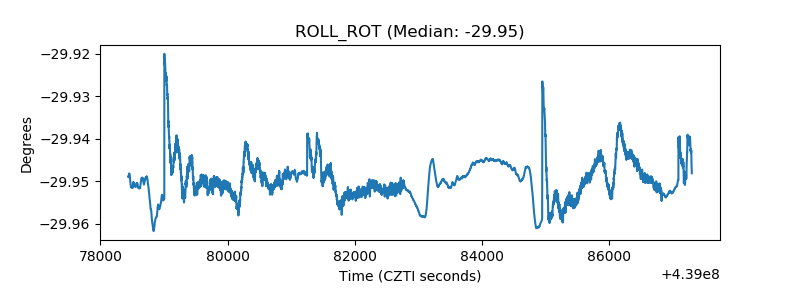 |
| _Roll_DEC | 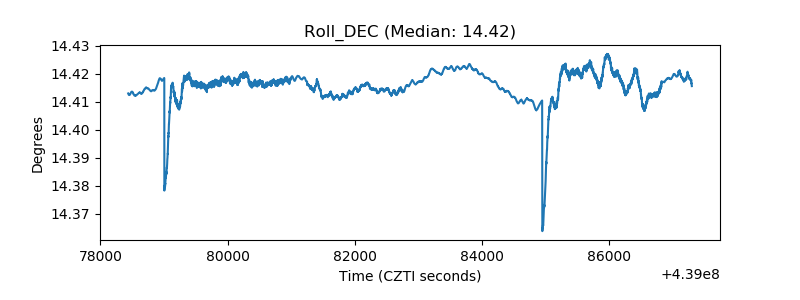 |
| _Roll_RA | 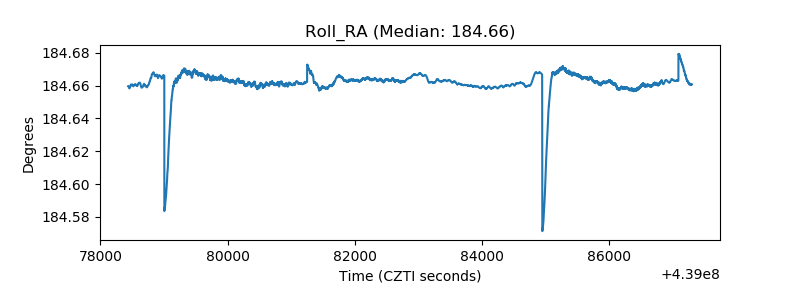 |
| Veto Counter | 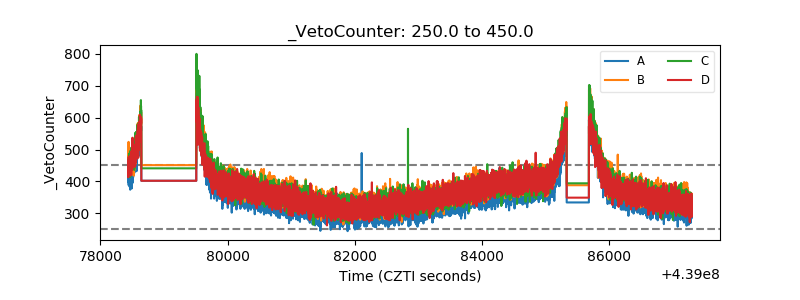 |