| Param | Original file | Final file |
|---|---|---|
| Filename | modeM0/AS1A13_074T09_9000005968_44203cztM0_level2.fits | modeM0/AS1A13_074T09_9000005968_44203cztM0_level2_quad_clean.evt |
| Size (bytes) | 593,340,480 | 131,636,160 |
| Size | 565.9 MB | 125.5 MB |
| Events in quadrant A | 5,898,171 | 885,225 |
| Events in quadrant B | 4,670,658 | 909,832 |
| Events in quadrant C | 4,168,109 | 877,103 |
| Events in quadrant D | 6,589,515 | 742,582 |
| Mode SS | |||
|---|---|---|---|
| Quadrant | BADHDUFLAG | Total packets | Discarded packets |
| A | 0 | 164 | 0 |
| B | 0 | 164 | 0 |
| C | 0 | 164 | 0 |
| D | 0 | 164 | 0 |
| Mode M0 | |||
|---|---|---|---|
| Quadrant | BADHDUFLAG | Total packets | Discarded packets |
| A | 0 | 23448 | 3 |
| B | 0 | 19621 | 1 |
| C | 0 | 18218 | 1 |
| D | 0 | 25413 | 1 |
| Quadrant | Total seconds | Saturated seconds | Saturation percentage |
|---|---|---|---|
| A | 8215 | 163 | 1.984175% |
| B | 8216 | 144 | 1.752678% |
| C | 8216 | 46 | 0.559883% |
| D | 8216 | 709 | 8.629503% |
Noise dominated data is calculated using 1-second bins in cleaned event files. If a bin has >2000 counts, and if more than 50% of those come from <1% of pixels, then it is considered to be noise-dominated and hence unusable.
| Quadrant | # 1 sec bins | Bins with >0 counts | Bins with >2000 counts | High rate bins dominated by noise | Noise dominated (total time) | Noise dominated (detector-on time) | Marked lightcurve |
|---|---|---|---|---|---|---|---|
| A | 8215 | 8215 | 57 | 57 | 0.69% | 0.69% | 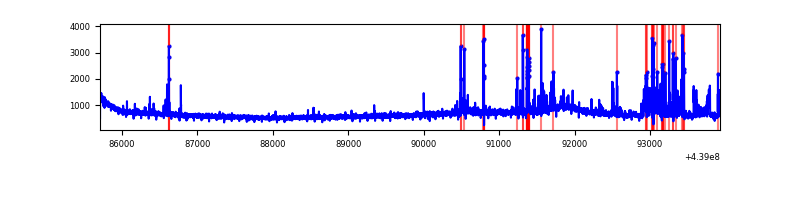 |
| B | 8216 | 8216 | 65 | 65 | 0.79% | 0.79% | 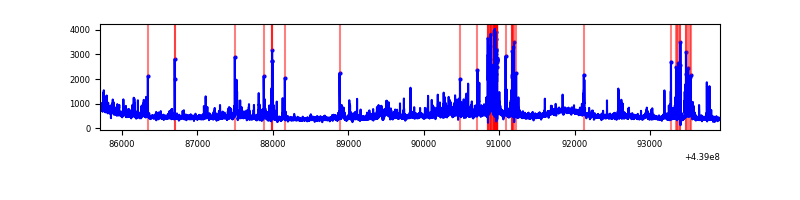 |
| C | 8216 | 8216 | 28 | 28 | 0.34% | 0.34% | 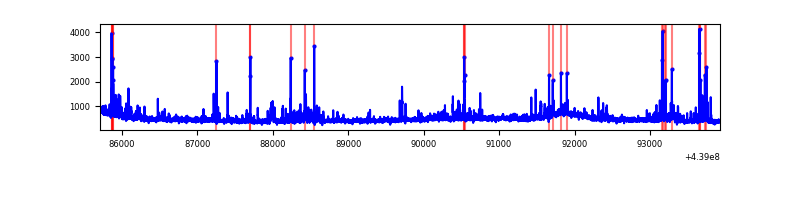 |
| D | 8216 | 8216 | 533 | 533 | 6.49% | 6.49% | 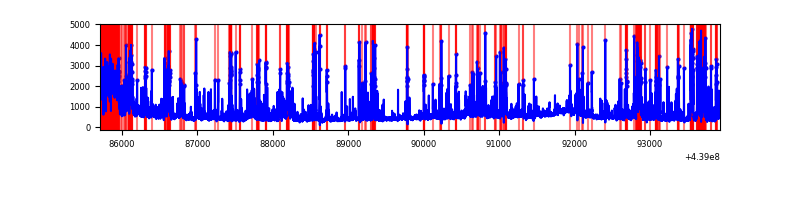 |
Top three noisy pixels from each quadrant. If the there are fewer than three noisy pixels in the level2.evt file, extra rows are filled as -1
| Pixel properties | Quadrant properties | ||||||
|---|---|---|---|---|---|---|---|
| Quadrant | DetID | PixID | Counts | Sigma | Mean | Median | Sigma |
| A | 10 | 83 | 1696548 | 8658.02 | 932 | 911 | 195.8 |
| A | 15 | 223 | 516311 | 2631.66 | 932 | 911 | 195.8 |
| A | 10 | 248 | 32361 | 160.59 | 932 | 911 | 195.8 |
| B | 0 | 219 | 290867 | 1567.65 | 932 | 905 | 185.0 |
| B | 5 | 172 | 229853 | 1237.79 | 932 | 905 | 185.0 |
| B | 0 | 200 | 139885 | 751.38 | 932 | 905 | 185.0 |
| C | 3 | 233 | 239132 | 1090.06 | 919 | 926 | 218.5 |
| C | 4 | 254 | 190928 | 869.47 | 919 | 926 | 218.5 |
| C | 14 | 254 | 101088 | 458.35 | 919 | 926 | 218.5 |
| D | 12 | 16 | 1042904 | 4658.07 | 878 | 851 | 223.7 |
| D | 13 | 249 | 799232 | 3568.83 | 878 | 851 | 223.7 |
| D | 1 | 52 | 518367 | 2313.34 | 878 | 851 | 223.7 |
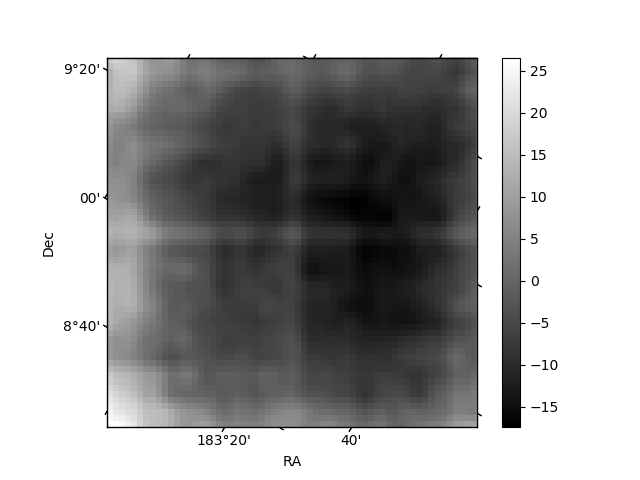
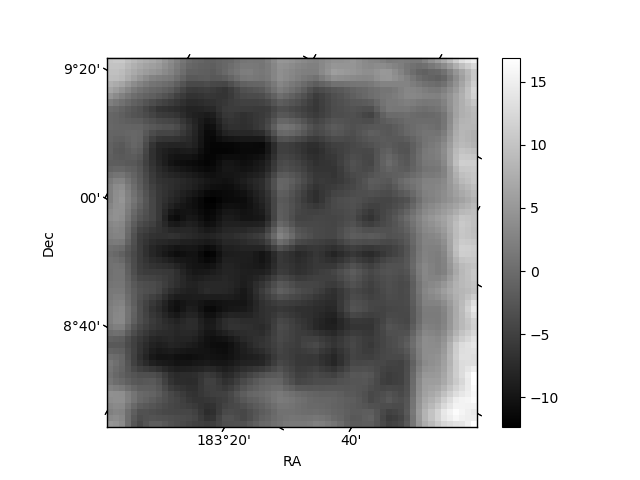
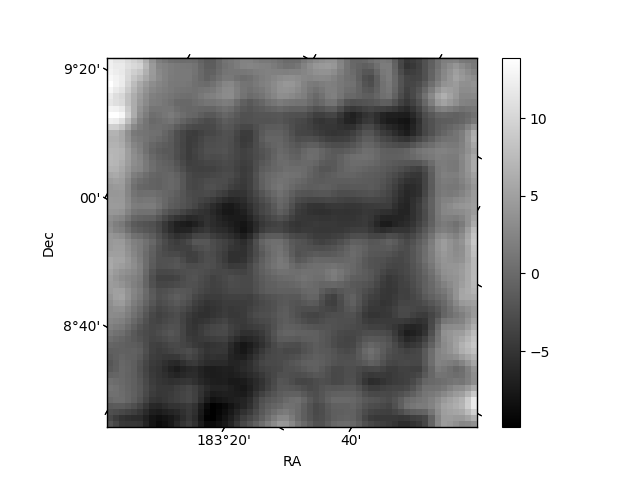
Histogram calculated using DETX and DETY for each event in the final _common_clean file
| Quadrant A | 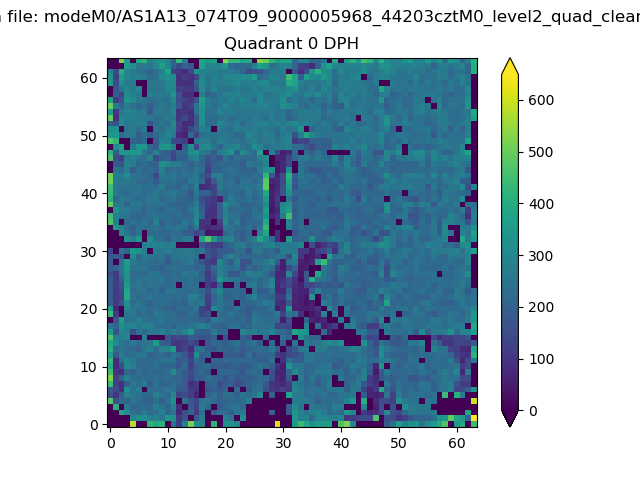 |
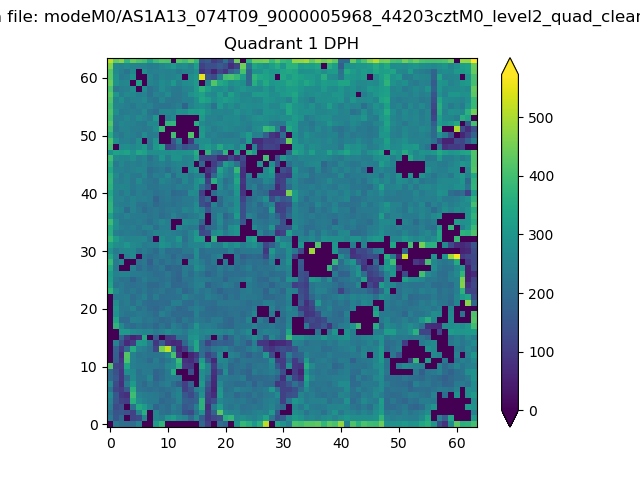 |
Quadrant B |
|---|---|---|---|
| Quadrant D | 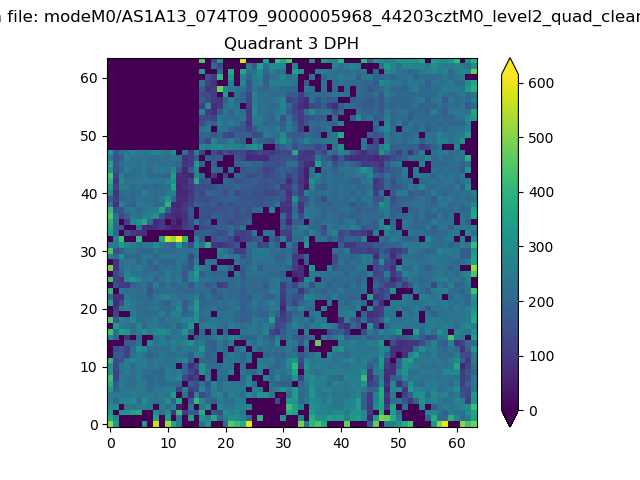 |
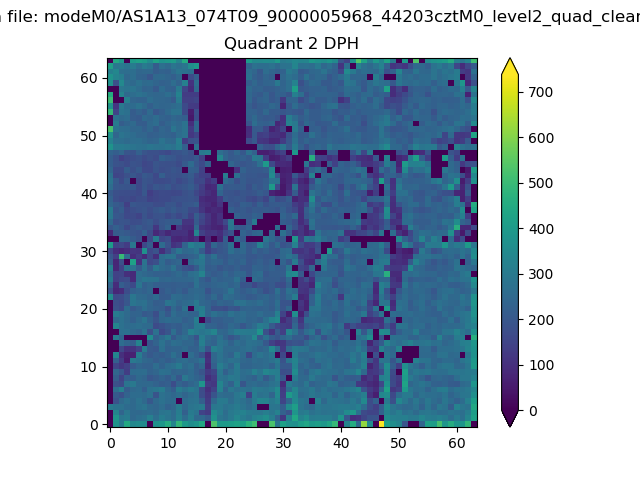 |
Quadrant C |
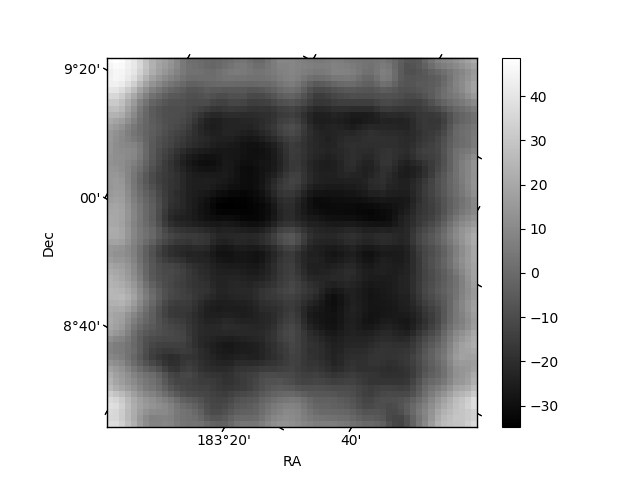
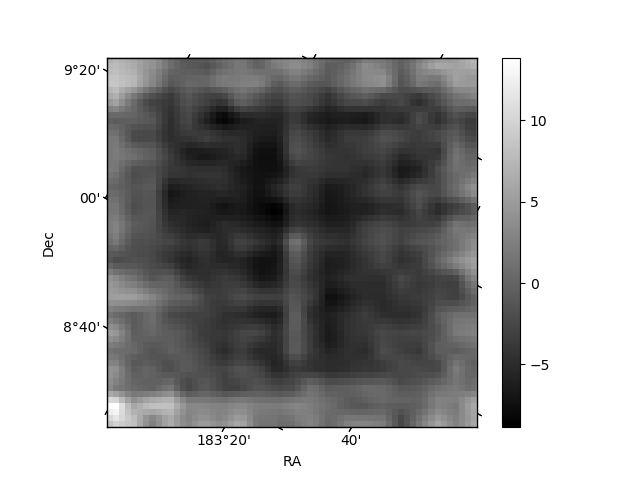
| Plot type | Count rate plots | Images |
|---|---|---|
| Comparison with Poisson distribution Blue bars denote a histogram of data divided into 1 sec bins. Red curve is a Poisson curve with rate = median count rate of data. |
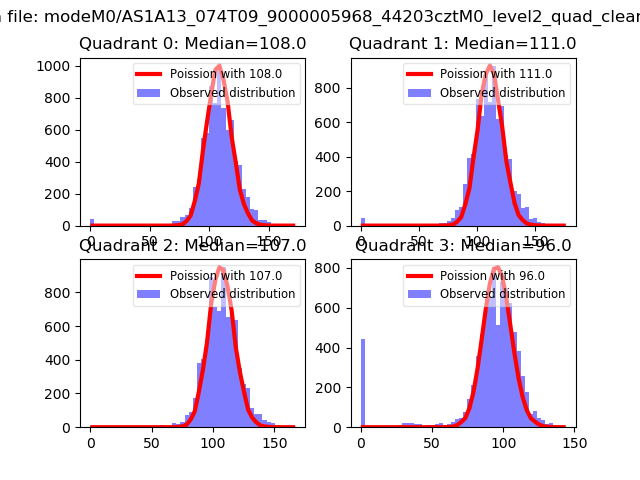 |
 |
| Quadrant-wise count rates Data is divided into 100 sec bins |
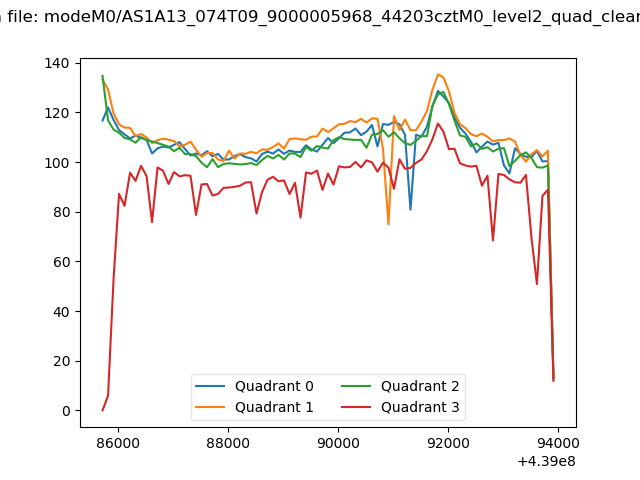 |
|
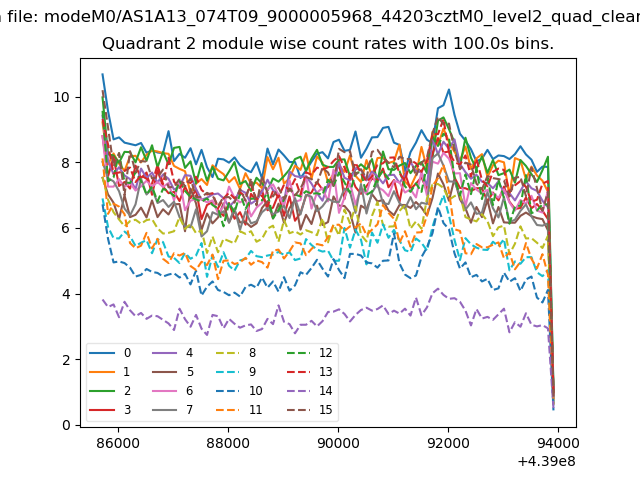
| Module-wise count rates for Quadrant A Data is divided into 100 sec bins |
 |
 |
| Module-wise count rates for Quadrant B Data is divided into 100 sec bins |
 |
 |
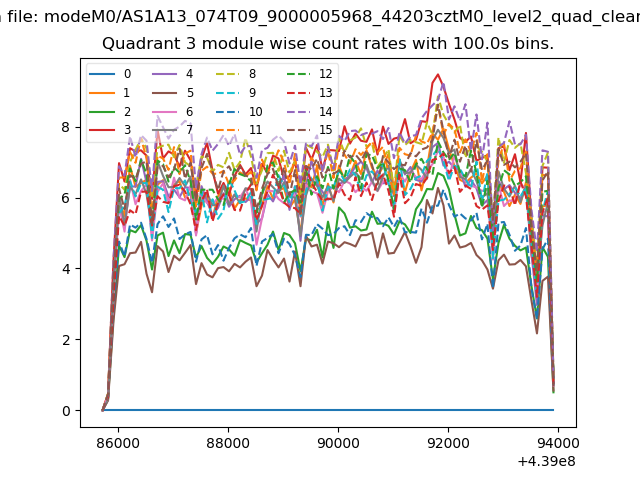
| Module-wise count rates for Quadrant C Data is divided into 100 sec bins |
 |
 |
| Module-wise count rates for Quadrant D Data is divided into 100 sec bins |
 |
 |
| Parameter | Plot |
|---|---|
| CZT HV Monitor | 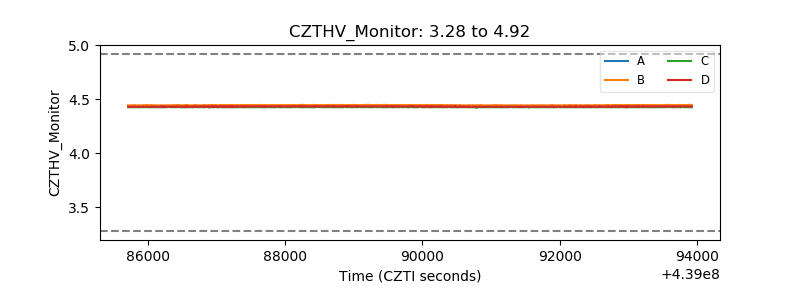 |
| D_VDD | 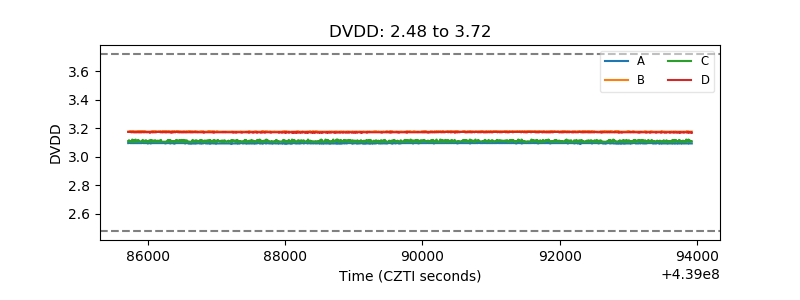 |
| Temperature 1 | 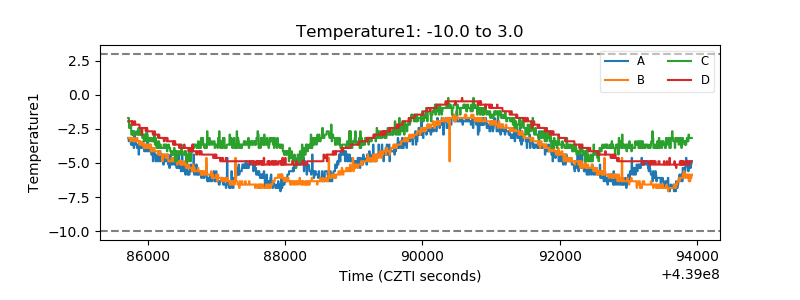 |
| Veto HV Monitor | 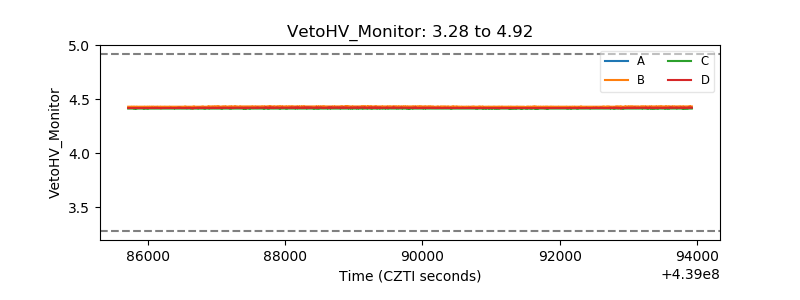 |
| Veto LLD | 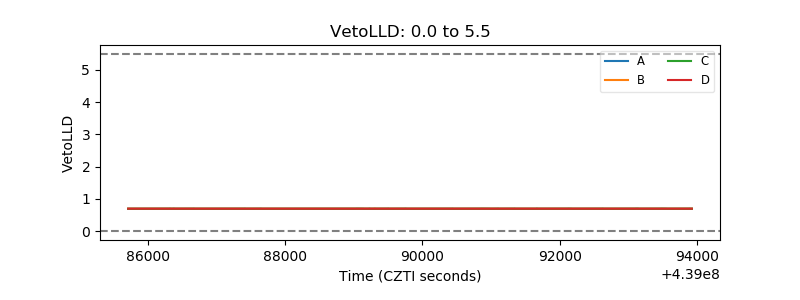 |
| Alpha Counter | 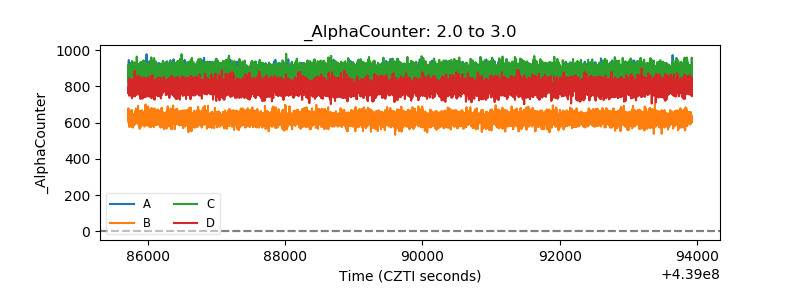 |
| _CPM_Rate | 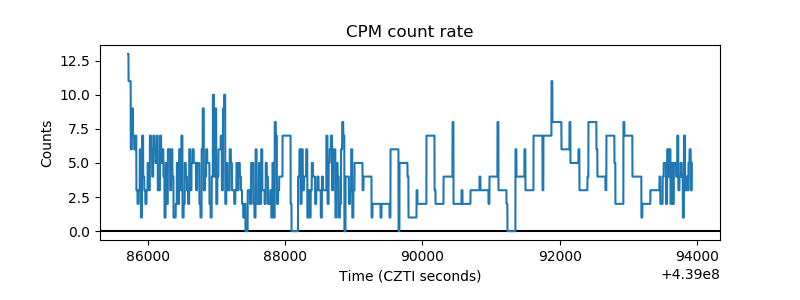 |
| CZT Counter | 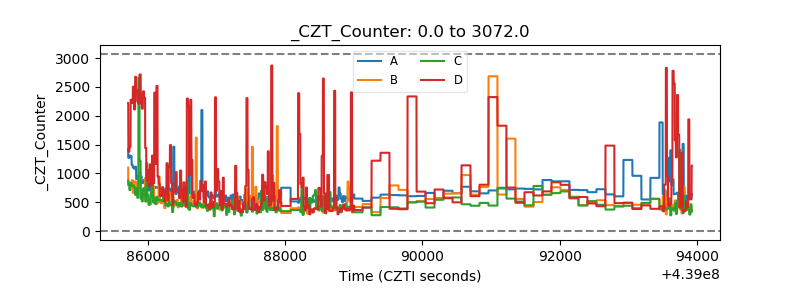 |
| +2.5 Volts monitor | 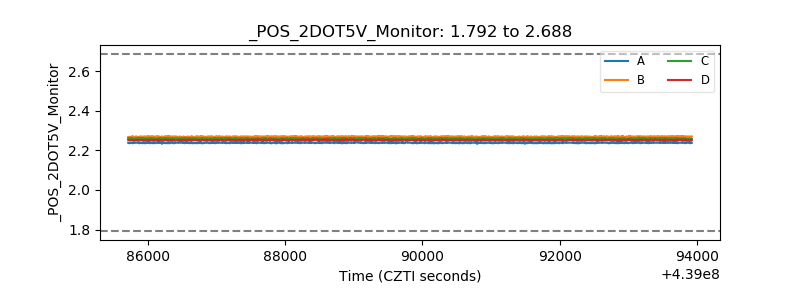 |
| +5 Volts monitor | 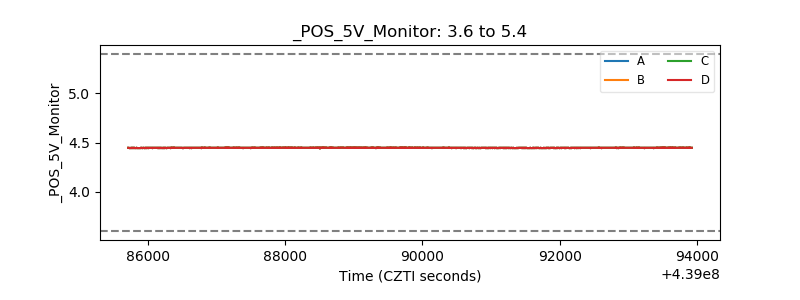 |
| _ROLL_ROT | 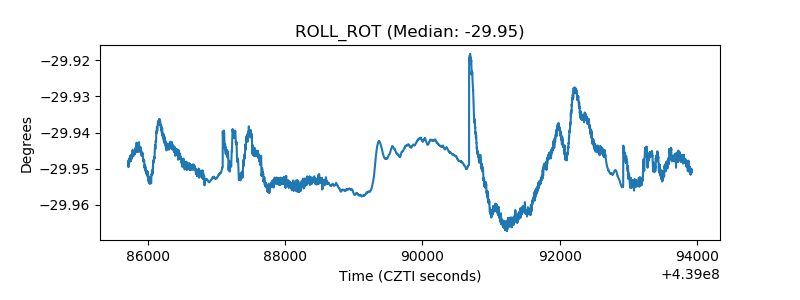 |
| _Roll_DEC | 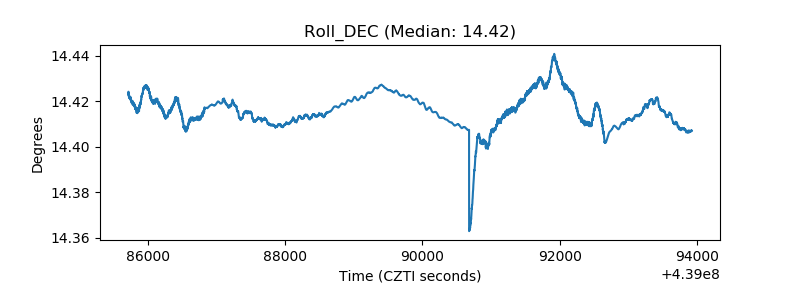 |
| _Roll_RA | 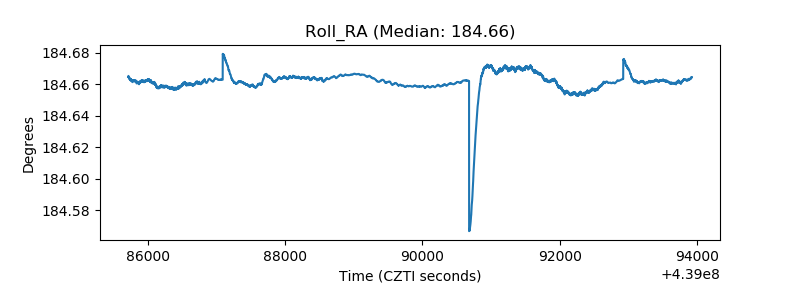 |
| Veto Counter | 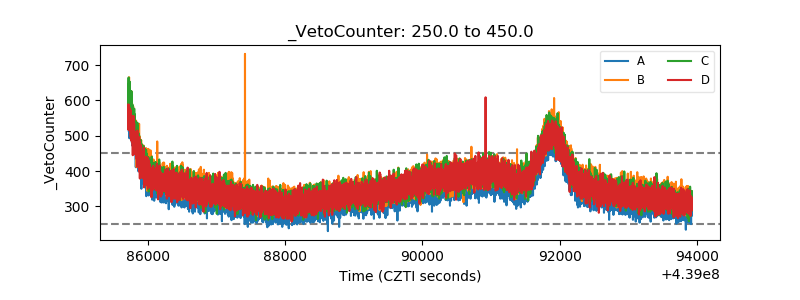 |