| Param | Original file | Final file |
|---|---|---|
| Filename | modeM0/AS1A13_047T01_9000005970_44208cztM0_level2.fits | modeM0/AS1A13_047T01_9000005970_44208cztM0_level2_quad_clean.evt |
| Size (bytes) | 552,663,360 | 107,887,680 |
| Size | 527.1 MB | 102.9 MB |
| Events in quadrant A | 6,065,863 | 719,179 |
| Events in quadrant B | 4,176,672 | 736,753 |
| Events in quadrant C | 3,178,564 | 725,261 |
| Events in quadrant D | 6,506,124 | 608,898 |
| Mode SS | |||
|---|---|---|---|
| Quadrant | BADHDUFLAG | Total packets | Discarded packets |
| A | 0 | 138 | 0 |
| B | 0 | 138 | 0 |
| C | 0 | 138 | 0 |
| D | 0 | 138 | 0 |
| Mode M9 | |||
|---|---|---|---|
| Quadrant | BADHDUFLAG | Total packets | Discarded packets |
| A | 0 | 8 | 0 |
| B | 0 | 8 | 0 |
| C | 0 | 8 | 0 |
| D | 0 | 8 | 0 |
| Mode M0 | |||
|---|---|---|---|
| Quadrant | BADHDUFLAG | Total packets | Discarded packets |
| A | 0 | 23340 | 1 |
| B | 0 | 16873 | 1 |
| C | 0 | 14370 | 1 |
| D | 0 | 23873 | 1 |
| Quadrant | Total seconds | Saturated seconds | Saturation percentage |
|---|---|---|---|
| A | 6842 | 348 | 5.086232% |
| B | 6843 | 290 | 4.237907% |
| C | 6843 | 86 | 1.256759% |
| D | 6843 | 827 | 12.085343% |
Noise dominated data is calculated using 1-second bins in cleaned event files. If a bin has >2000 counts, and if more than 50% of those come from <1% of pixels, then it is considered to be noise-dominated and hence unusable.
| Quadrant | # 1 sec bins | Bins with >0 counts | Bins with >2000 counts | High rate bins dominated by noise | Noise dominated (total time) | Noise dominated (detector-on time) | Marked lightcurve |
|---|---|---|---|---|---|---|---|
| A | 7647 | 6843 | 122 | 122 | 1.60% | 1.78% | 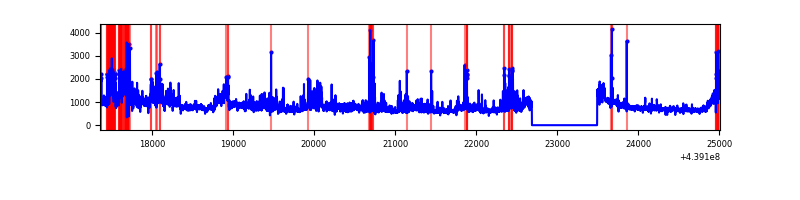 |
| B | 7648 | 6843 | 103 | 103 | 1.35% | 1.51% | 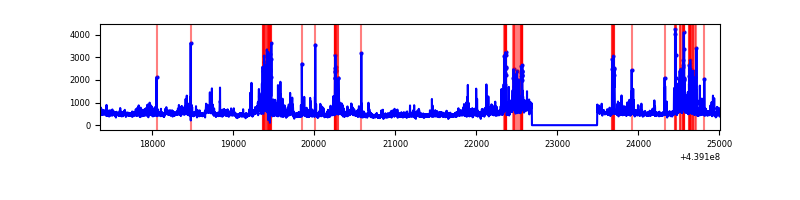 |
| C | 7648 | 6844 | 4 | 4 | 0.05% | 0.06% | 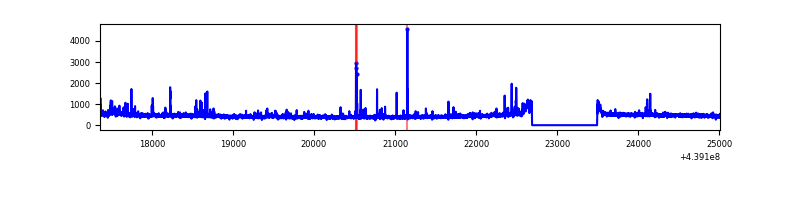 |
| D | 7648 | 6844 | 660 | 660 | 8.63% | 9.64% |  |
Top three noisy pixels from each quadrant. If the there are fewer than three noisy pixels in the level2.evt file, extra rows are filled as -1
| Pixel properties | Quadrant properties | ||||||
|---|---|---|---|---|---|---|---|
| Quadrant | DetID | PixID | Counts | Sigma | Mean | Median | Sigma |
| A | 15 | 223 | 1503456 | 9479.52 | 766 | 752 | 158.5 |
| A | 10 | 83 | 1436799 | 9059.02 | 766 | 752 | 158.5 |
| A | 2 | 79 | 121824 | 763.76 | 766 | 752 | 158.5 |
| B | 0 | 200 | 360587 | 2364.62 | 764 | 739 | 152.2 |
| B | 3 | 112 | 281355 | 1843.97 | 764 | 739 | 152.2 |
| B | 5 | 172 | 177114 | 1158.99 | 764 | 739 | 152.2 |
| C | 14 | 254 | 123493 | 678.73 | 760 | 762 | 180.8 |
| C | 4 | 254 | 47967 | 261.06 | 760 | 762 | 180.8 |
| C | 14 | 204 | 24605 | 131.86 | 760 | 762 | 180.8 |
| D | 12 | 16 | 1402208 | 7536.53 | 725 | 701 | 186.0 |
| D | 1 | 52 | 1127962 | 6061.78 | 725 | 701 | 186.0 |
| D | 2 | 249 | 895920 | 4813.99 | 725 | 701 | 186.0 |
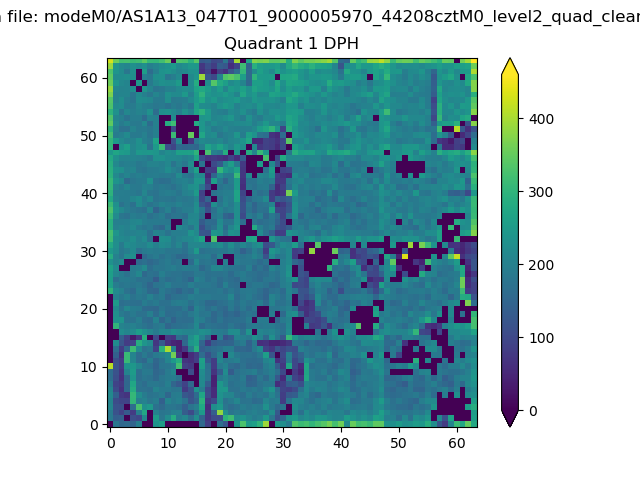
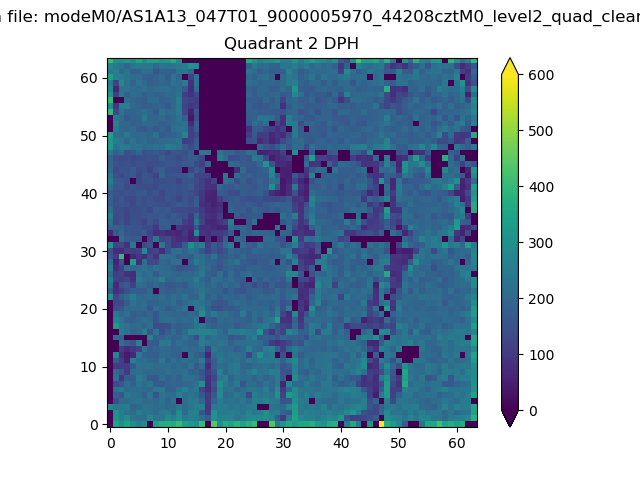
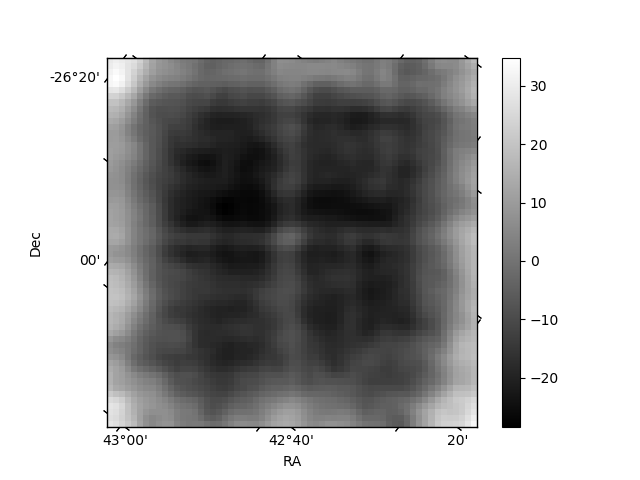
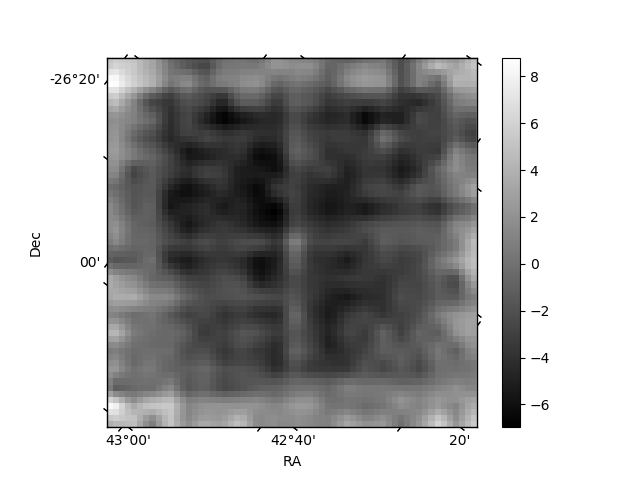
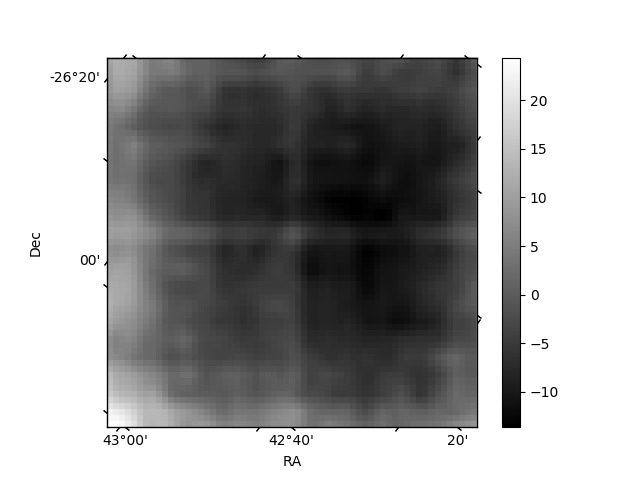
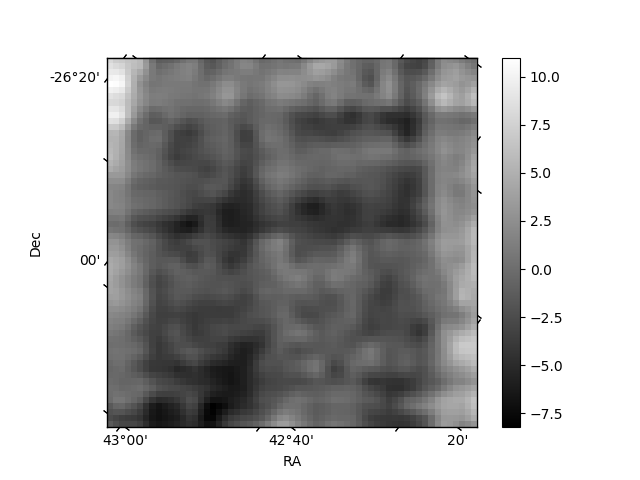
Histogram calculated using DETX and DETY for each event in the final _common_clean file
| Quadrant A | 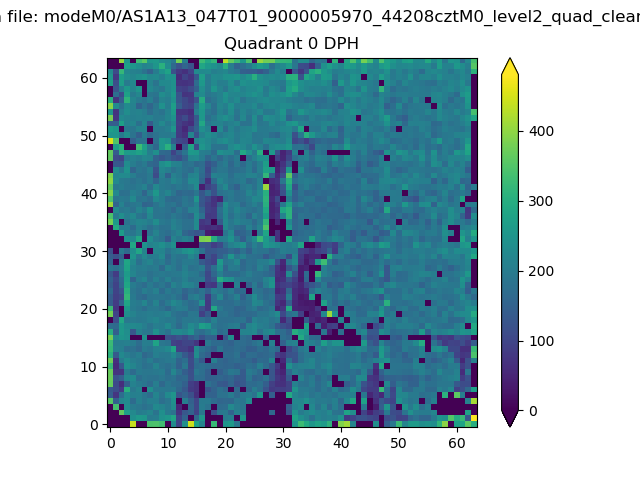 |
 |
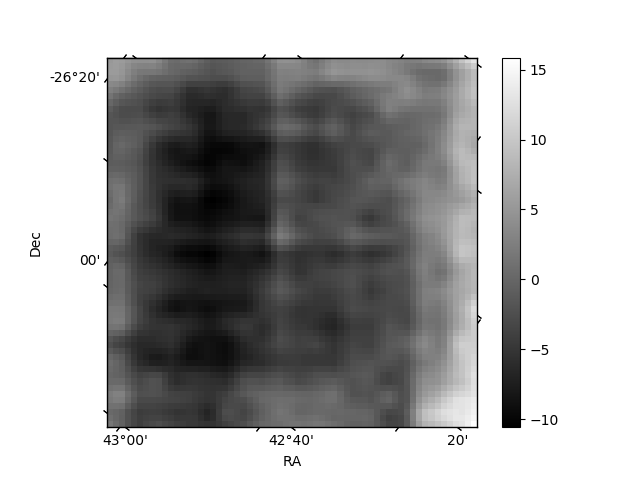
Quadrant B |
|---|---|---|---|
| Quadrant D | 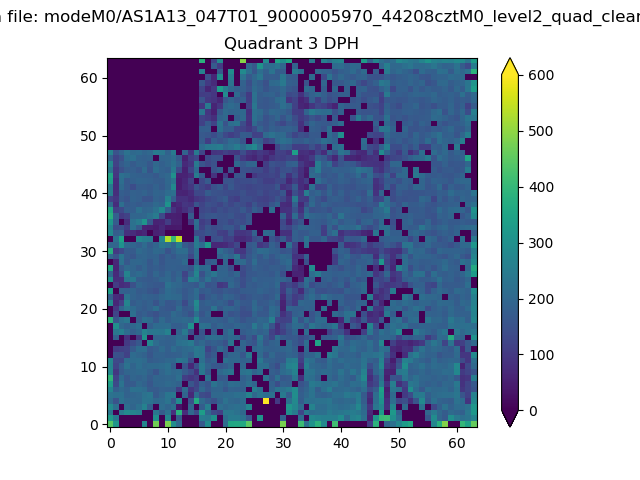 |
 |
Quadrant C |
| Plot type | Count rate plots | Images |
|---|---|---|
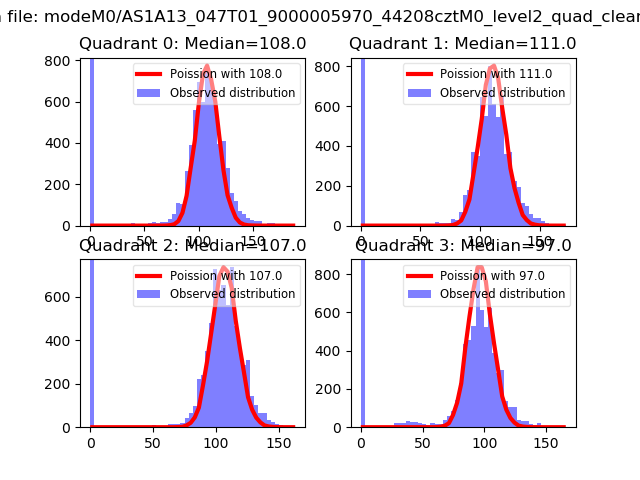
| Comparison with Poisson distribution Blue bars denote a histogram of data divided into 1 sec bins. Red curve is a Poisson curve with rate = median count rate of data. |
 |
 |
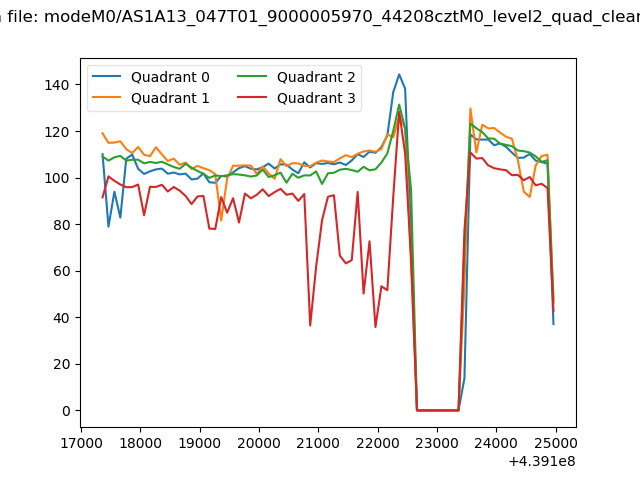
| Quadrant-wise count rates Data is divided into 100 sec bins |
 |
|
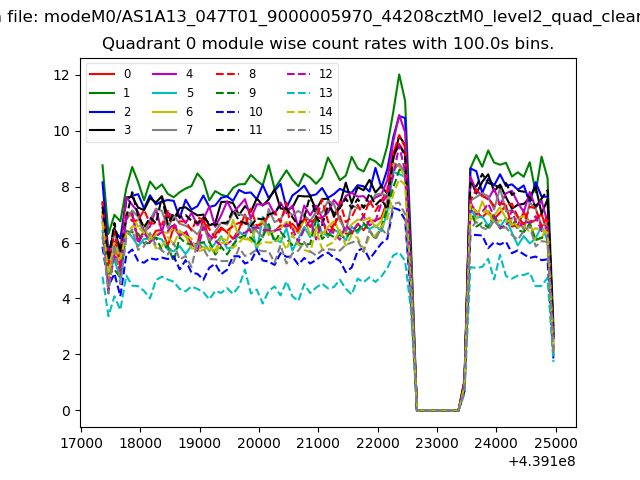
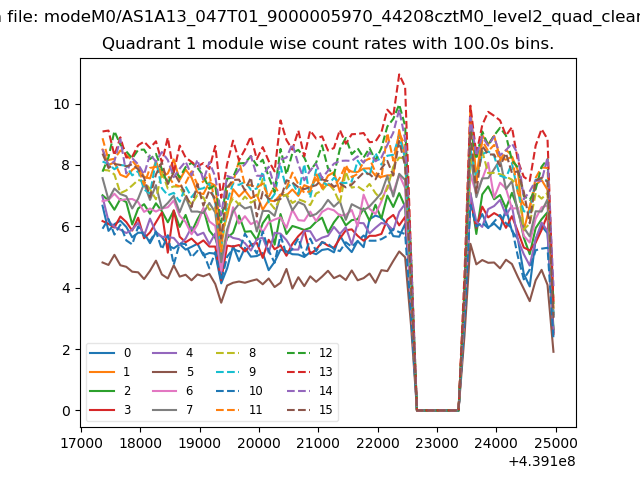
| Module-wise count rates for Quadrant A Data is divided into 100 sec bins |
 |
 |
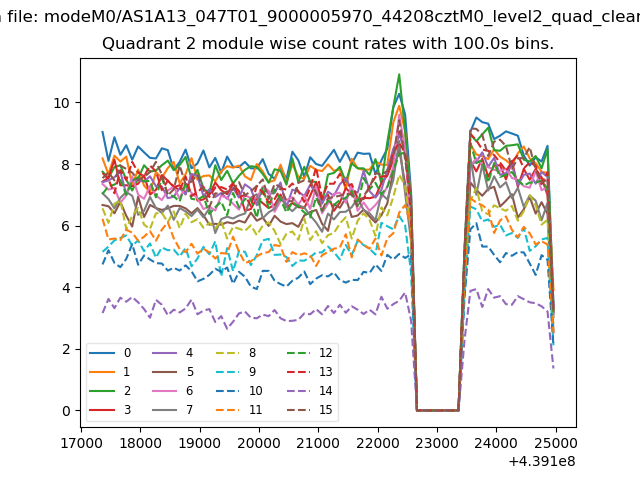
| Module-wise count rates for Quadrant B Data is divided into 100 sec bins |
 |
 |
| Module-wise count rates for Quadrant C Data is divided into 100 sec bins |
 |
 |
| Module-wise count rates for Quadrant D Data is divided into 100 sec bins |
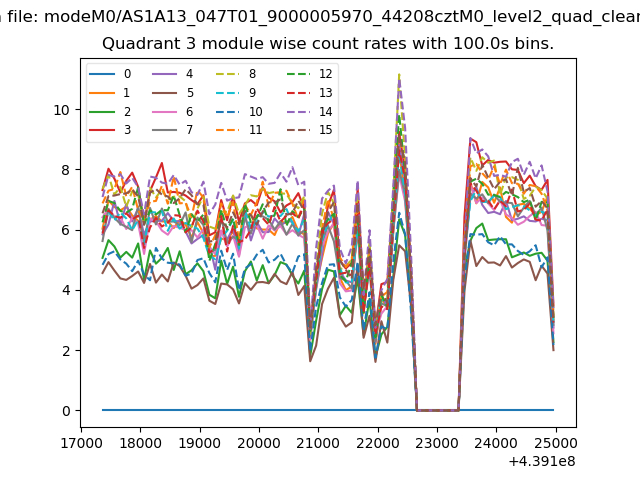 |
 |
| Parameter | Plot |
|---|---|
| CZT HV Monitor | 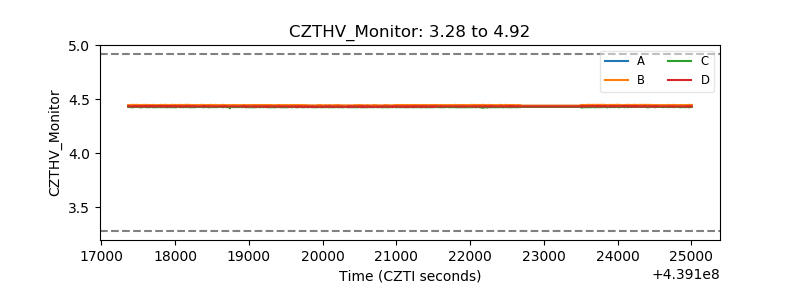 |
| D_VDD | 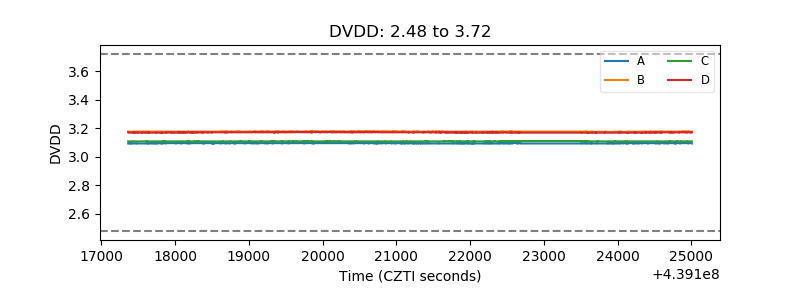 |
| Temperature 1 | 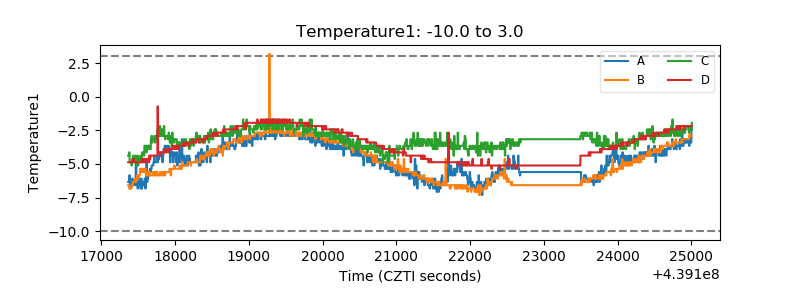 |
| Veto HV Monitor | 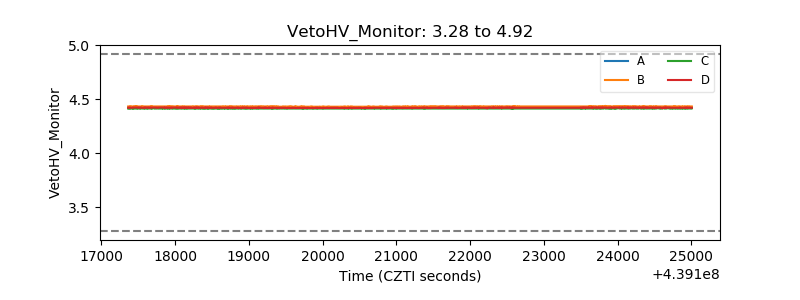 |
| Veto LLD | 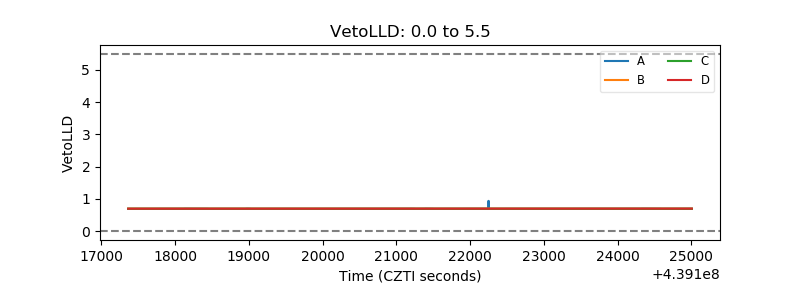 |
| Alpha Counter | 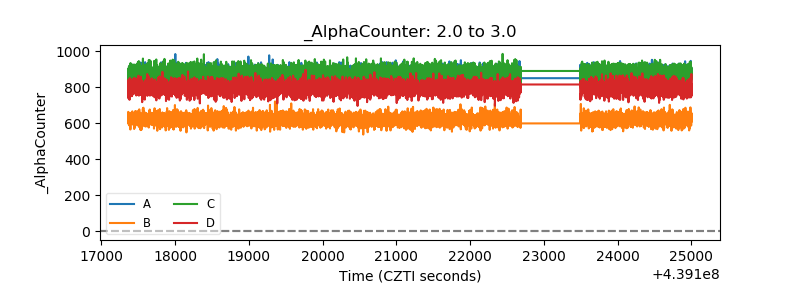 |
| _CPM_Rate | 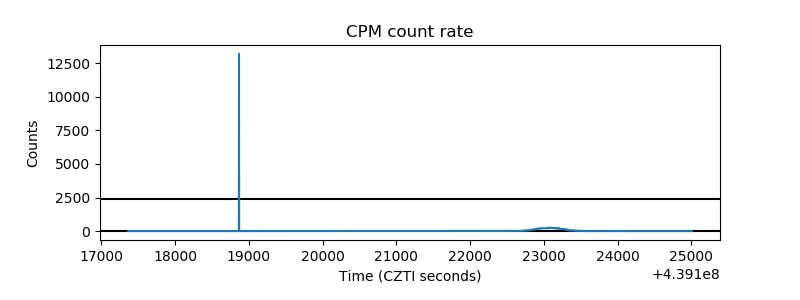 |
| CZT Counter | 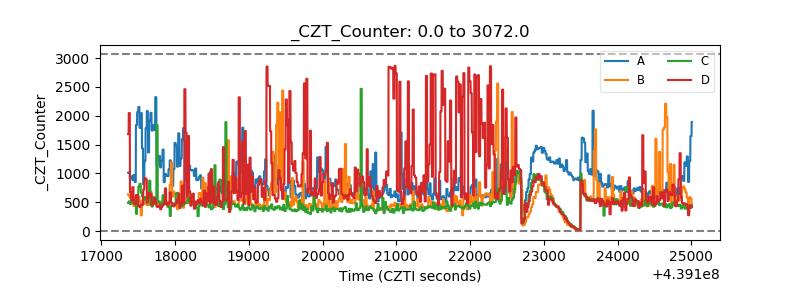 |
| +2.5 Volts monitor | 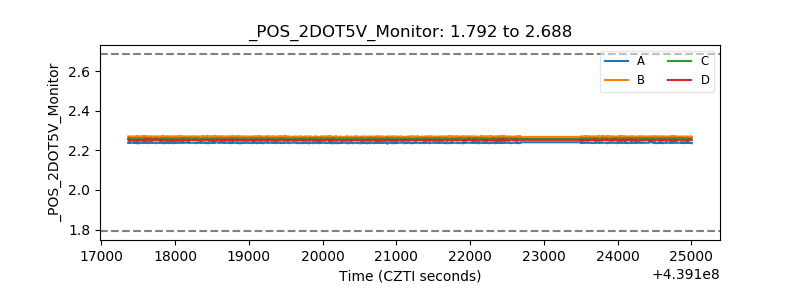 |
| +5 Volts monitor | 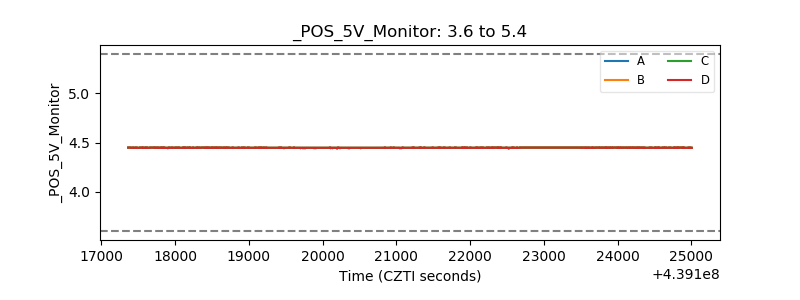 |
| _ROLL_ROT | 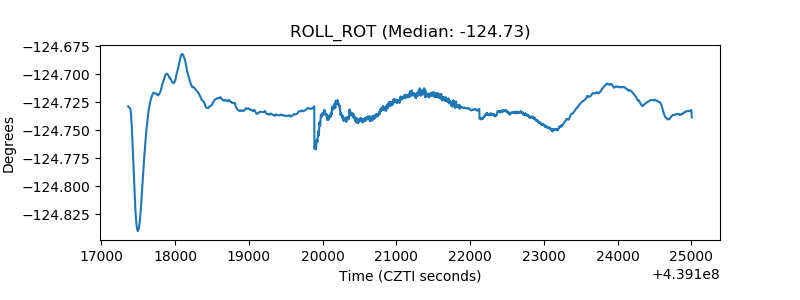 |
| _Roll_DEC | 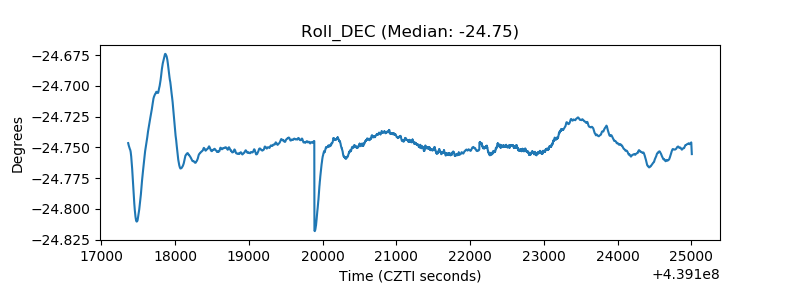 |
| _Roll_RA | 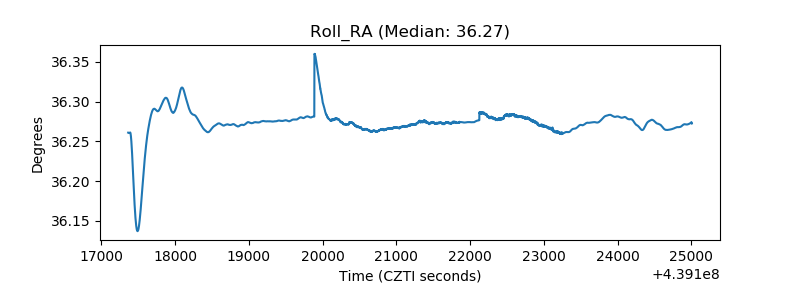 |
| Veto Counter | 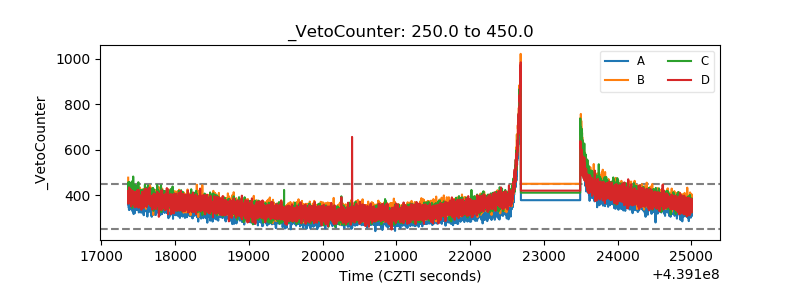 |