| Param | Original file | Final file |
|---|---|---|
| Filename | modeM0/AS1A13_047T01_9000005970_44210cztM0_level2.fits | modeM0/AS1A13_047T01_9000005970_44210cztM0_level2_quad_clean.evt |
| Size (bytes) | 498,288,960 | 118,445,760 |
| Size | 475.2 MB | 113.0 MB |
| Events in quadrant A | 6,669,911 | 801,078 |
| Events in quadrant B | 3,948,887 | 800,976 |
| Events in quadrant C | 3,203,613 | 791,651 |
| Events in quadrant D | 4,128,804 | 749,005 |
| Mode SS | |||
|---|---|---|---|
| Quadrant | BADHDUFLAG | Total packets | Discarded packets |
| A | 0 | 128 | 0 |
| B | 0 | 128 | 0 |
| C | 0 | 128 | 0 |
| D | 0 | 128 | 0 |
| Mode M9 | |||
|---|---|---|---|
| Quadrant | BADHDUFLAG | Total packets | Discarded packets |
| A | 0 | 10 | 0 |
| B | 0 | 10 | 0 |
| C | 0 | 10 | 0 |
| D | 0 | 10 | 0 |
| Mode M0 | |||
|---|---|---|---|
| Quadrant | BADHDUFLAG | Total packets | Discarded packets |
| A | 0 | 24633 | 1 |
| B | 0 | 16018 | 1 |
| C | 0 | 14082 | 1 |
| D | 0 | 16466 | 1 |
| Quadrant | Total seconds | Saturated seconds | Saturation percentage |
|---|---|---|---|
| A | 6368 | 519 | 8.150126% |
| B | 6368 | 237 | 3.721734% |
| C | 6368 | 79 | 1.240578% |
| D | 6368 | 140 | 2.198492% |
Noise dominated data is calculated using 1-second bins in cleaned event files. If a bin has >2000 counts, and if more than 50% of those come from <1% of pixels, then it is considered to be noise-dominated and hence unusable.
| Quadrant | # 1 sec bins | Bins with >0 counts | Bins with >2000 counts | High rate bins dominated by noise | Noise dominated (total time) | Noise dominated (detector-on time) | Marked lightcurve |
|---|---|---|---|---|---|---|---|
| A | 7308 | 6368 | 209 | 209 | 2.86% | 3.28% | 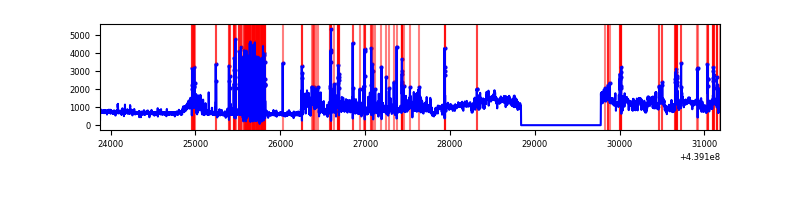 |
| B | 7308 | 6368 | 87 | 87 | 1.19% | 1.37% | 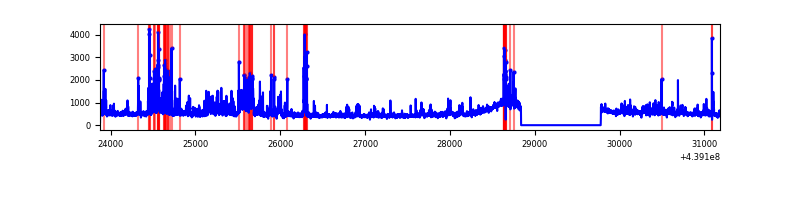 |
| C | 7308 | 6369 | 16 | 16 | 0.22% | 0.25% | 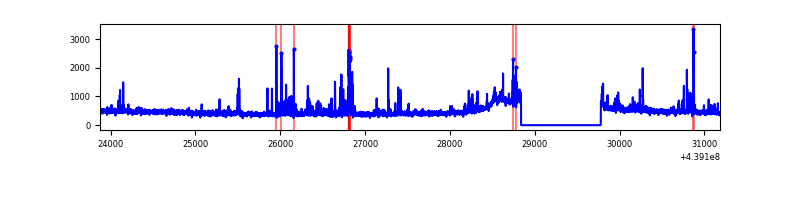 |
| D | 7308 | 6369 | 56 | 56 | 0.77% | 0.88% | 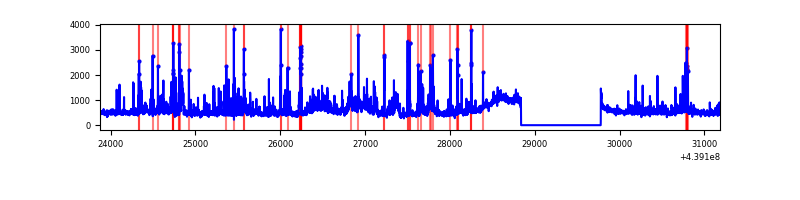 |
Top three noisy pixels from each quadrant. If the there are fewer than three noisy pixels in the level2.evt file, extra rows are filled as -1
| Pixel properties | Quadrant properties | ||||||
|---|---|---|---|---|---|---|---|
| Quadrant | DetID | PixID | Counts | Sigma | Mean | Median | Sigma |
| A | 15 | 223 | 2389504 | 14947.43 | 760 | 749 | 159.8 |
| A | 10 | 83 | 1307697 | 8178.11 | 760 | 749 | 159.8 |
| A | 0 | 243 | 19551 | 117.65 | 760 | 749 | 159.8 |
| B | 0 | 200 | 265920 | 1785.46 | 750 | 731 | 148.5 |
| B | 3 | 112 | 232029 | 1557.28 | 750 | 731 | 148.5 |
| B | 5 | 172 | 151213 | 1013.16 | 750 | 731 | 148.5 |
| C | 4 | 254 | 165211 | 917.7 | 742 | 748 | 179.2 |
| C | 14 | 254 | 79590 | 439.93 | 742 | 748 | 179.2 |
| C | 3 | 233 | 64478 | 355.61 | 742 | 748 | 179.2 |
| D | 1 | 52 | 660395 | 3378.86 | 756 | 734 | 195.2 |
| D | 2 | 249 | 273707 | 1398.2 | 756 | 734 | 195.2 |
| D | 13 | 249 | 159315 | 812.27 | 756 | 734 | 195.2 |
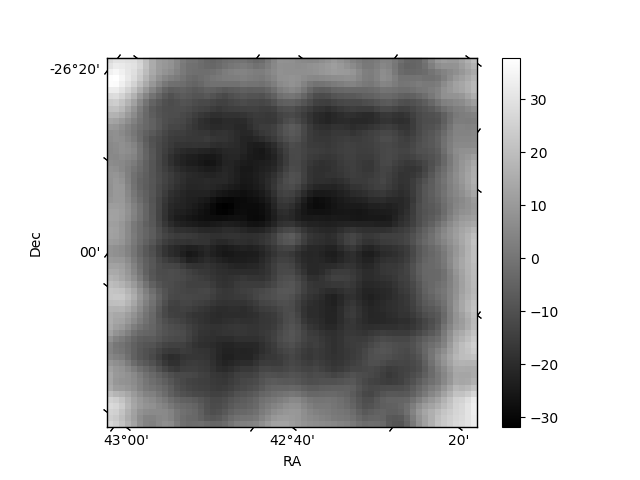
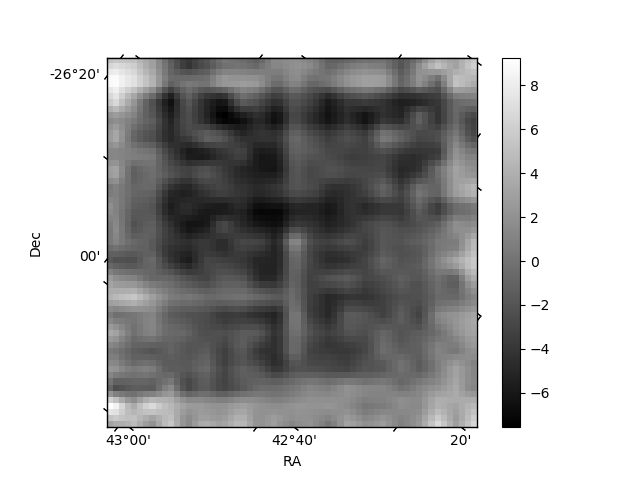
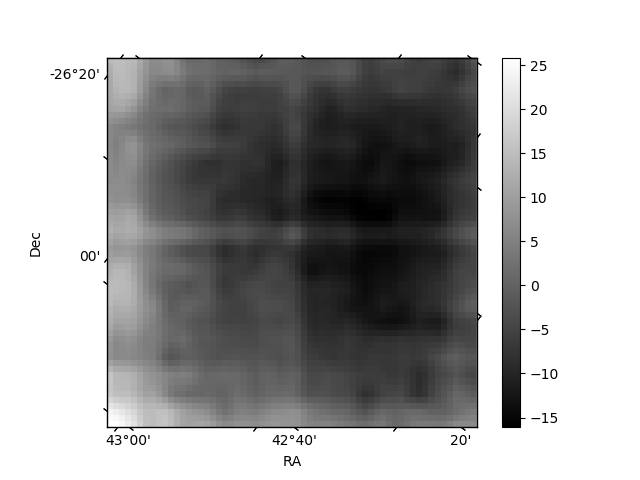
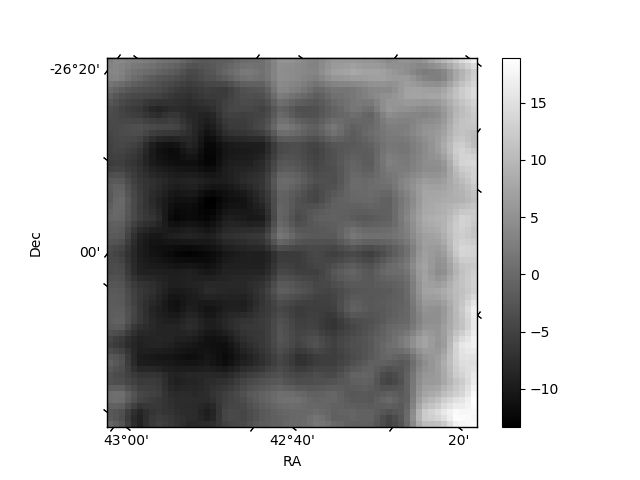
Histogram calculated using DETX and DETY for each event in the final _common_clean file
| Quadrant A | 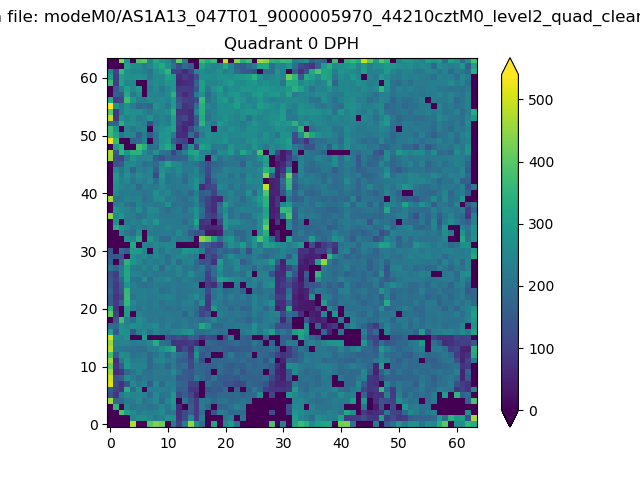 |
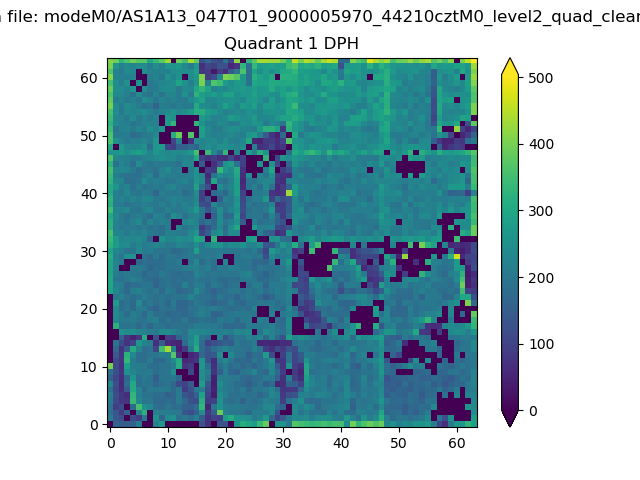 |
Quadrant B |
|---|---|---|---|
| Quadrant D | 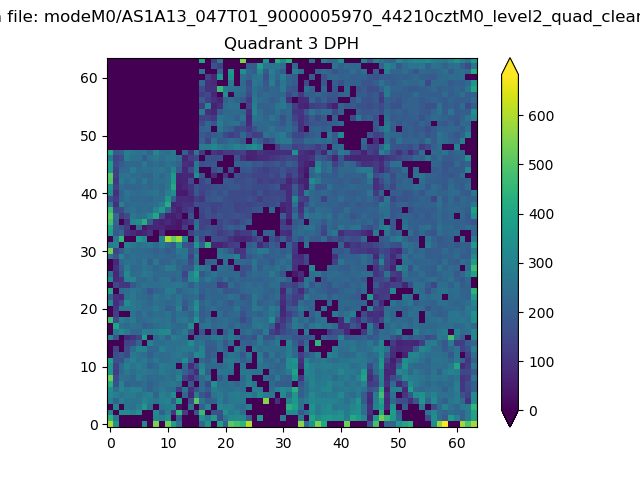 |
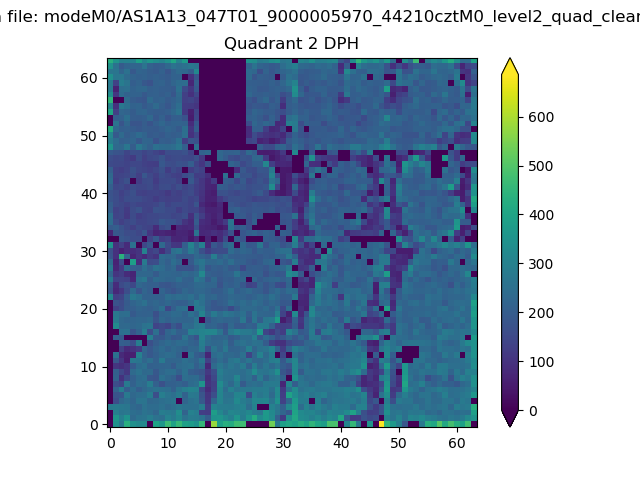 |
Quadrant C |
| Plot type | Count rate plots | Images |
|---|---|---|
| Comparison with Poisson distribution Blue bars denote a histogram of data divided into 1 sec bins. Red curve is a Poisson curve with rate = median count rate of data. |
 |
 |
| Quadrant-wise count rates Data is divided into 100 sec bins |
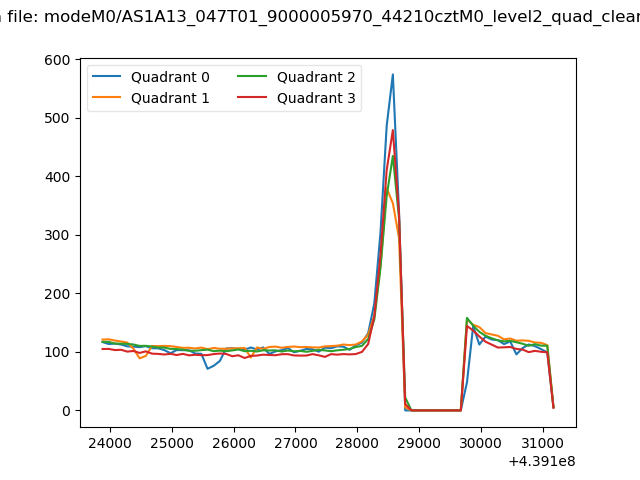 |
|
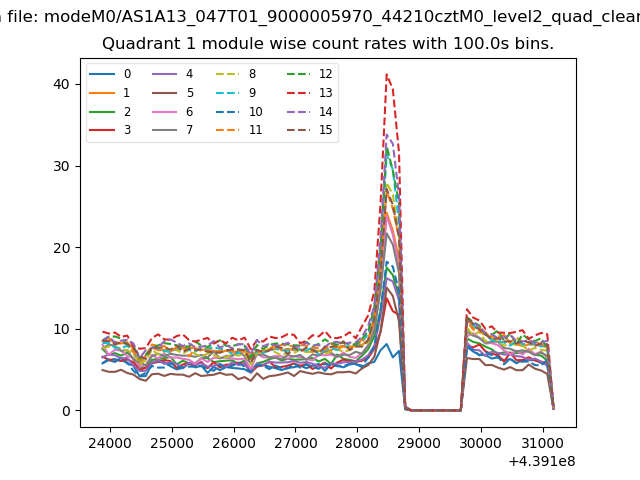
| Module-wise count rates for Quadrant A Data is divided into 100 sec bins |
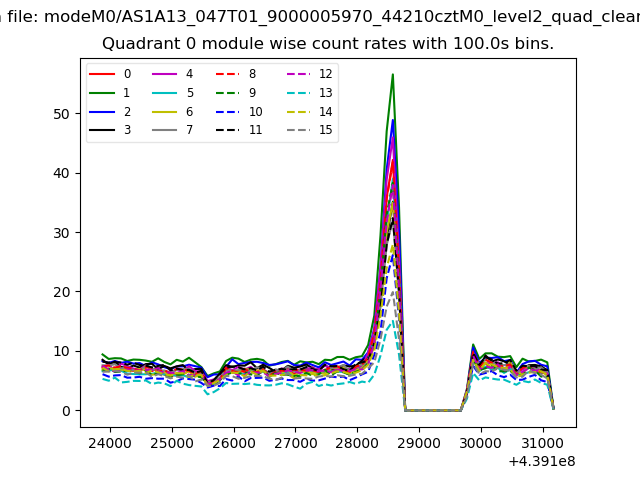 |
 |
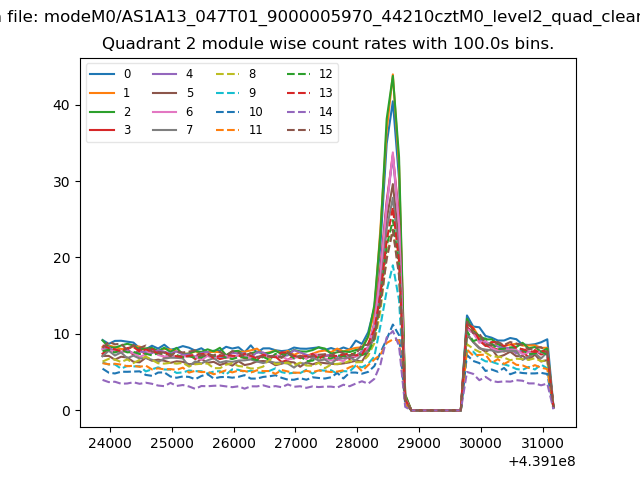
| Module-wise count rates for Quadrant B Data is divided into 100 sec bins |
 |
 |
| Module-wise count rates for Quadrant C Data is divided into 100 sec bins |
 |
 |
| Module-wise count rates for Quadrant D Data is divided into 100 sec bins |
 |
 |
| Parameter | Plot |
|---|---|
| CZT HV Monitor | 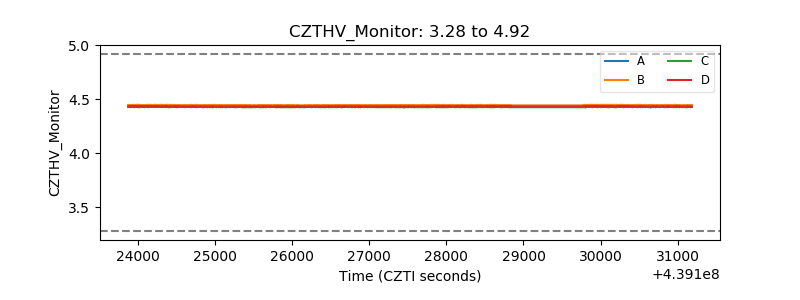 |
| D_VDD | 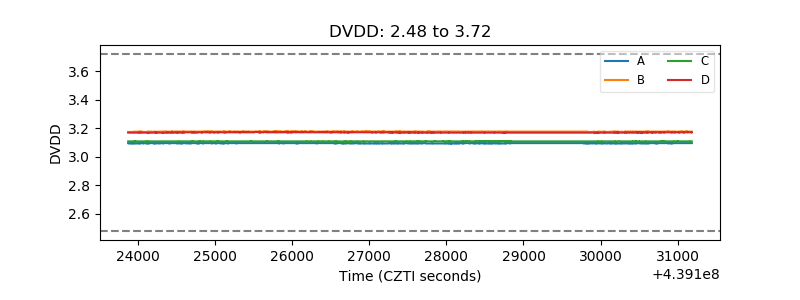 |
| Temperature 1 | 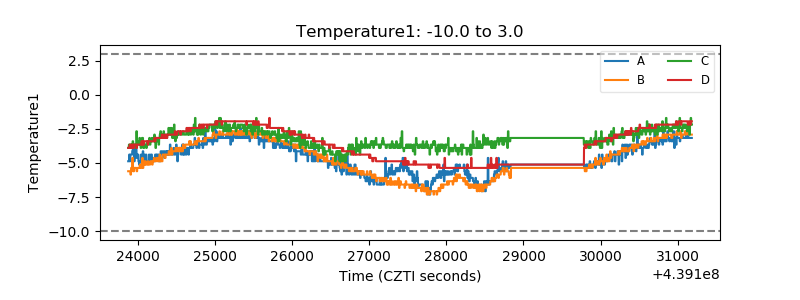 |
| Veto HV Monitor | 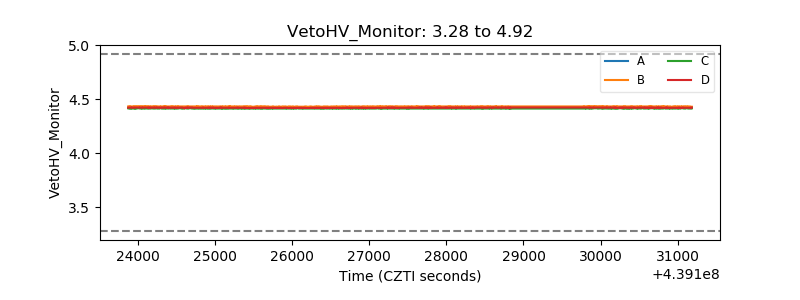 |
| Veto LLD | 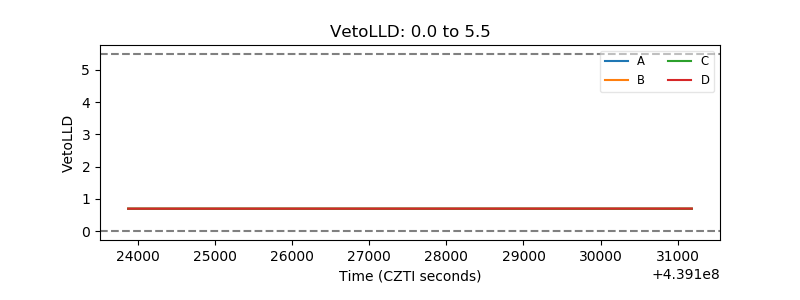 |
| Alpha Counter | 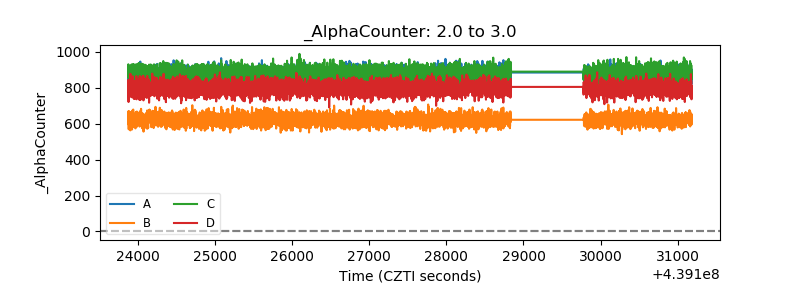 |
| _CPM_Rate | 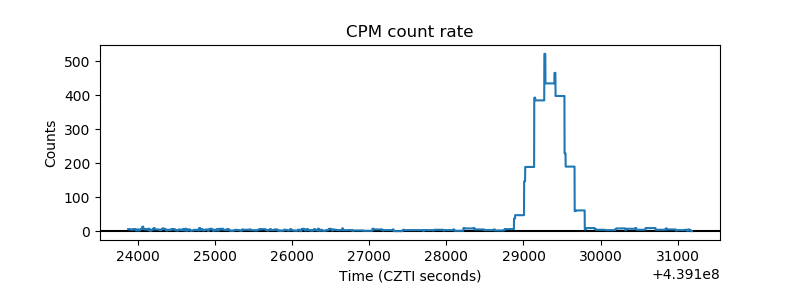 |
| CZT Counter | 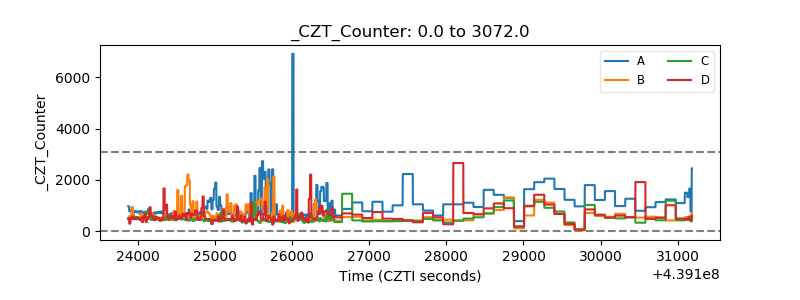 |
| +2.5 Volts monitor | 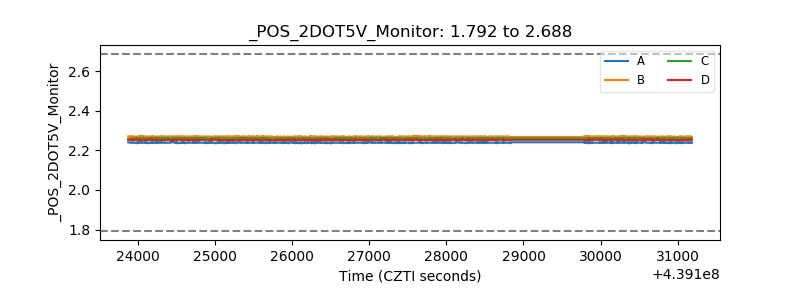 |
| +5 Volts monitor | 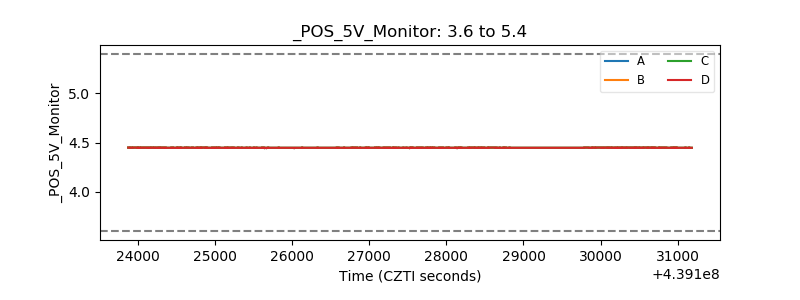 |
| _ROLL_ROT | 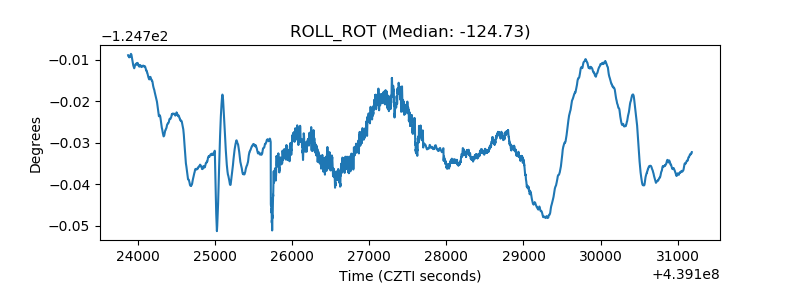 |
| _Roll_DEC | 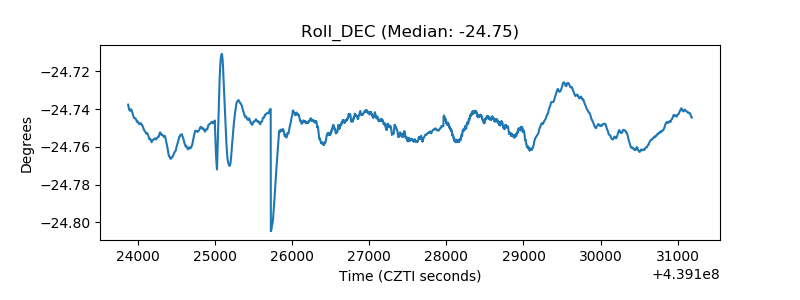 |
| _Roll_RA | 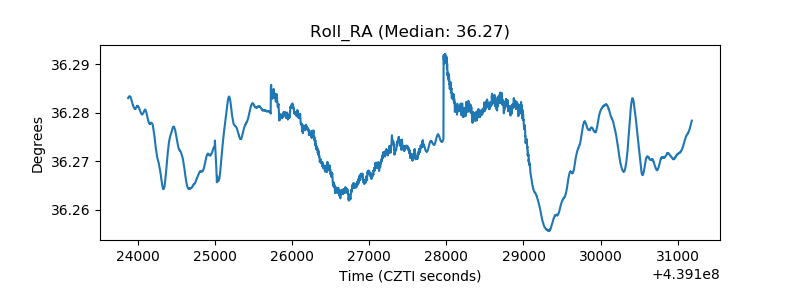 |
| Veto Counter | 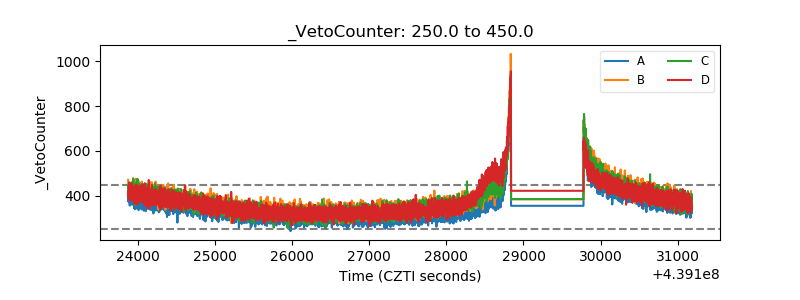 |