| Param | Original file | Final file |
|---|---|---|
| Filename | modeM0/AS1A13_047T01_9000005970_44211cztM0_level2.fits | modeM0/AS1A13_047T01_9000005970_44211cztM0_level2_quad_clean.evt |
| Size (bytes) | 596,741,760 | 99,060,480 |
| Size | 569.1 MB | 94.5 MB |
| Events in quadrant A | 8,485,810 | 663,169 |
| Events in quadrant B | 4,659,651 | 635,760 |
| Events in quadrant C | 3,049,500 | 680,320 |
| Events in quadrant D | 5,418,708 | 591,672 |
| Mode SS | |||
|---|---|---|---|
| Quadrant | BADHDUFLAG | Total packets | Discarded packets |
| A | 0 | 122 | 0 |
| B | 0 | 122 | 0 |
| C | 0 | 122 | 0 |
| D | 0 | 122 | 0 |
| Mode M9 | |||
|---|---|---|---|
| Quadrant | BADHDUFLAG | Total packets | Discarded packets |
| A | 0 | 12 | 0 |
| B | 0 | 12 | 0 |
| C | 0 | 12 | 0 |
| D | 0 | 12 | 0 |
| Mode M0 | |||
|---|---|---|---|
| Quadrant | BADHDUFLAG | Total packets | Discarded packets |
| A | 0 | 29547 | 1 |
| B | 0 | 17973 | 1 |
| C | 0 | 13511 | 1 |
| D | 0 | 20313 | 1 |
| Quadrant | Total seconds | Saturated seconds | Saturation percentage |
|---|---|---|---|
| A | 6149 | 655 | 10.652139% |
| B | 6149 | 768 | 12.489836% |
| C | 6149 | 77 | 1.252236% |
| D | 6149 | 480 | 7.806147% |
Noise dominated data is calculated using 1-second bins in cleaned event files. If a bin has >2000 counts, and if more than 50% of those come from <1% of pixels, then it is considered to be noise-dominated and hence unusable.
| Quadrant | # 1 sec bins | Bins with >0 counts | Bins with >2000 counts | High rate bins dominated by noise | Noise dominated (total time) | Noise dominated (detector-on time) | Marked lightcurve |
|---|---|---|---|---|---|---|---|
| A | 7259 | 6150 | 369 | 369 | 5.08% | 6.00% | 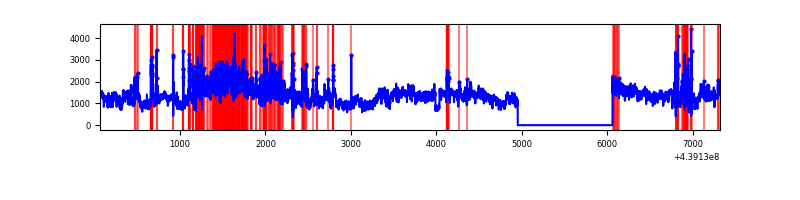 |
| B | 7259 | 6150 | 531 | 531 | 7.32% | 8.63% | 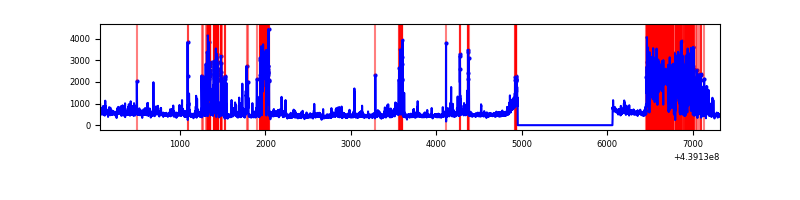 |
| C | 7259 | 6150 | 31 | 31 | 0.43% | 0.50% | 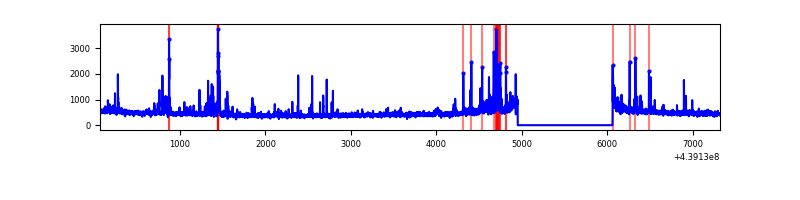 |
| D | 7259 | 6150 | 462 | 462 | 6.36% | 7.51% | 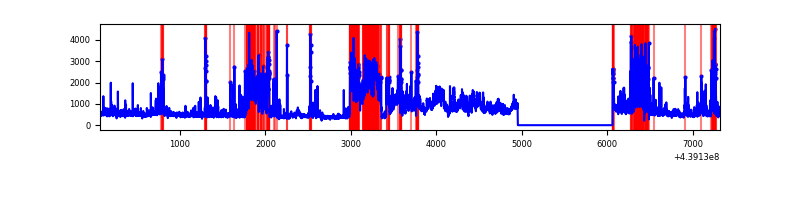 |
Top three noisy pixels from each quadrant. If the there are fewer than three noisy pixels in the level2.evt file, extra rows are filled as -1
| Pixel properties | Quadrant properties | ||||||
|---|---|---|---|---|---|---|---|
| Quadrant | DetID | PixID | Counts | Sigma | Mean | Median | Sigma |
| A | 15 | 223 | 4466732 | 31068.71 | 695 | 682 | 143.7 |
| A | 10 | 83 | 1300415 | 9041.78 | 695 | 682 | 143.7 |
| A | 2 | 79 | 22903 | 154.58 | 695 | 682 | 143.7 |
| B | 5 | 172 | 1727673 | 13291.16 | 655 | 636 | 129.9 |
| B | 0 | 200 | 103510 | 791.71 | 655 | 636 | 129.9 |
| B | 4 | 171 | 85588 | 653.78 | 655 | 636 | 129.9 |
| C | 14 | 254 | 143727 | 882.96 | 687 | 691 | 162.0 |
| C | 3 | 233 | 142284 | 874.05 | 687 | 691 | 162.0 |
| C | 4 | 254 | 84854 | 519.54 | 687 | 691 | 162.0 |
| D | 1 | 52 | 1651179 | 9657.14 | 674 | 654 | 170.9 |
| D | 2 | 249 | 836252 | 4889.04 | 674 | 654 | 170.9 |
| D | 13 | 249 | 192032 | 1119.74 | 674 | 654 | 170.9 |
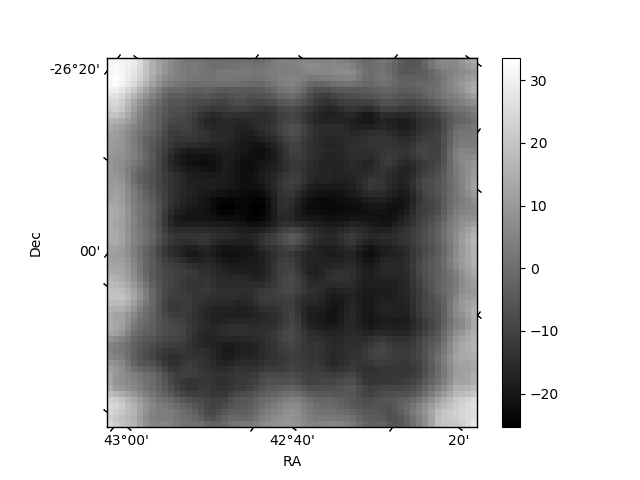
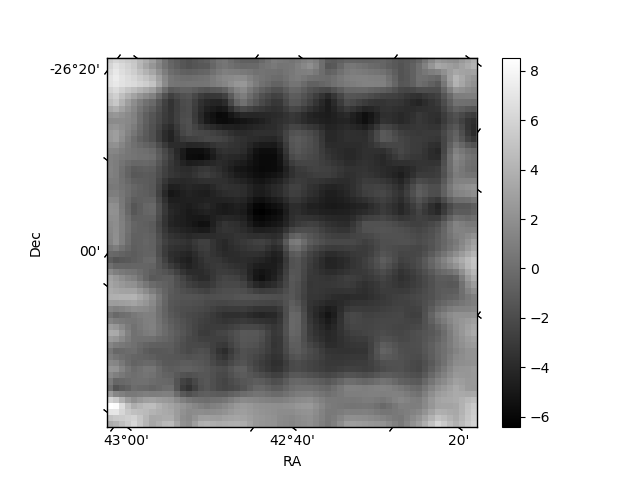
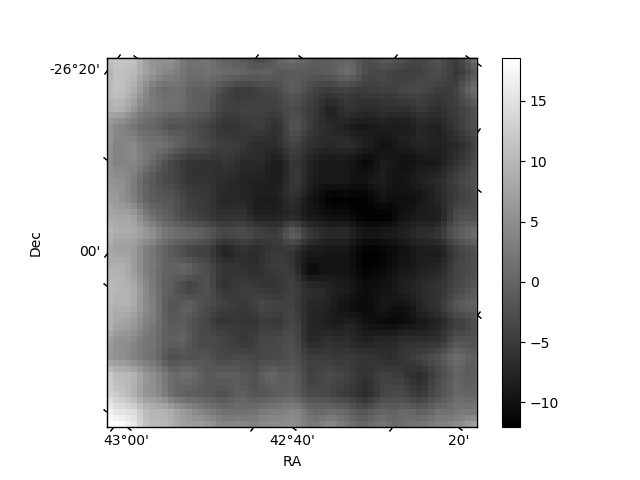
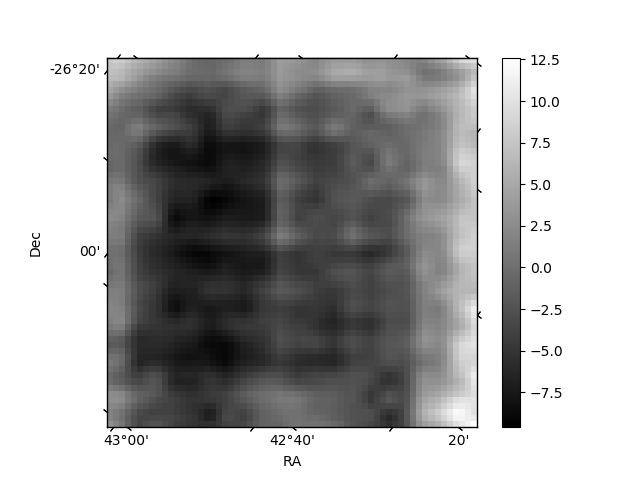
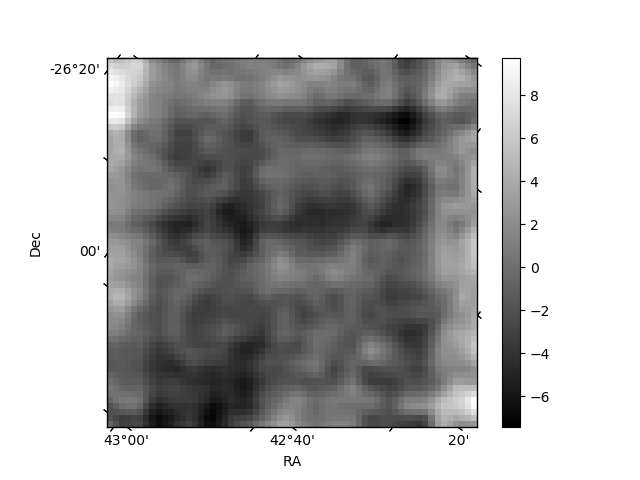
Histogram calculated using DETX and DETY for each event in the final _common_clean file
| Quadrant A | 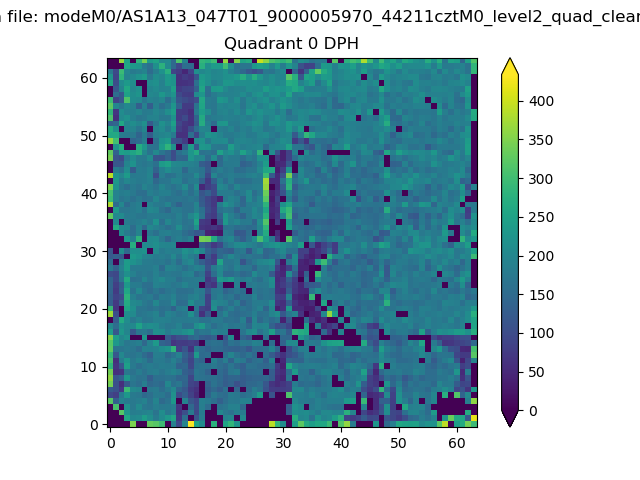 |
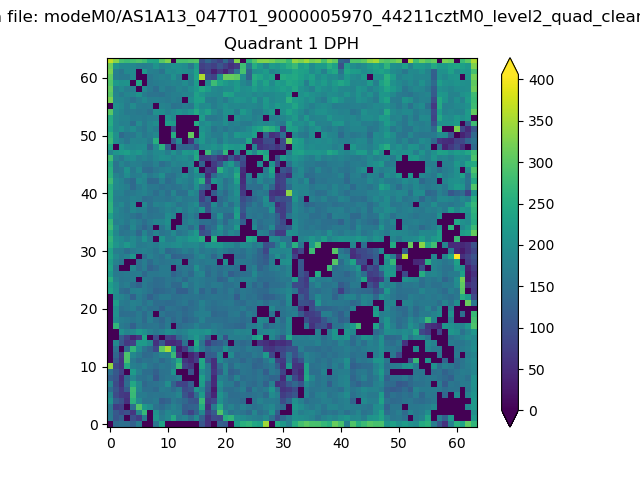 |
Quadrant B |
|---|---|---|---|
| Quadrant D | 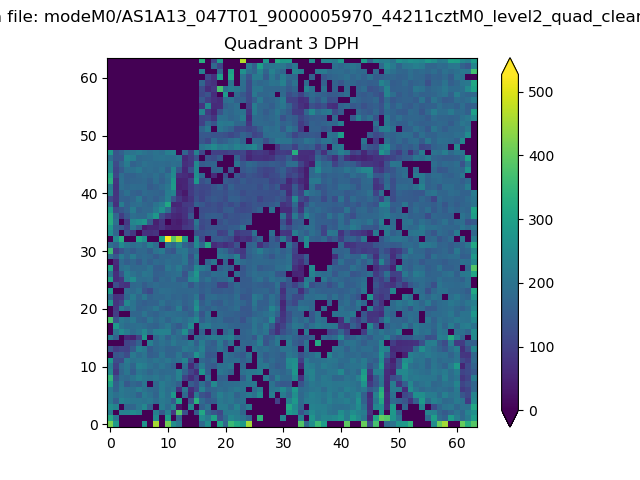 |
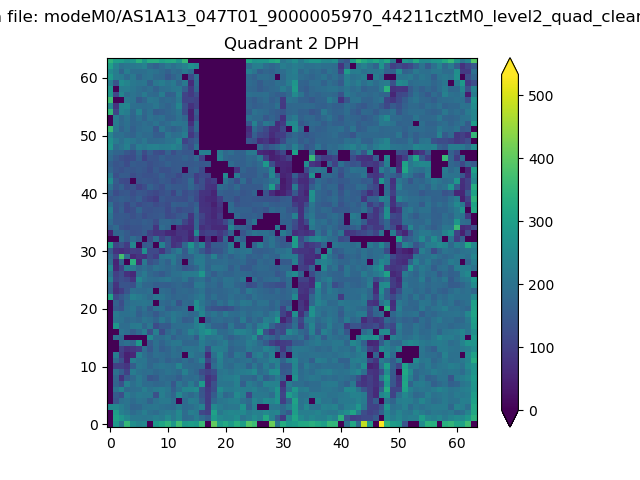 |
Quadrant C |
| Plot type | Count rate plots | Images |
|---|---|---|
| Comparison with Poisson distribution Blue bars denote a histogram of data divided into 1 sec bins. Red curve is a Poisson curve with rate = median count rate of data. |
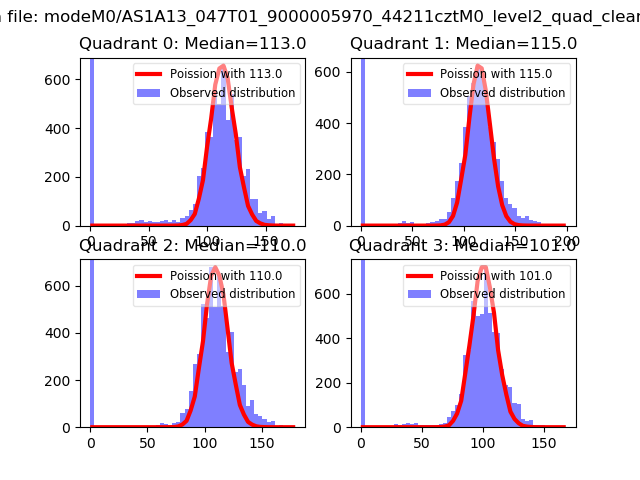 |
 |
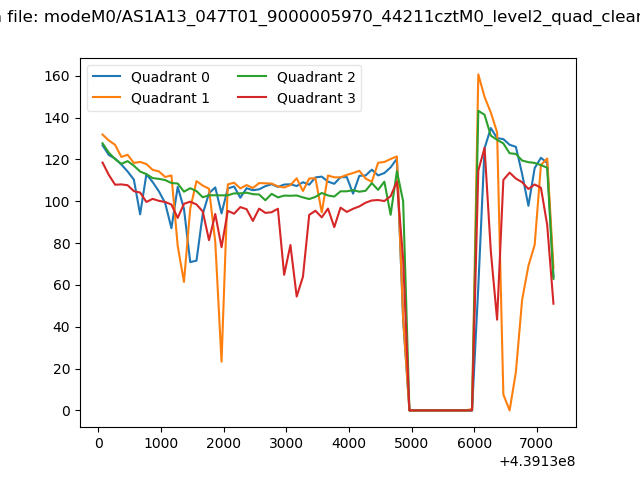
| Quadrant-wise count rates Data is divided into 100 sec bins |
 |
|
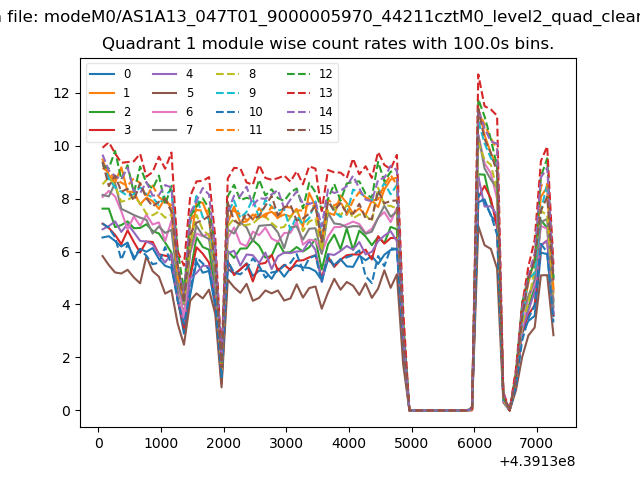
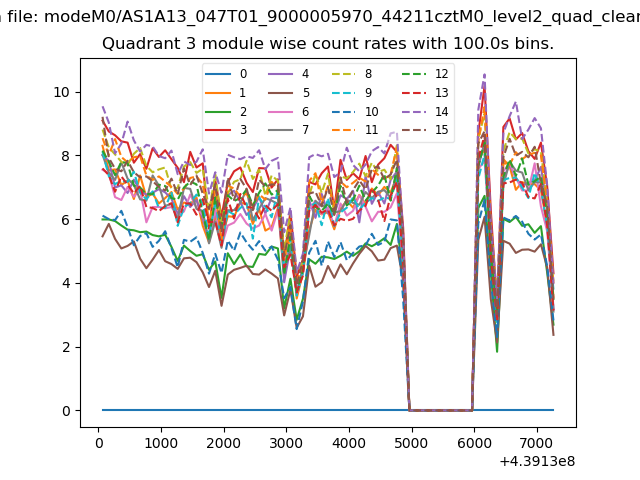
| Module-wise count rates for Quadrant A Data is divided into 100 sec bins |
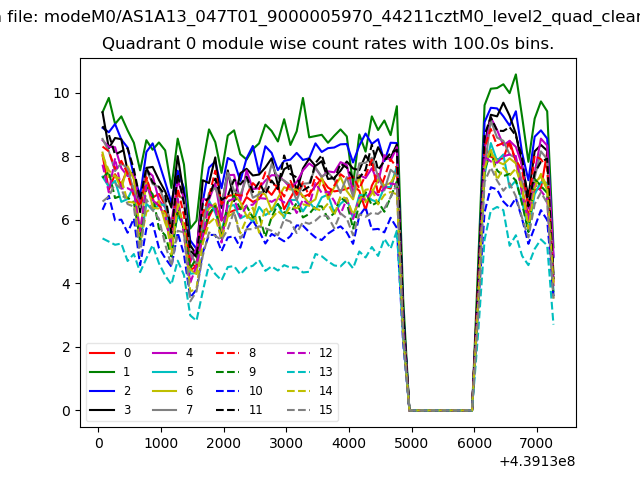 |
 |
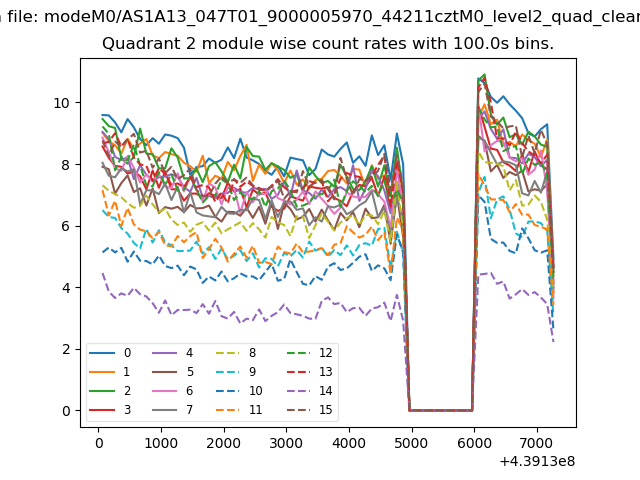
| Module-wise count rates for Quadrant B Data is divided into 100 sec bins |
 |
 |
| Module-wise count rates for Quadrant C Data is divided into 100 sec bins |
 |
 |
| Module-wise count rates for Quadrant D Data is divided into 100 sec bins |
 |
 |
| Parameter | Plot |
|---|---|
| CZT HV Monitor | 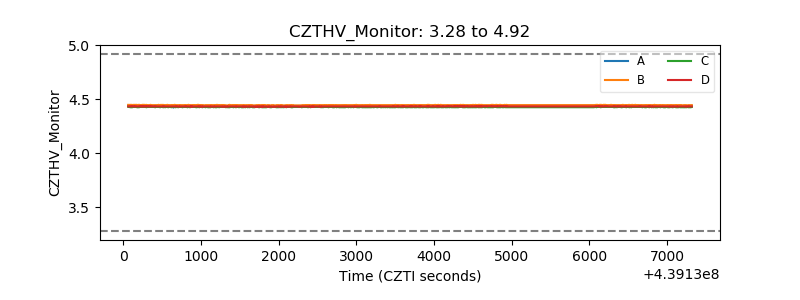 |
| D_VDD |  |
| Temperature 1 | 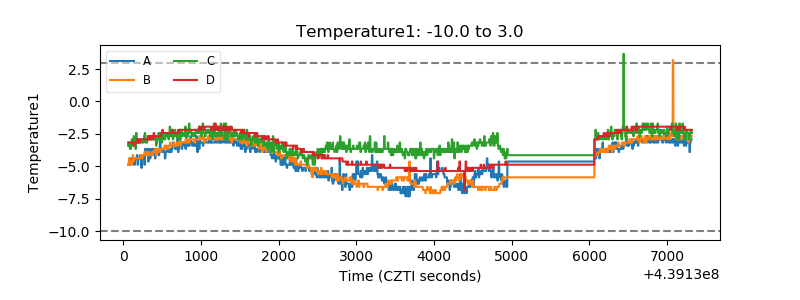 |
| Veto HV Monitor | 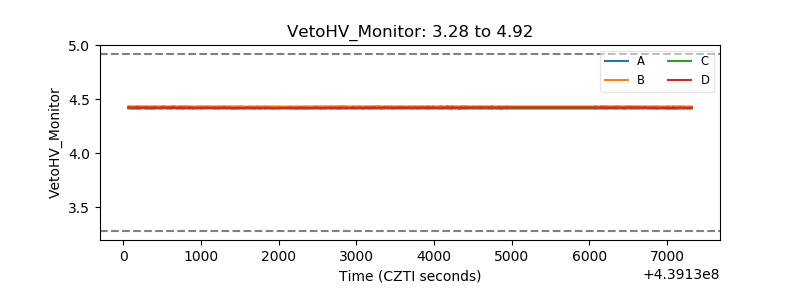 |
| Veto LLD | 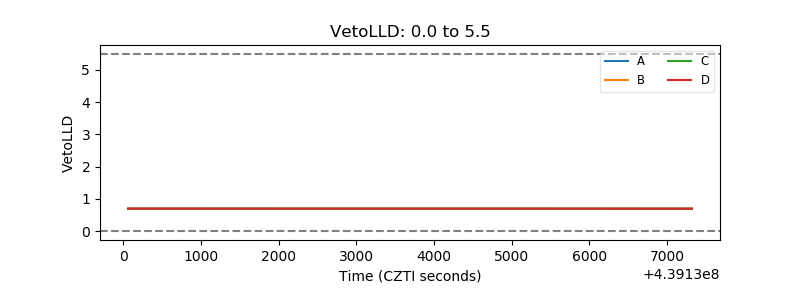 |
| Alpha Counter | 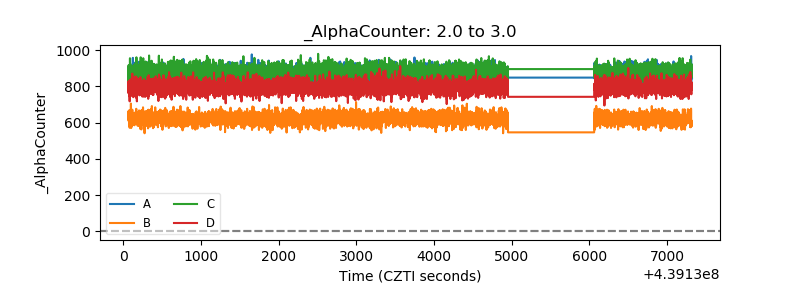 |
| _CPM_Rate | 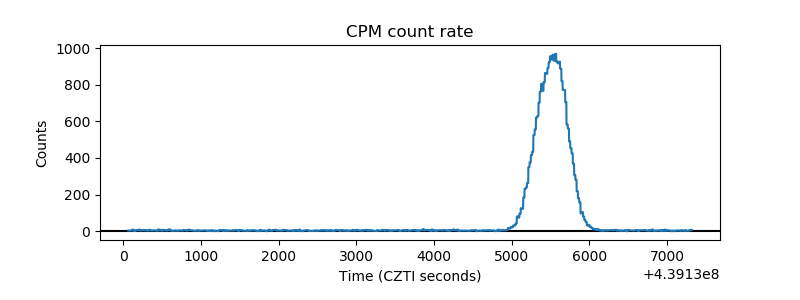 |
| CZT Counter | 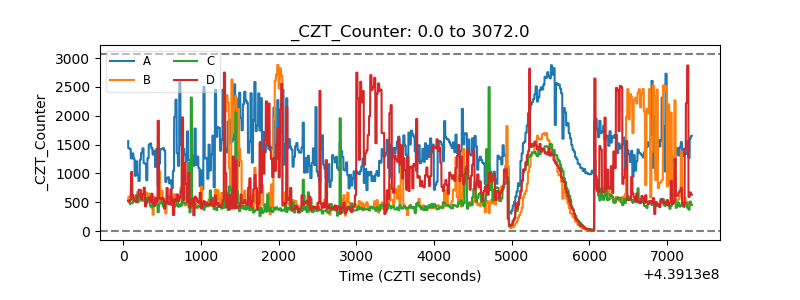 |
| +2.5 Volts monitor | 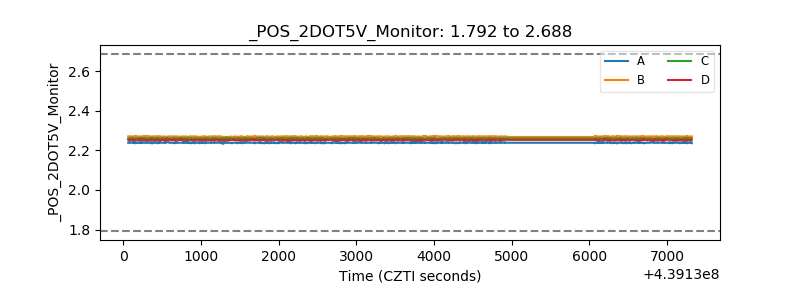 |
| +5 Volts monitor | 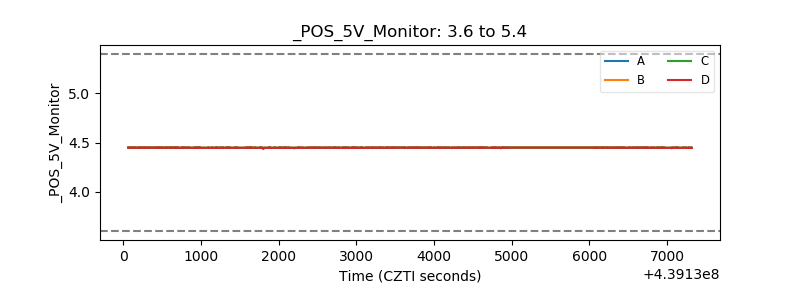 |
| _ROLL_ROT | 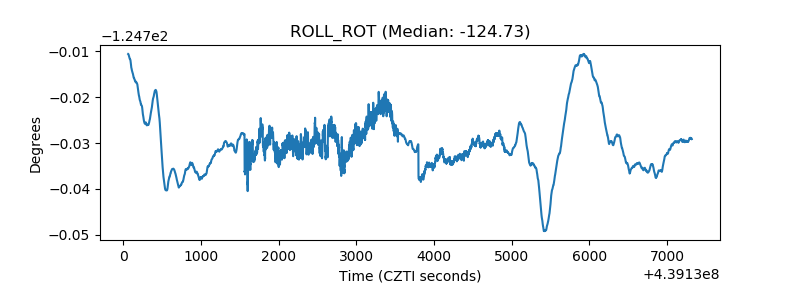 |
| _Roll_DEC | 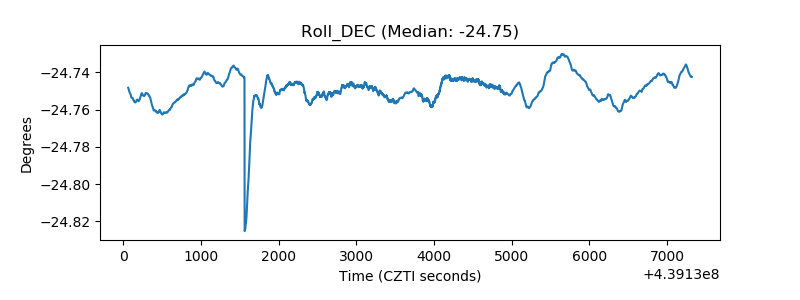 |
| _Roll_RA | 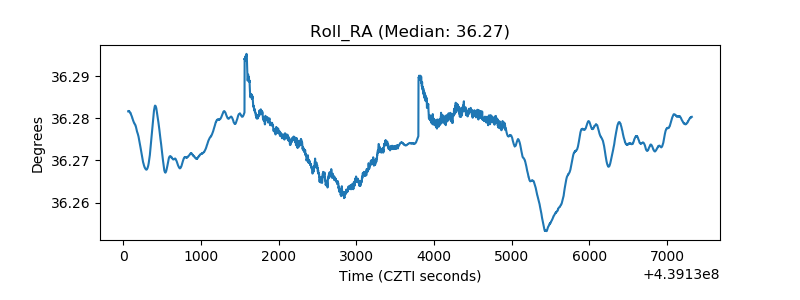 |
| Veto Counter | 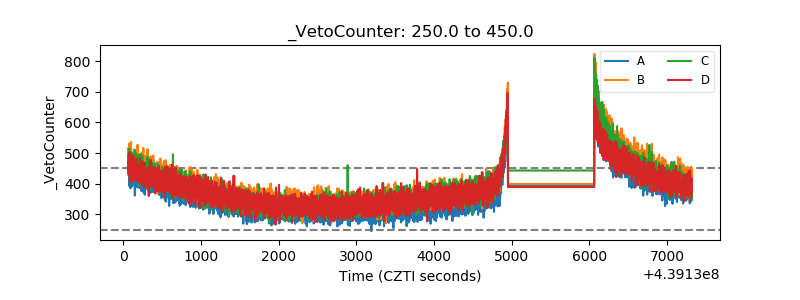 |