| Param | Original file | Final file |
|---|---|---|
| Filename | modeM0/AS1A13_047T01_9000005970_44212cztM0_level2.fits | modeM0/AS1A13_047T01_9000005970_44212cztM0_level2_quad_clean.evt |
| Size (bytes) | 559,457,280 | 109,324,800 |
| Size | 533.5 MB | 104.3 MB |
| Events in quadrant A | 8,384,765 | 733,511 |
| Events in quadrant B | 4,066,409 | 730,399 |
| Events in quadrant C | 3,222,797 | 734,277 |
| Events in quadrant D | 4,534,685 | 661,518 |
| Mode SS | |||
|---|---|---|---|
| Quadrant | BADHDUFLAG | Total packets | Discarded packets |
| A | 0 | 130 | 0 |
| B | 0 | 130 | 0 |
| C | 0 | 130 | 0 |
| D | 0 | 130 | 0 |
| Mode M9 | |||
|---|---|---|---|
| Quadrant | BADHDUFLAG | Total packets | Discarded packets |
| A | 0 | 12 | 0 |
| B | 0 | 12 | 0 |
| C | 0 | 12 | 0 |
| D | 0 | 12 | 0 |
| Mode M0 | |||
|---|---|---|---|
| Quadrant | BADHDUFLAG | Total packets | Discarded packets |
| A | 0 | 29522 | 1 |
| B | 0 | 16484 | 1 |
| C | 0 | 14025 | 1 |
| D | 0 | 17878 | 1 |
| Quadrant | Total seconds | Saturated seconds | Saturation percentage |
|---|---|---|---|
| A | 6464 | 504 | 7.797030% |
| B | 6465 | 521 | 8.058778% |
| C | 6465 | 52 | 0.804331% |
| D | 6465 | 231 | 3.573086% |
Noise dominated data is calculated using 1-second bins in cleaned event files. If a bin has >2000 counts, and if more than 50% of those come from <1% of pixels, then it is considered to be noise-dominated and hence unusable.
| Quadrant | # 1 sec bins | Bins with >0 counts | Bins with >2000 counts | High rate bins dominated by noise | Noise dominated (total time) | Noise dominated (detector-on time) | Marked lightcurve |
|---|---|---|---|---|---|---|---|
| A | 7649 | 6465 | 196 | 196 | 2.56% | 3.03% |  |
| B | 7650 | 6466 | 346 | 346 | 4.52% | 5.35% |  |
| C | 7650 | 6466 | 25 | 25 | 0.33% | 0.39% | 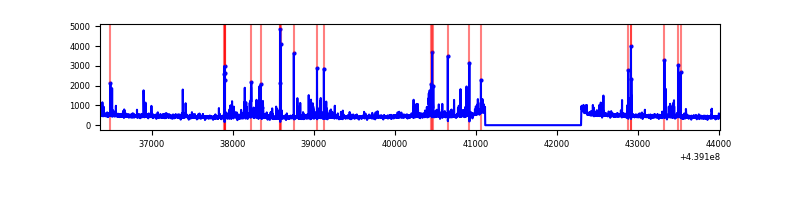 |
| D | 7650 | 6466 | 173 | 173 | 2.26% | 2.68% | 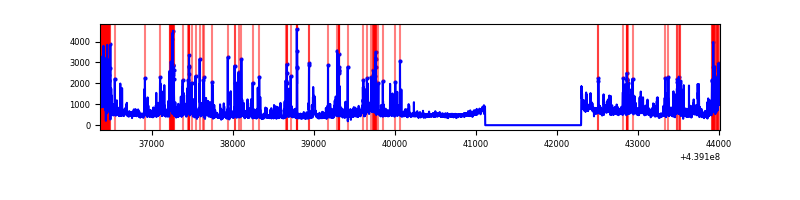 |
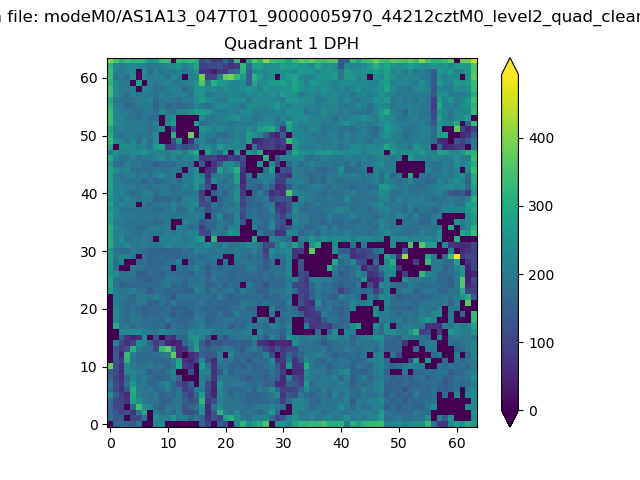
Top three noisy pixels from each quadrant. If the there are fewer than three noisy pixels in the level2.evt file, extra rows are filled as -1
| Pixel properties | Quadrant properties | ||||||
|---|---|---|---|---|---|---|---|
| Quadrant | DetID | PixID | Counts | Sigma | Mean | Median | Sigma |
| A | 15 | 223 | 4082551 | 26816.07 | 741 | 728 | 152.2 |
| A | 10 | 83 | 1400357 | 9195.05 | 741 | 728 | 152.2 |
| A | 2 | 79 | 34172 | 219.71 | 741 | 728 | 152.2 |
| B | 5 | 172 | 1027318 | 7321.63 | 718 | 697 | 140.2 |
| B | 0 | 200 | 52918 | 372.43 | 718 | 697 | 140.2 |
| B | 4 | 170 | 35209 | 246.13 | 718 | 697 | 140.2 |
| C | 4 | 254 | 155668 | 910.81 | 723 | 727 | 170.1 |
| C | 14 | 254 | 132465 | 774.41 | 723 | 727 | 170.1 |
| C | 3 | 233 | 102200 | 596.5 | 723 | 727 | 170.1 |
| D | 2 | 249 | 780303 | 4363.18 | 716 | 697 | 178.7 |
| D | 1 | 52 | 660255 | 3691.31 | 716 | 697 | 178.7 |
| D | 13 | 249 | 184896 | 1030.9 | 716 | 697 | 178.7 |
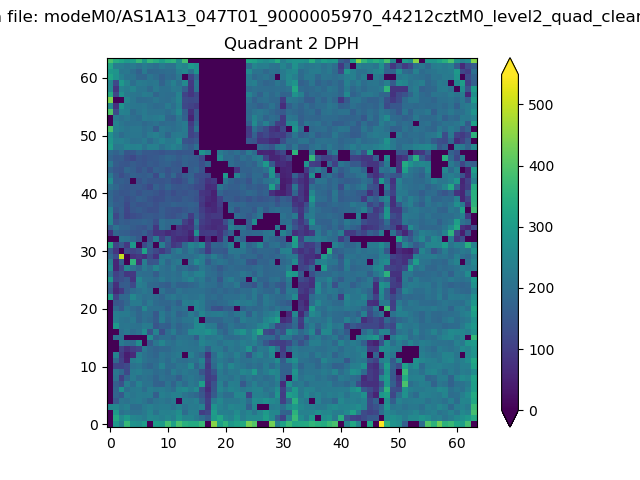
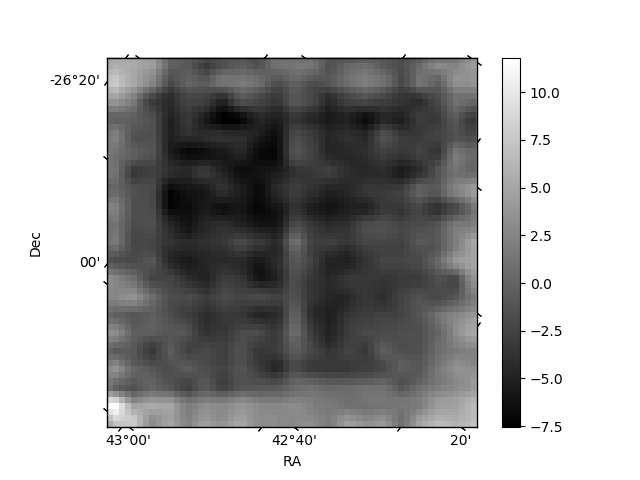
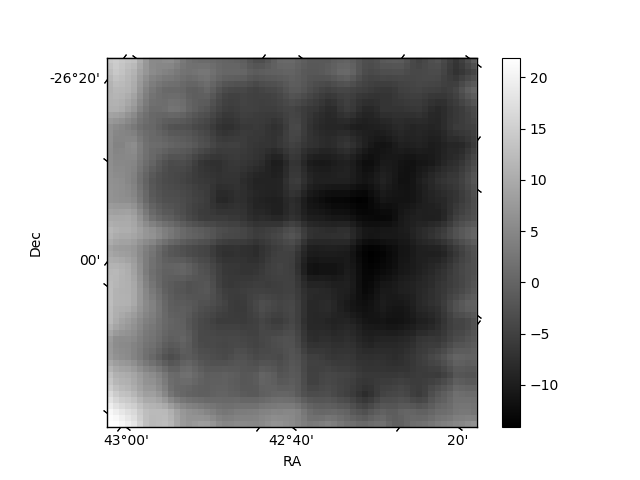
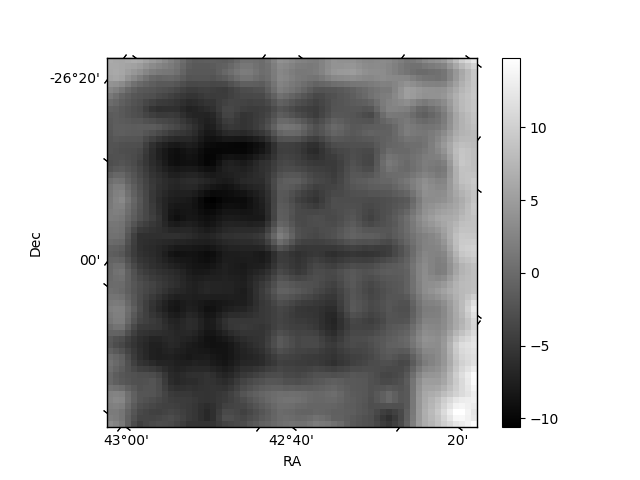
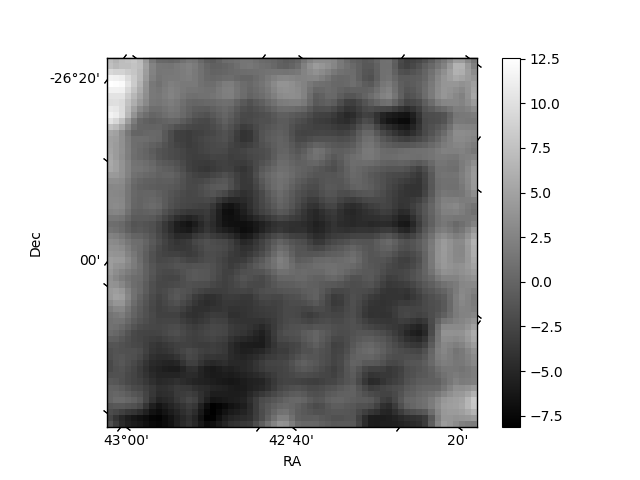
Histogram calculated using DETX and DETY for each event in the final _common_clean file
| Quadrant A | 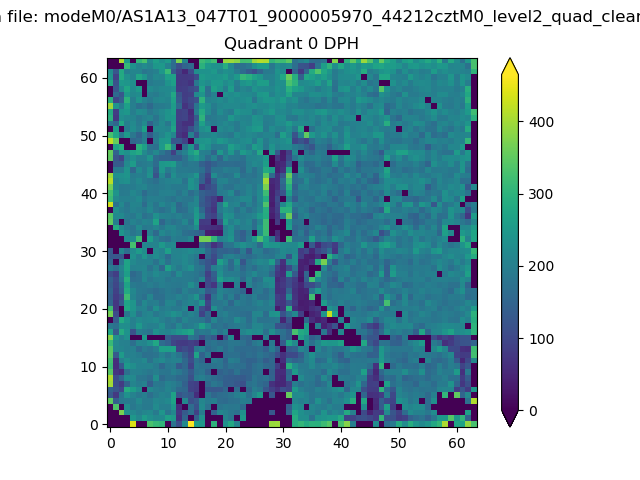 |
 |
Quadrant B |
|---|---|---|---|
| Quadrant D | 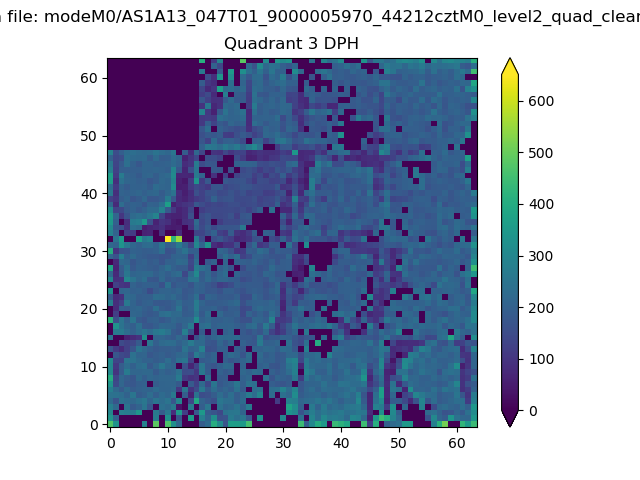 |
 |
Quadrant C |
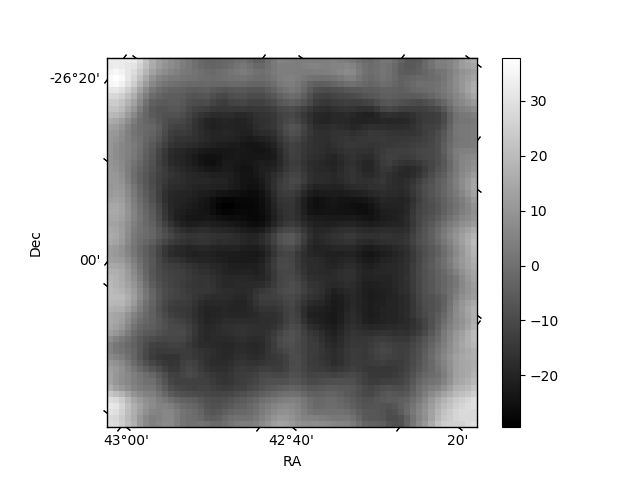
| Plot type | Count rate plots | Images |
|---|---|---|
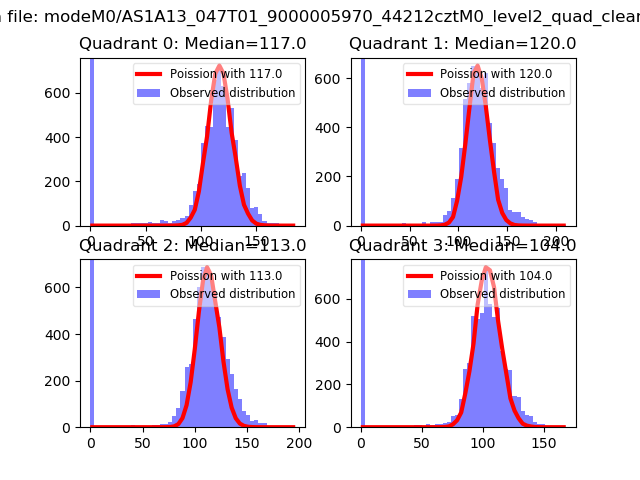
| Comparison with Poisson distribution Blue bars denote a histogram of data divided into 1 sec bins. Red curve is a Poisson curve with rate = median count rate of data. |
 |
 |
| Quadrant-wise count rates Data is divided into 100 sec bins |
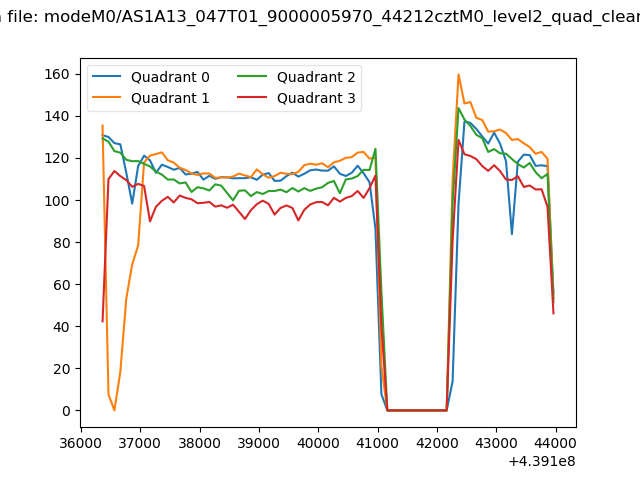 |
|
| Module-wise count rates for Quadrant A Data is divided into 100 sec bins |
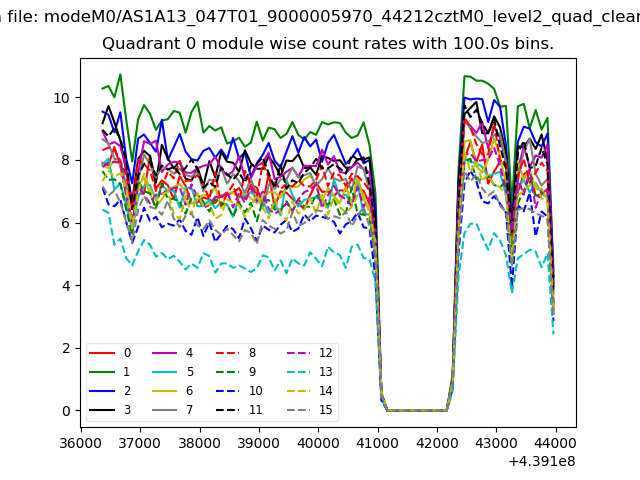 |
 |
| Module-wise count rates for Quadrant B Data is divided into 100 sec bins |
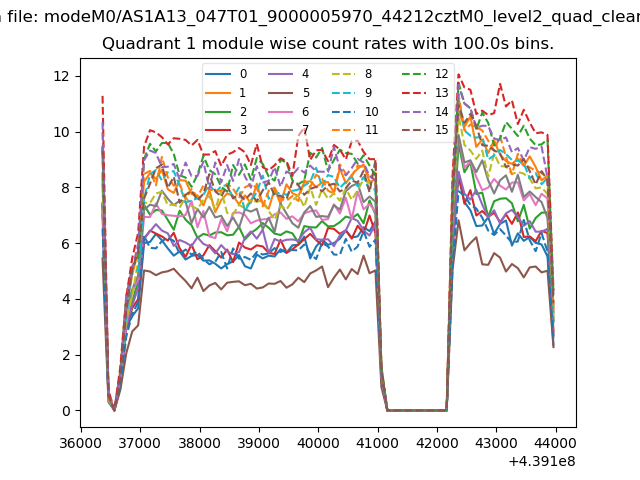 |
 |
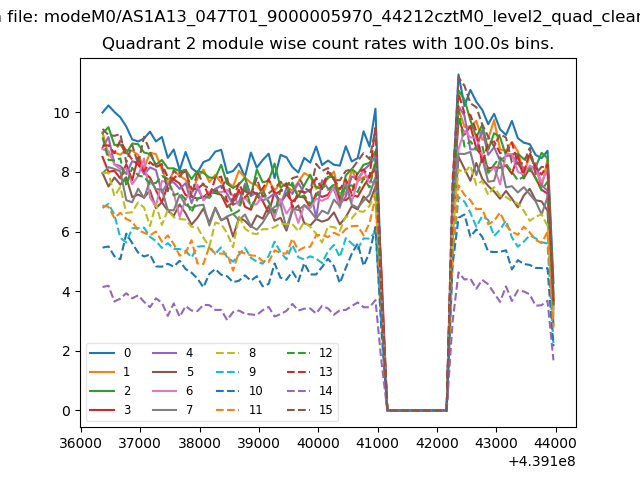
| Module-wise count rates for Quadrant C Data is divided into 100 sec bins |
 |
 |
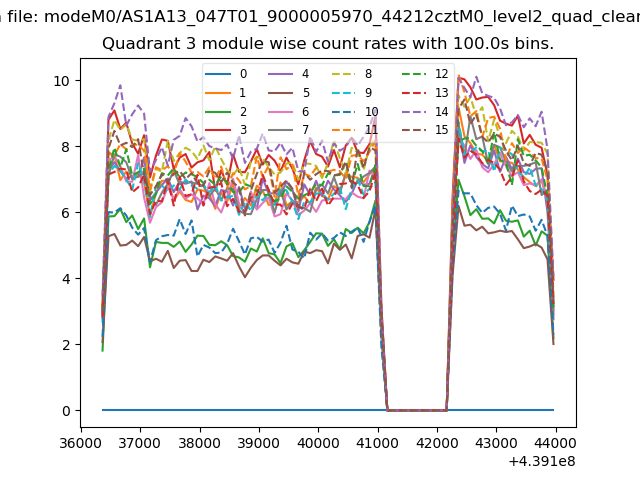
| Module-wise count rates for Quadrant D Data is divided into 100 sec bins |
 |
 |
| Parameter | Plot |
|---|---|
| CZT HV Monitor | 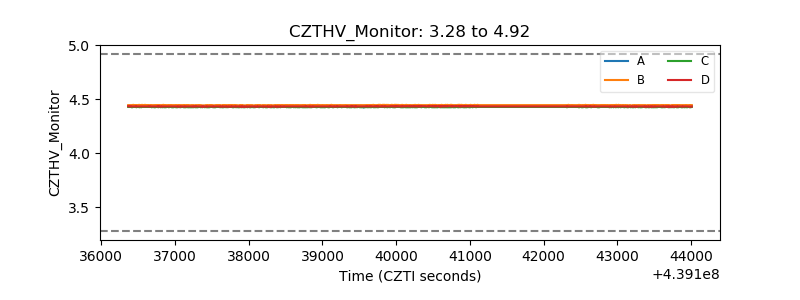 |
| D_VDD | 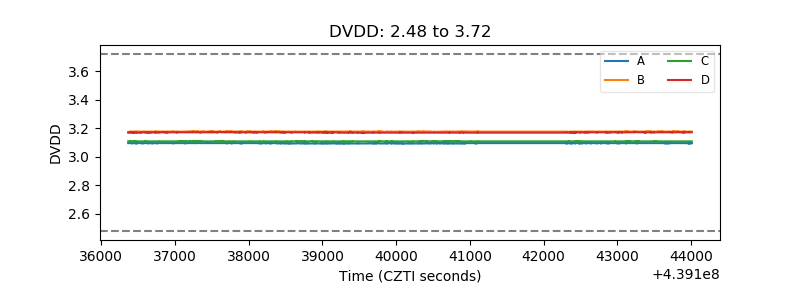 |
| Temperature 1 | 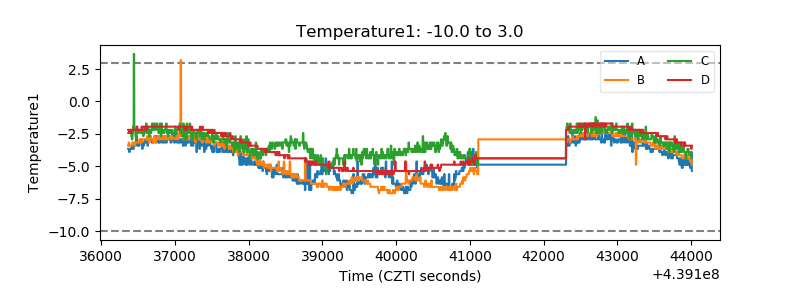 |
| Veto HV Monitor | 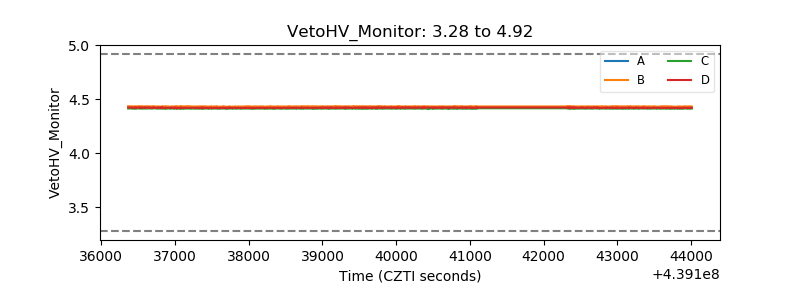 |
| Veto LLD | 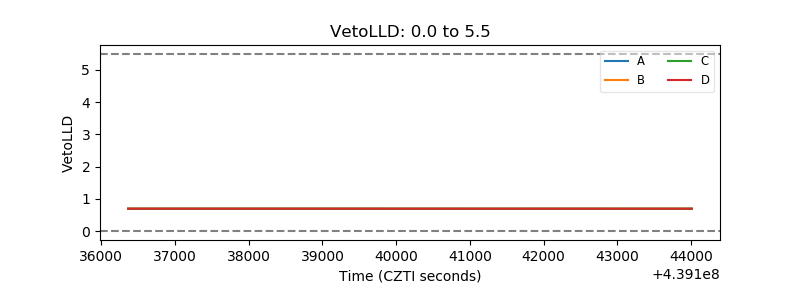 |
| Alpha Counter | 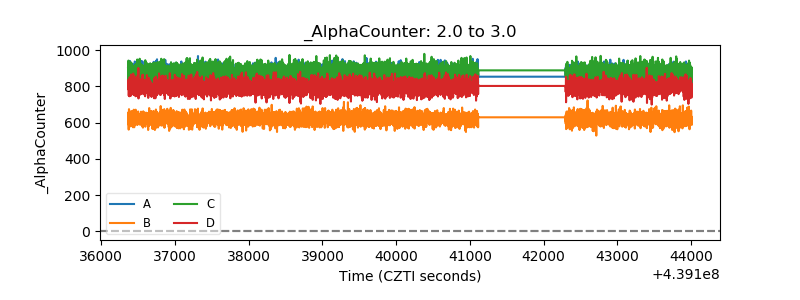 |
| _CPM_Rate | 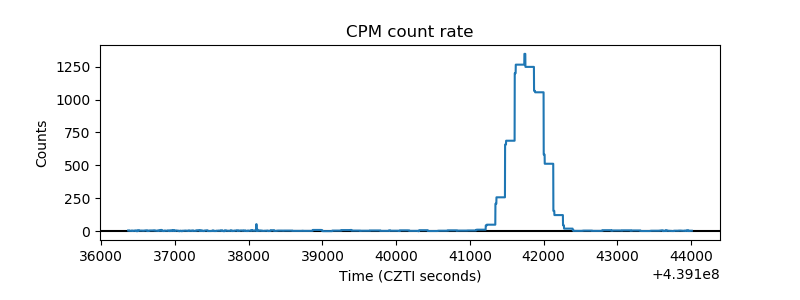 |
| CZT Counter | 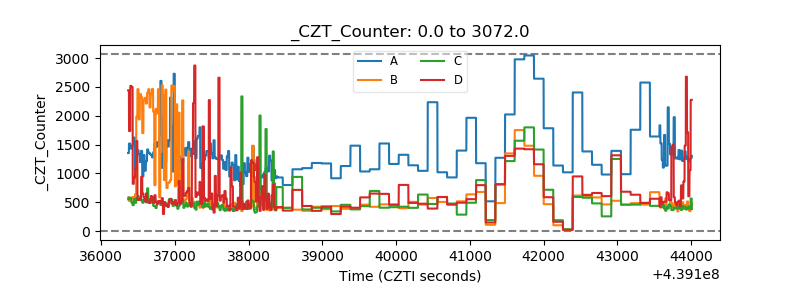 |
| +2.5 Volts monitor | 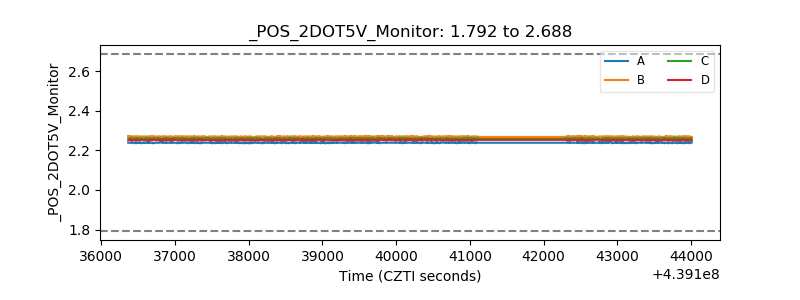 |
| +5 Volts monitor | 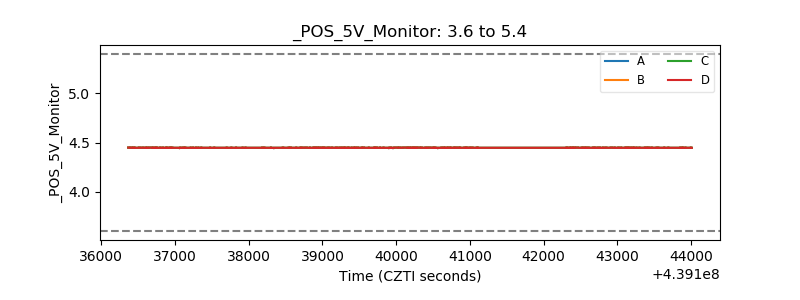 |
| _ROLL_ROT | 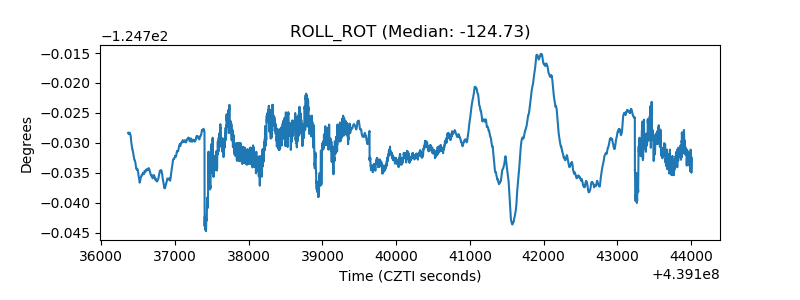 |
| _Roll_DEC | 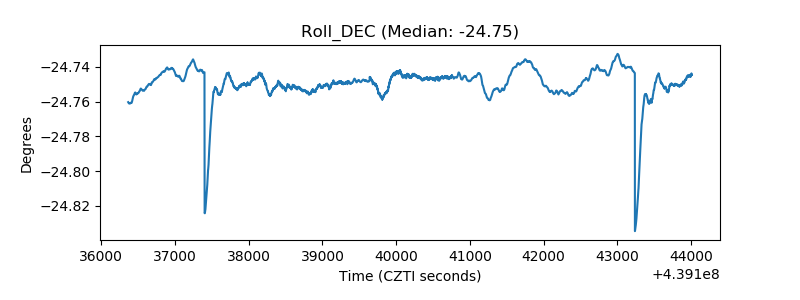 |
| _Roll_RA | 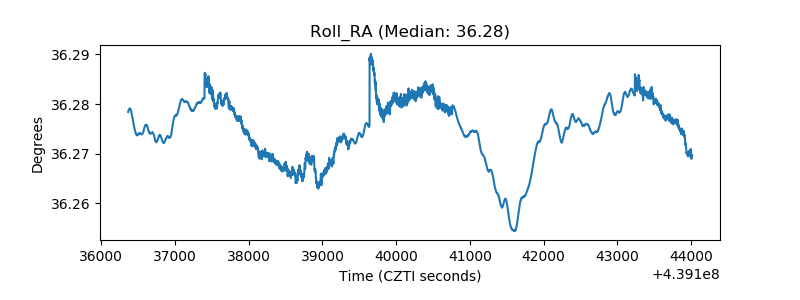 |
| Veto Counter | 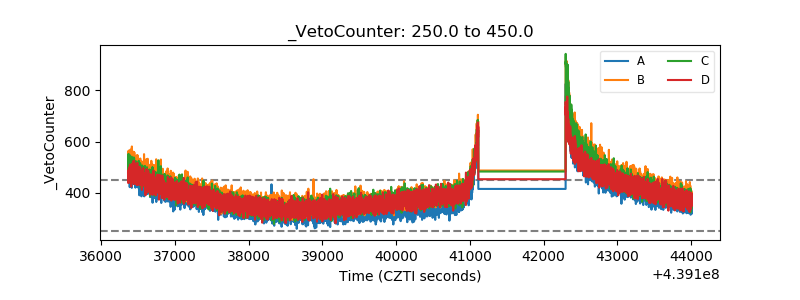 |