| Param | Original file | Final file |
|---|---|---|
| Filename | modeM0/AS1A13_047T01_9000005970_44215cztM0_level2.fits | modeM0/AS1A13_047T01_9000005970_44215cztM0_level2_quad_clean.evt |
| Size (bytes) | 616,440,960 | 103,795,200 |
| Size | 587.9 MB | 99.0 MB |
| Events in quadrant A | 11,983,129 | 568,094 |
| Events in quadrant B | 3,479,575 | 747,442 |
| Events in quadrant C | 2,981,594 | 717,946 |
| Events in quadrant D | 3,862,882 | 648,925 |
| Mode SS | |||
|---|---|---|---|
| Quadrant | BADHDUFLAG | Total packets | Discarded packets |
| A | 0 | 134 | 0 |
| B | 0 | 134 | 0 |
| C | 0 | 134 | 0 |
| D | 0 | 134 | 0 |
| Mode M9 | |||
|---|---|---|---|
| Quadrant | BADHDUFLAG | Total packets | Discarded packets |
| A | 0 | 10 | 0 |
| B | 0 | 10 | 0 |
| C | 0 | 10 | 0 |
| D | 0 | 10 | 0 |
| Mode M0 | |||
|---|---|---|---|
| Quadrant | BADHDUFLAG | Total packets | Discarded packets |
| A | 0 | 40148 | 1 |
| B | 0 | 14879 | 1 |
| C | 0 | 13843 | 1 |
| D | 0 | 16314 | 1 |
| Quadrant | Total seconds | Saturated seconds | Saturation percentage |
|---|---|---|---|
| A | 6600 | 2073 | 31.409091% |
| B | 6600 | 180 | 2.727273% |
| C | 6600 | 30 | 0.454545% |
| D | 6601 | 178 | 2.696561% |
Noise dominated data is calculated using 1-second bins in cleaned event files. If a bin has >2000 counts, and if more than 50% of those come from <1% of pixels, then it is considered to be noise-dominated and hence unusable.
| Quadrant | # 1 sec bins | Bins with >0 counts | Bins with >2000 counts | High rate bins dominated by noise | Noise dominated (total time) | Noise dominated (detector-on time) | Marked lightcurve |
|---|---|---|---|---|---|---|---|
| A | 7615 | 6601 | 2162 | 2162 | 28.39% | 32.75% | 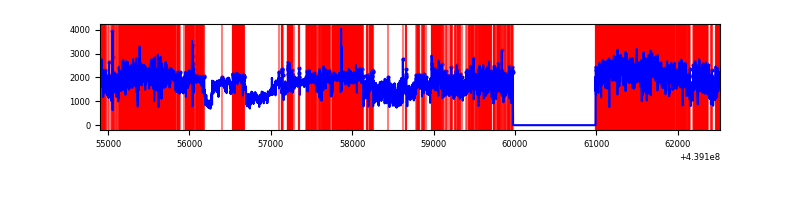 |
| B | 7615 | 6601 | 66 | 66 | 0.87% | 1.00% | 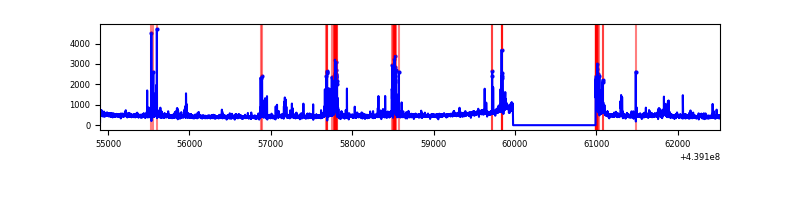 |
| C | 7615 | 6601 | 8 | 8 | 0.11% | 0.12% | 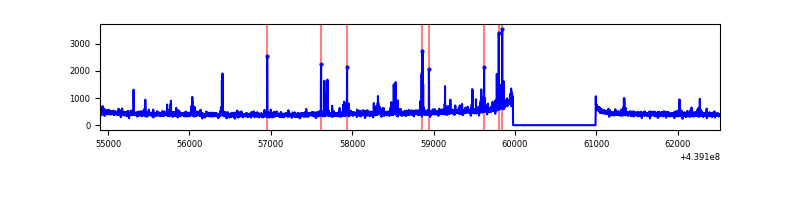 |
| D | 7616 | 6602 | 142 | 142 | 1.86% | 2.15% | 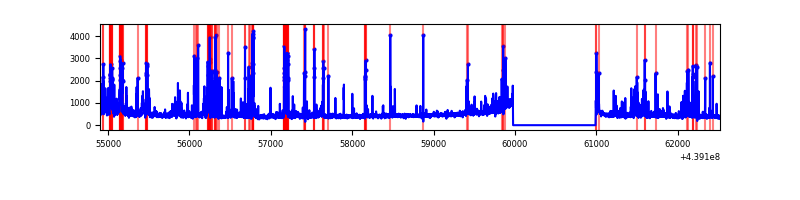 |
Top three noisy pixels from each quadrant. If the there are fewer than three noisy pixels in the level2.evt file, extra rows are filled as -1
| Pixel properties | Quadrant properties | ||||||
|---|---|---|---|---|---|---|---|
| Quadrant | DetID | PixID | Counts | Sigma | Mean | Median | Sigma |
| A | 15 | 223 | 7908786 | 55270.81 | 690 | 678 | 143.1 |
| A | 10 | 83 | 1361623 | 9511.82 | 690 | 678 | 143.1 |
| A | 12 | 227 | 45936 | 316.31 | 690 | 678 | 143.1 |
| B | 5 | 172 | 345731 | 2368.28 | 739 | 718 | 145.7 |
| B | 0 | 213 | 43785 | 295.63 | 739 | 718 | 145.7 |
| B | 4 | 170 | 34605 | 232.61 | 739 | 718 | 145.7 |
| C | 14 | 254 | 123660 | 716.38 | 724 | 727 | 171.6 |
| C | 3 | 233 | 30950 | 176.12 | 724 | 727 | 171.6 |
| C | 13 | 61 | 4789 | 23.67 | 724 | 727 | 171.6 |
| D | 1 | 52 | 449716 | 2456.6 | 716 | 692 | 182.8 |
| D | 2 | 249 | 327701 | 1789.06 | 716 | 692 | 182.8 |
| D | 13 | 249 | 94201 | 511.58 | 716 | 692 | 182.8 |
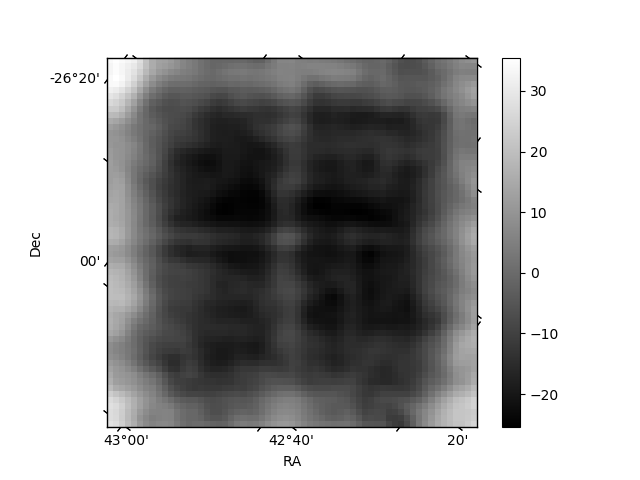
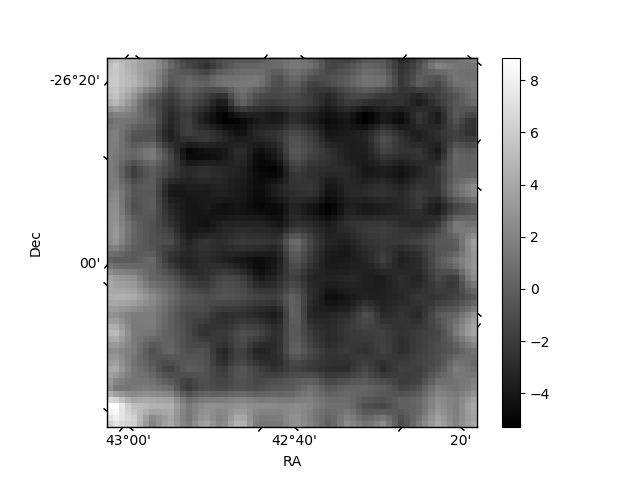
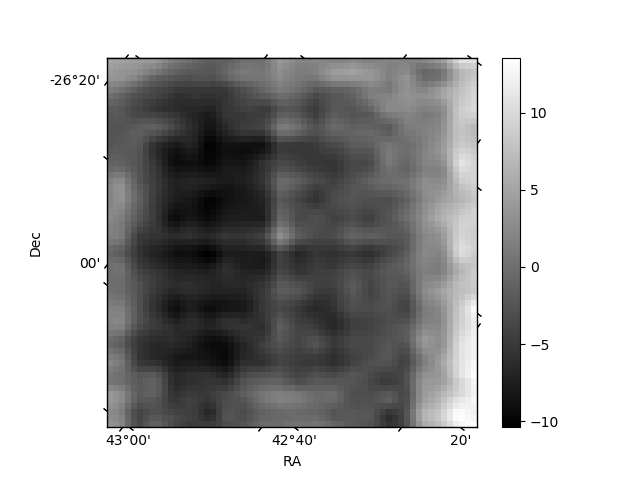
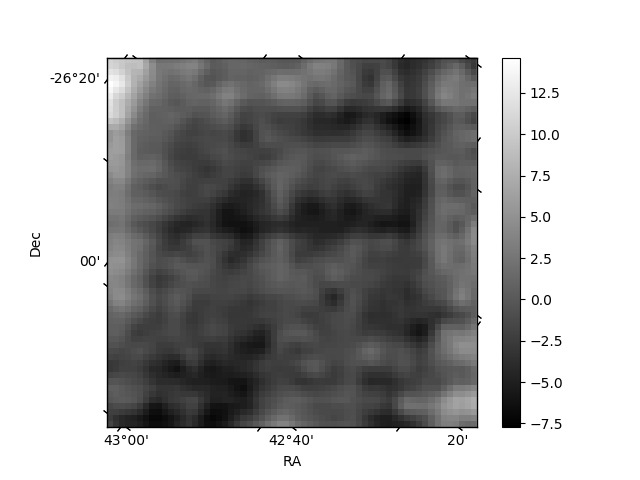
Histogram calculated using DETX and DETY for each event in the final _common_clean file
| Quadrant A | 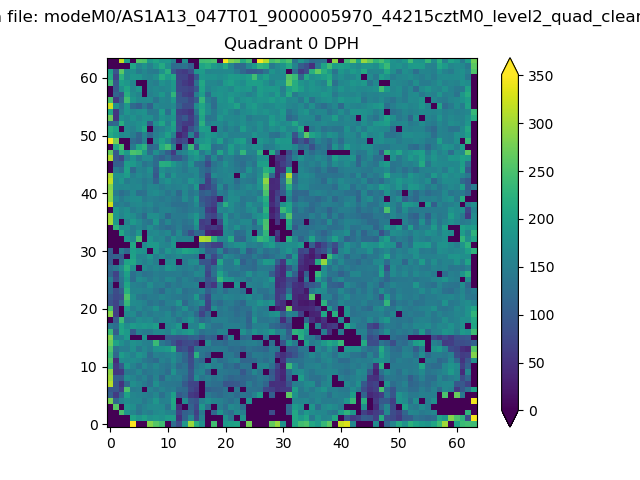 |
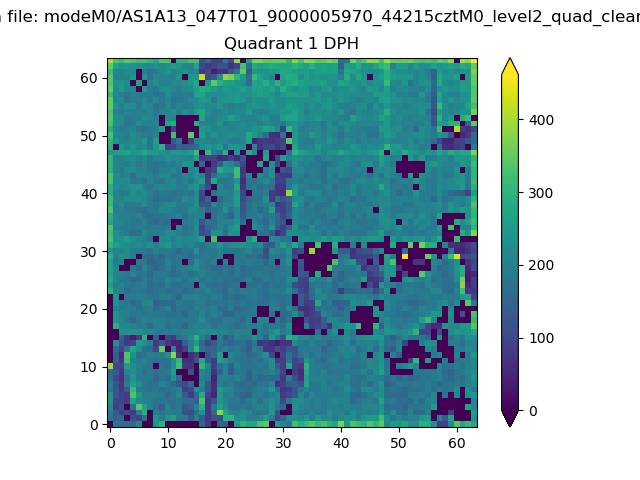 |
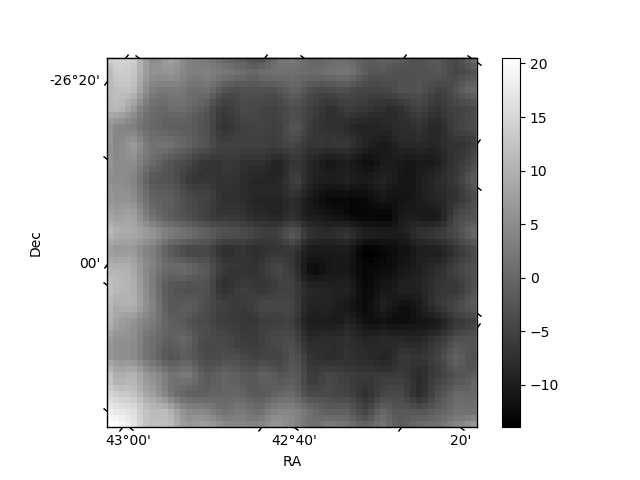
Quadrant B |
|---|---|---|---|
| Quadrant D | 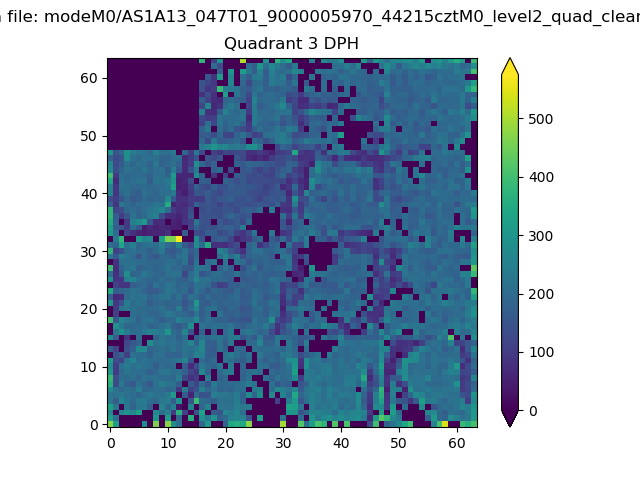 |
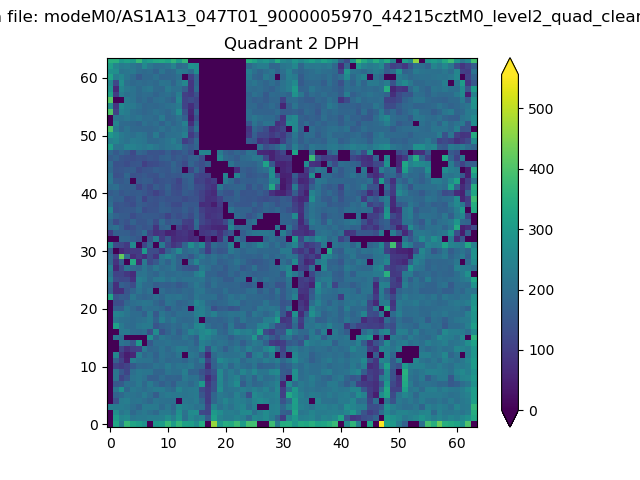 |
Quadrant C |
| Plot type | Count rate plots | Images |
|---|---|---|
| Comparison with Poisson distribution Blue bars denote a histogram of data divided into 1 sec bins. Red curve is a Poisson curve with rate = median count rate of data. |
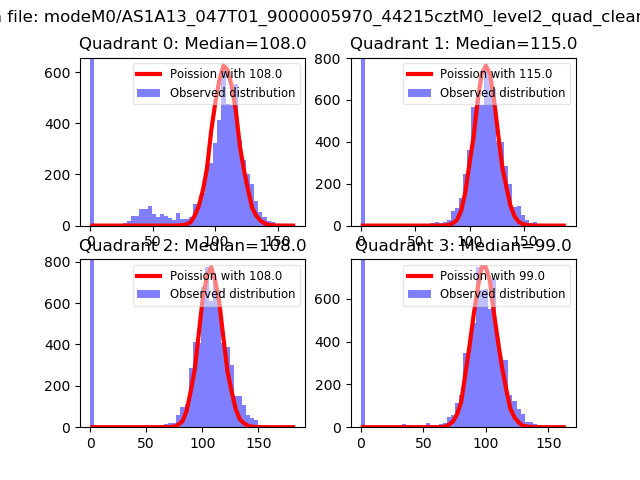 |
 |
| Quadrant-wise count rates Data is divided into 100 sec bins |
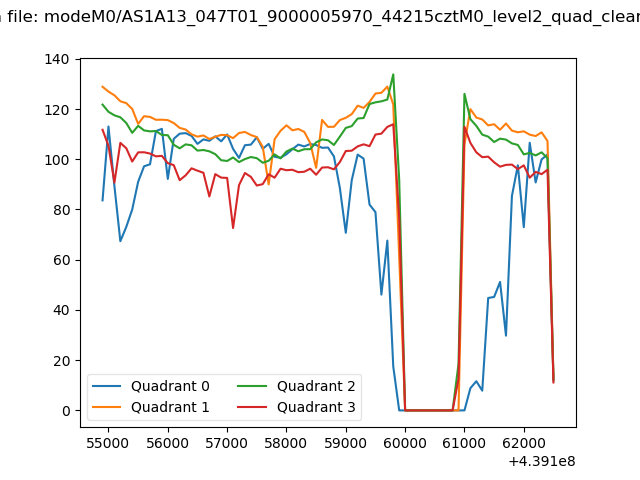 |
|
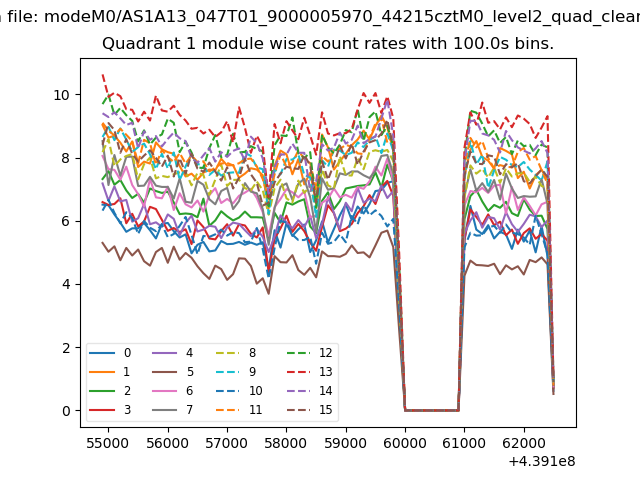
| Module-wise count rates for Quadrant A Data is divided into 100 sec bins |
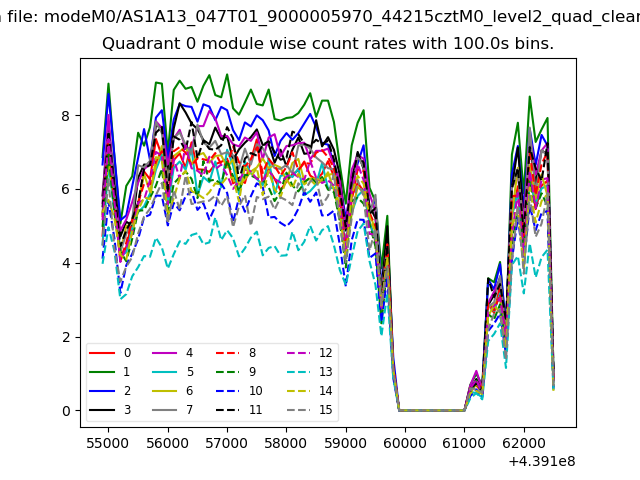 |
 |
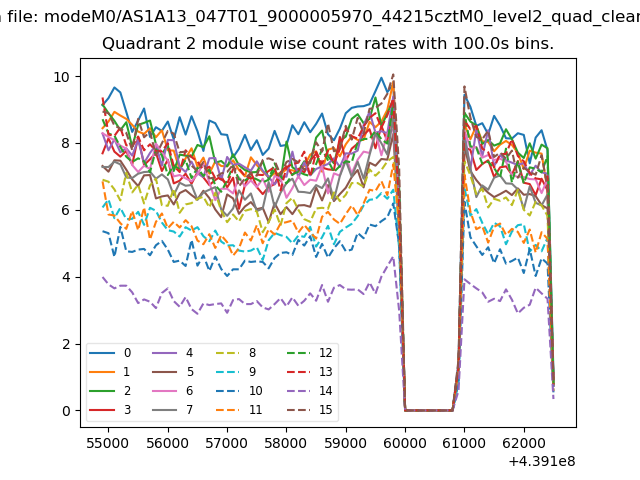
| Module-wise count rates for Quadrant B Data is divided into 100 sec bins |
 |
 |
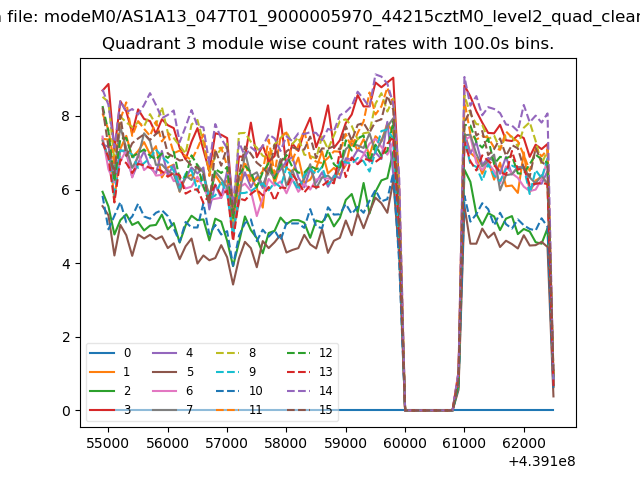
| Module-wise count rates for Quadrant C Data is divided into 100 sec bins |
 |
 |
| Module-wise count rates for Quadrant D Data is divided into 100 sec bins |
 |
 |
| Parameter | Plot |
|---|---|
| CZT HV Monitor | 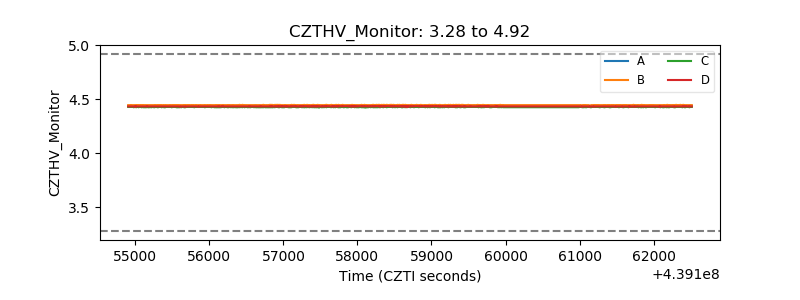 |
| D_VDD | 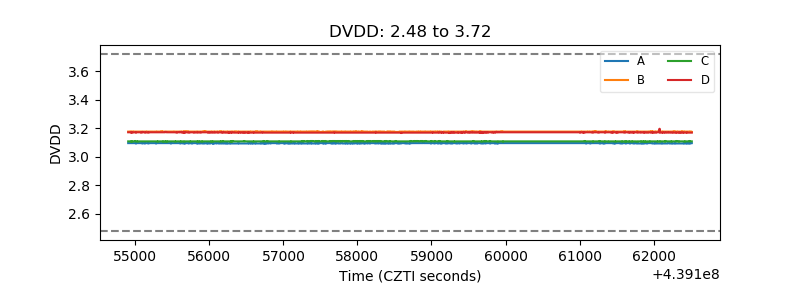 |
| Temperature 1 | 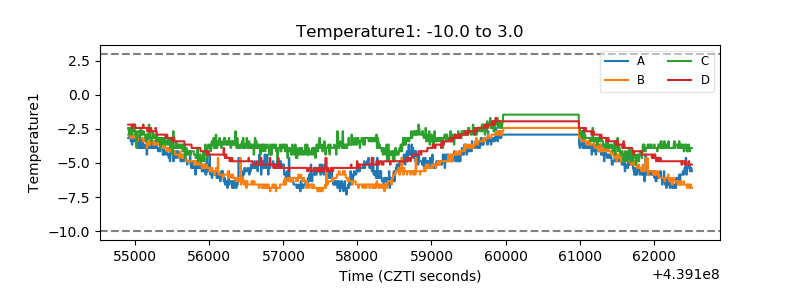 |
| Veto HV Monitor | 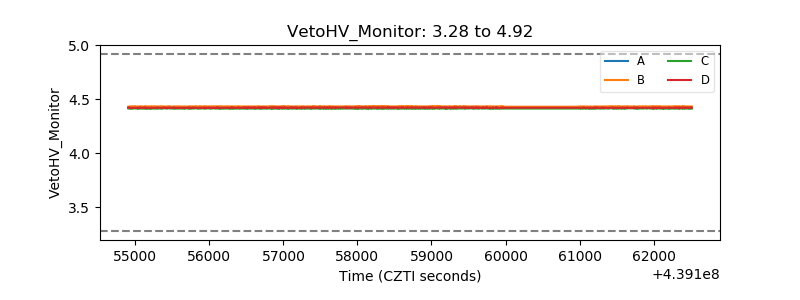 |
| Veto LLD | 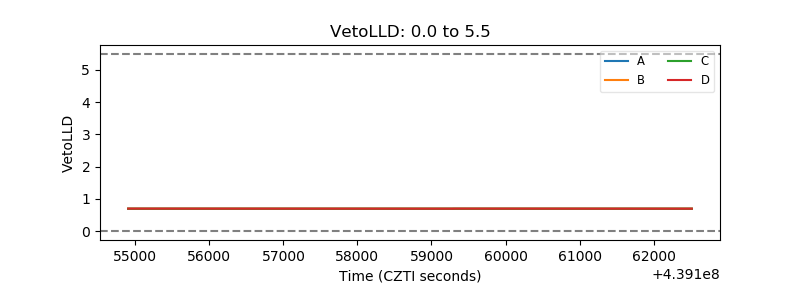 |
| Alpha Counter | 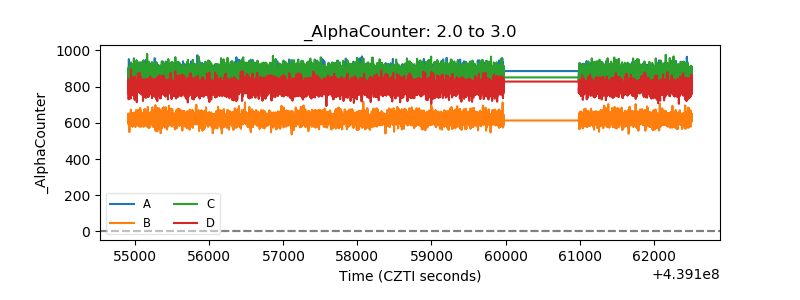 |
| _CPM_Rate | 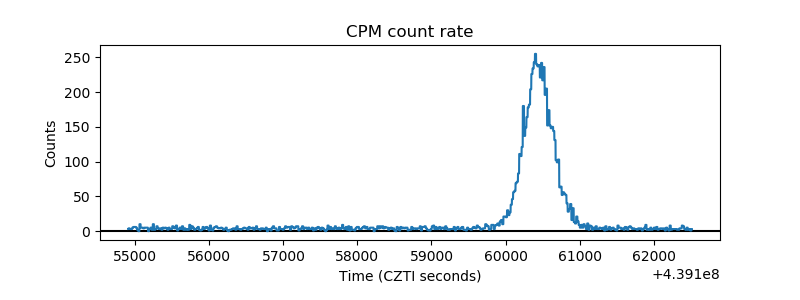 |
| CZT Counter | 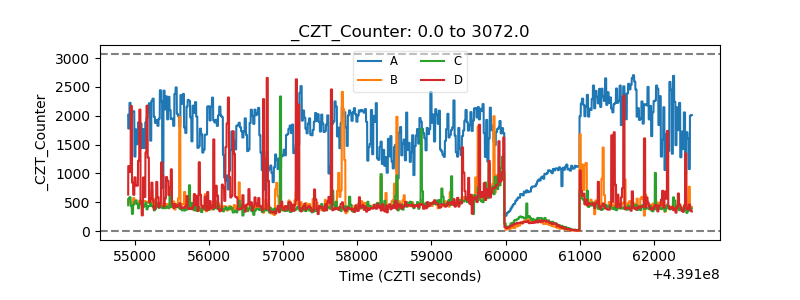 |
| +2.5 Volts monitor | 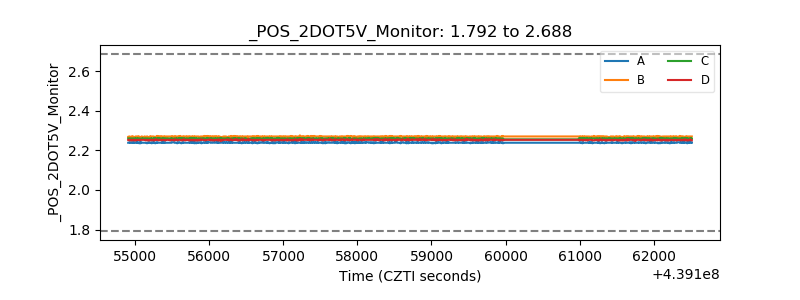 |
| +5 Volts monitor | 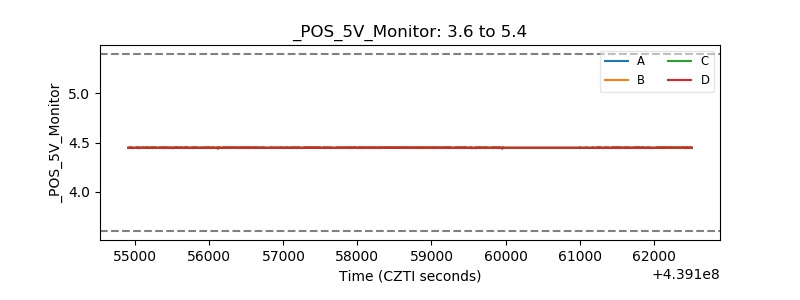 |
| _ROLL_ROT | 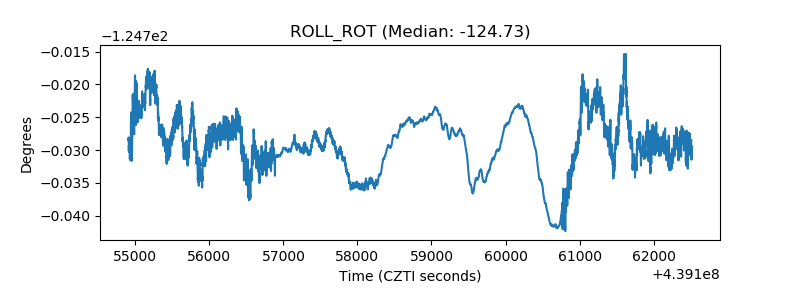 |
| _Roll_DEC | 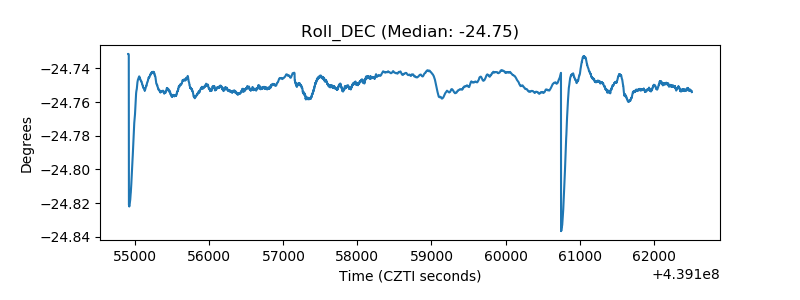 |
| _Roll_RA | 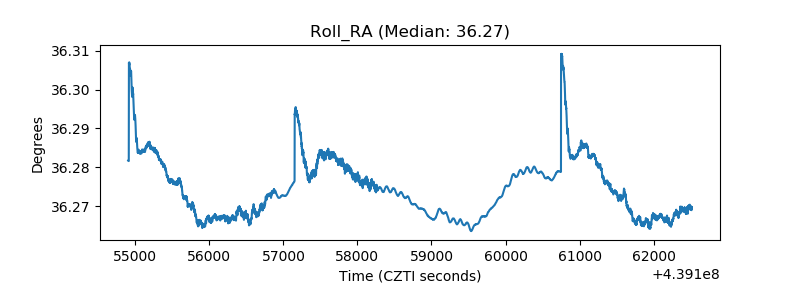 |
| Veto Counter | 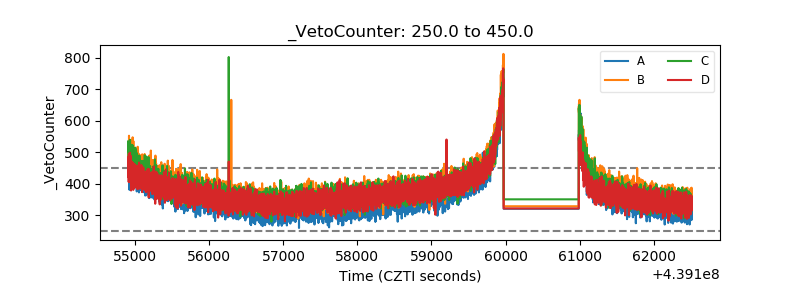 |