| Param | Original file | Final file |
|---|---|---|
| Filename | modeM0/AS1A13_071T06_9000005972_44219cztM0_level2.fits | modeM0/AS1A13_071T06_9000005972_44219cztM0_level2_quad_clean.evt |
| Size (bytes) | 548,547,840 | 123,721,920 |
| Size | 523.1 MB | 118.0 MB |
| Events in quadrant A | 5,371,161 | 838,291 |
| Events in quadrant B | 4,024,732 | 864,267 |
| Events in quadrant C | 3,483,066 | 823,356 |
| Events in quadrant D | 6,804,506 | 663,368 |
| Mode M0 | |||
|---|---|---|---|
| Quadrant | BADHDUFLAG | Total packets | Discarded packets |
| A | 0 | 21511 | 0 |
| B | 0 | 17599 | 0 |
| C | 0 | 16597 | 6 |
| D | 0 | 26015 | 5 |
| Mode SS | |||
|---|---|---|---|
| Quadrant | BADHDUFLAG | Total packets | Discarded packets |
| A | 0 | 160 | 0 |
| B | 0 | 160 | 0 |
| C | 0 | 160 | 0 |
| D | 0 | 160 | 0 |
| Quadrant | Total seconds | Saturated seconds | Saturation percentage |
|---|---|---|---|
| A | 8010 | 161 | 2.009988% |
| B | 8010 | 88 | 1.098627% |
| C | 8006 | 25 | 0.312266% |
| D | 8008 | 1118 | 13.961039% |
Noise dominated data is calculated using 1-second bins in cleaned event files. If a bin has >2000 counts, and if more than 50% of those come from <1% of pixels, then it is considered to be noise-dominated and hence unusable.
| Quadrant | # 1 sec bins | Bins with >0 counts | Bins with >2000 counts | High rate bins dominated by noise | Noise dominated (total time) | Noise dominated (detector-on time) | Marked lightcurve |
|---|---|---|---|---|---|---|---|
| A | 8010 | 8010 | 106 | 106 | 1.32% | 1.32% | 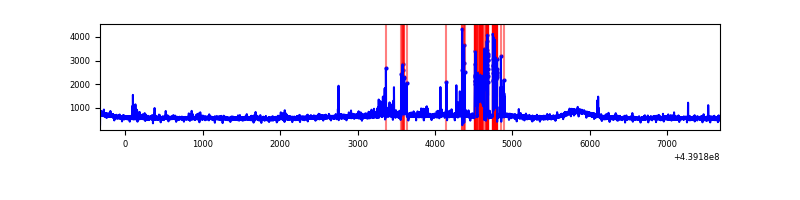 |
| B | 8010 | 8010 | 37 | 37 | 0.46% | 0.46% | 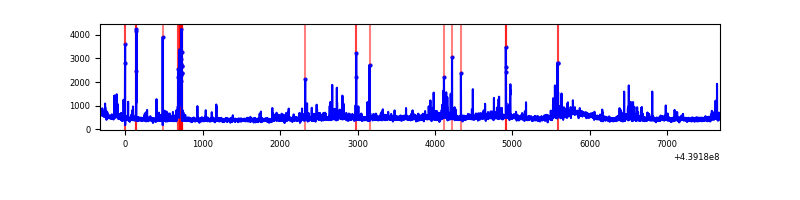 |
| C | 8010 | 8008 | 14 | 14 | 0.17% | 0.17% | 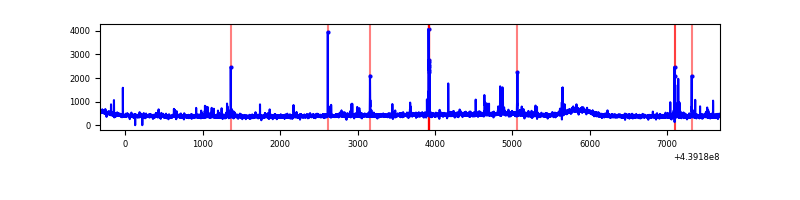 |
| D | 8010 | 8010 | 899 | 899 | 11.22% | 11.22% | 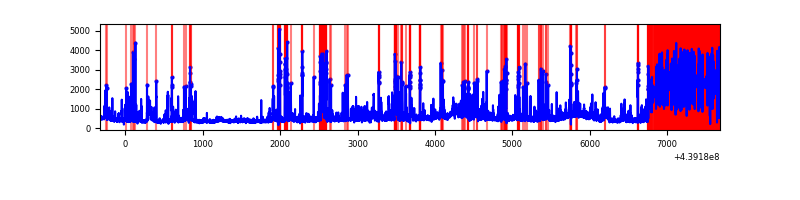 |
Top three noisy pixels from each quadrant. If the there are fewer than three noisy pixels in the level2.evt file, extra rows are filled as -1
| Pixel properties | Quadrant properties | ||||||
|---|---|---|---|---|---|---|---|
| Quadrant | DetID | PixID | Counts | Sigma | Mean | Median | Sigma |
| A | 10 | 83 | 1479776 | 8153.17 | 866 | 848 | 181.4 |
| A | 15 | 223 | 495865 | 2728.98 | 866 | 848 | 181.4 |
| A | 12 | 227 | 35236 | 189.58 | 866 | 848 | 181.4 |
| B | 5 | 172 | 132767 | 766.36 | 867 | 840 | 172.1 |
| B | 0 | 200 | 120183 | 693.26 | 867 | 840 | 172.1 |
| B | 4 | 170 | 119358 | 688.46 | 867 | 840 | 172.1 |
| C | 14 | 254 | 127352 | 624.85 | 848 | 853 | 202.4 |
| C | 3 | 233 | 22983 | 109.31 | 848 | 853 | 202.4 |
| C | 11 | 16 | 7478 | 32.72 | 848 | 853 | 202.4 |
| D | 4 | 221 | 2035578 | 10224.18 | 783 | 756 | 199.0 |
| D | 13 | 249 | 1015604 | 5099.21 | 783 | 756 | 199.0 |
| D | 1 | 52 | 292077 | 1463.77 | 783 | 756 | 199.0 |
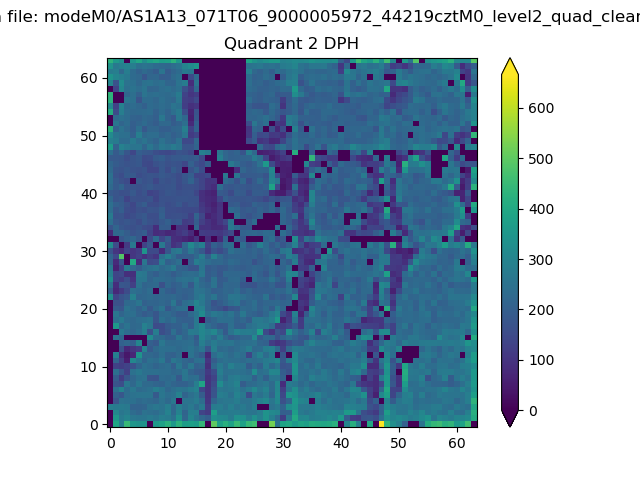
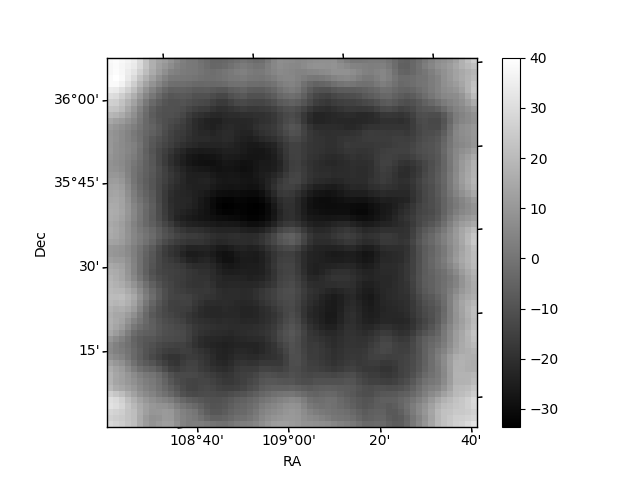
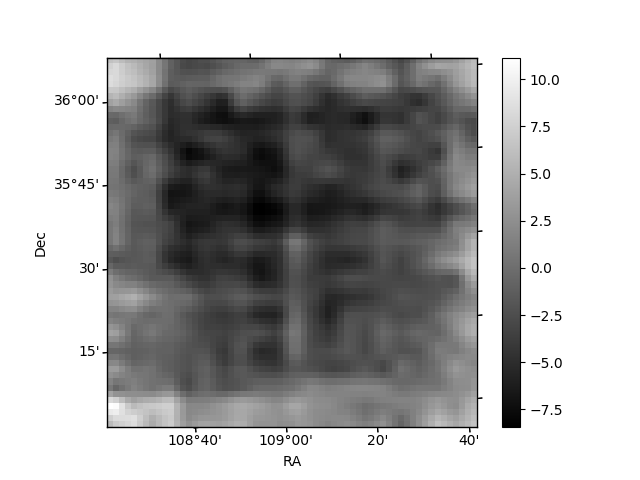
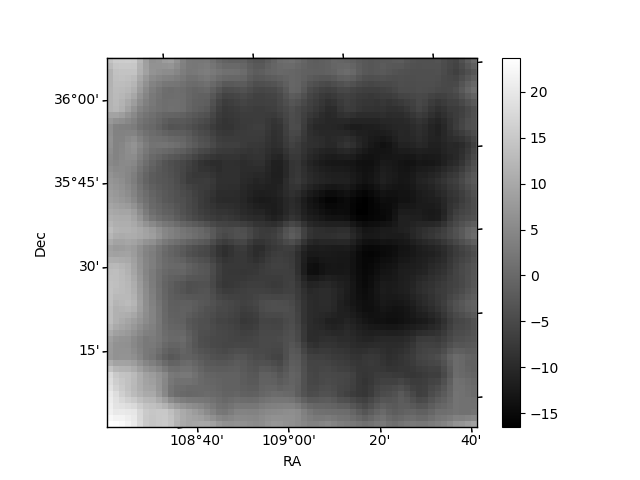
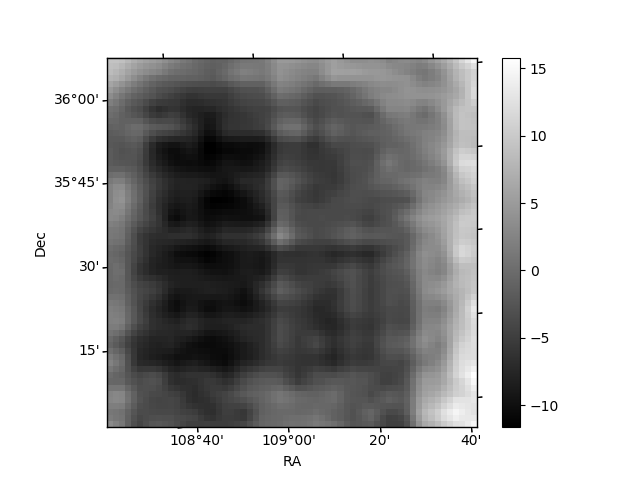
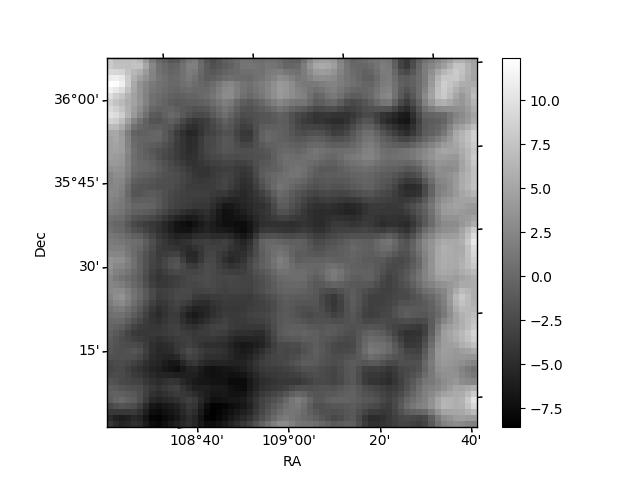
Histogram calculated using DETX and DETY for each event in the final _common_clean file
| Quadrant A | 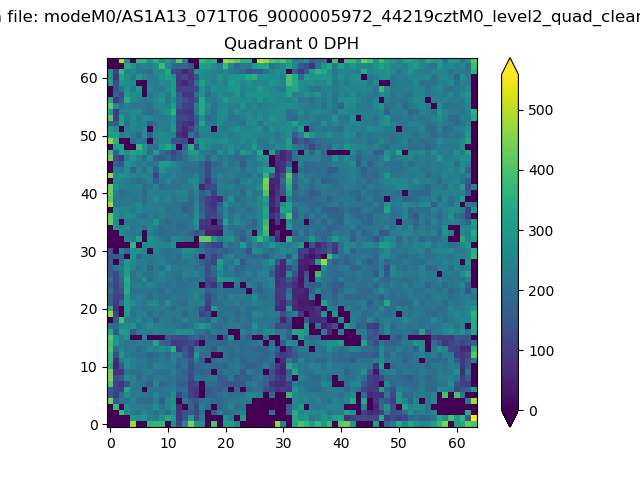 |
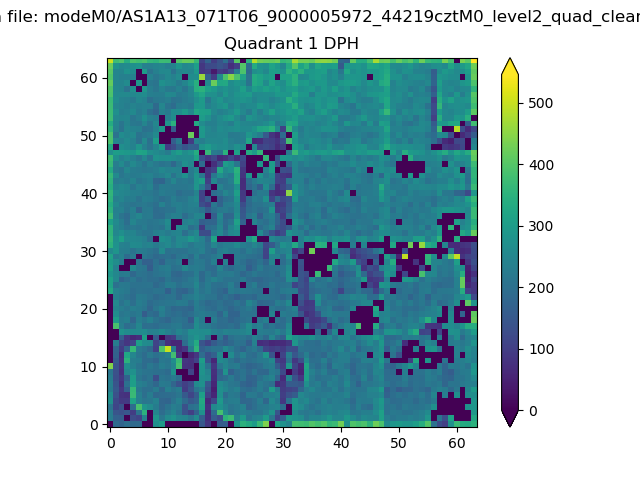 |
Quadrant B |
|---|---|---|---|
| Quadrant D | 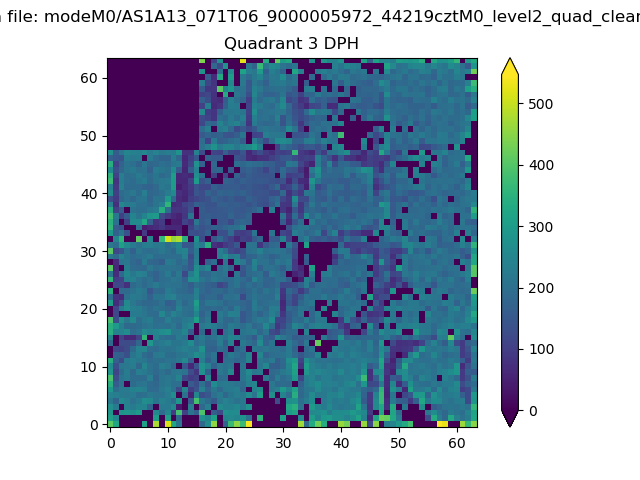 |
 |
Quadrant C |
| Plot type | Count rate plots | Images |
|---|---|---|
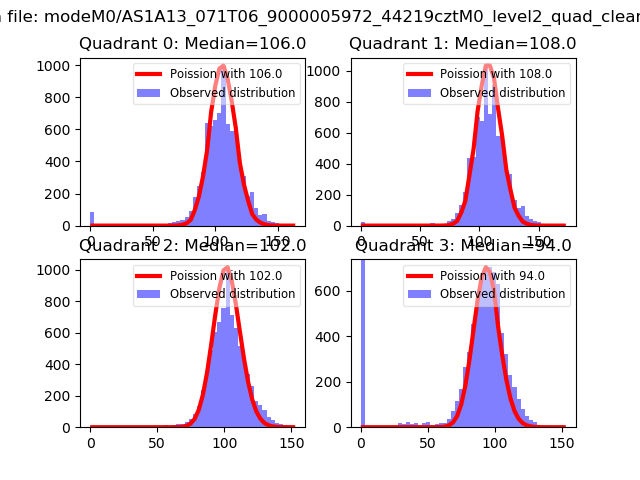
| Comparison with Poisson distribution Blue bars denote a histogram of data divided into 1 sec bins. Red curve is a Poisson curve with rate = median count rate of data. |
 |
 |
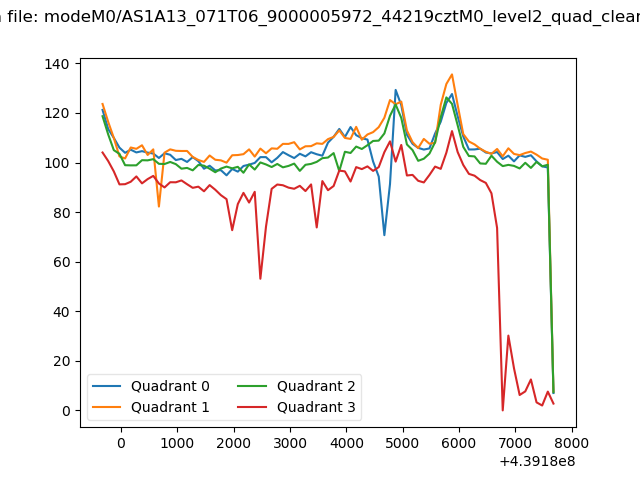
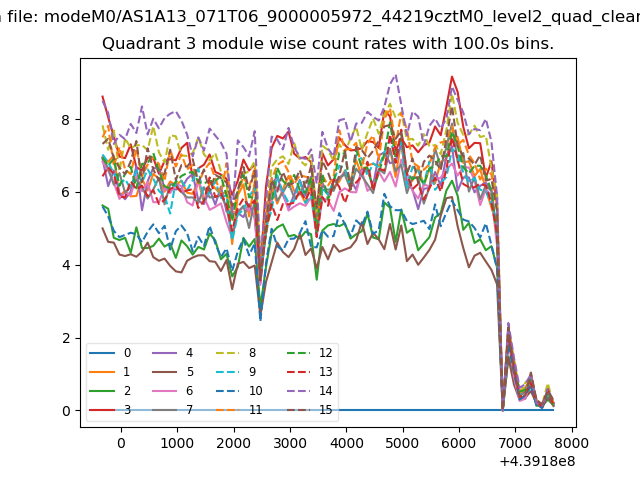
| Quadrant-wise count rates Data is divided into 100 sec bins |
 |
|
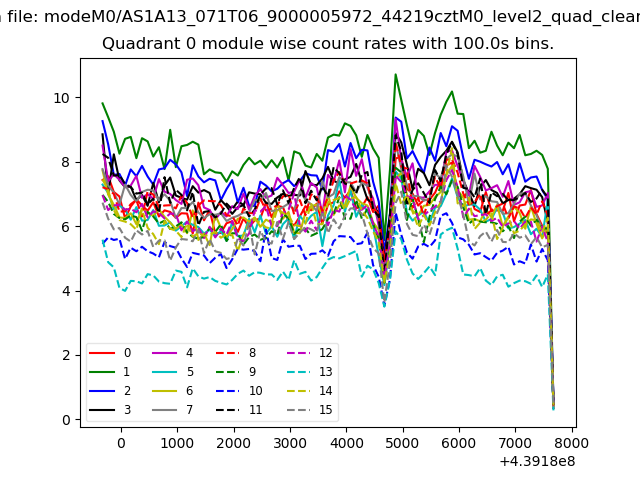
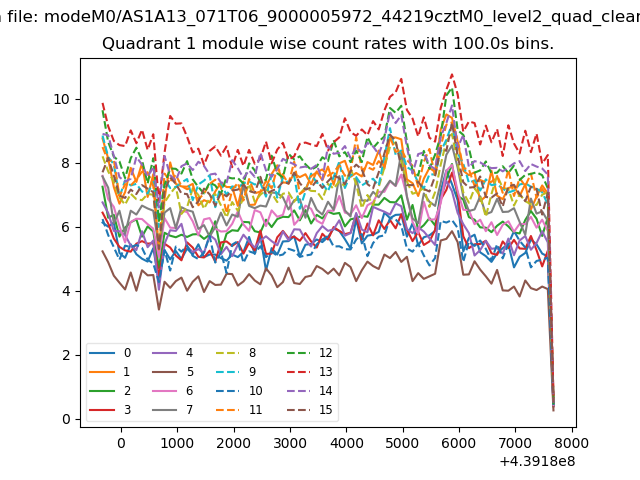
| Module-wise count rates for Quadrant A Data is divided into 100 sec bins |
 |
 |
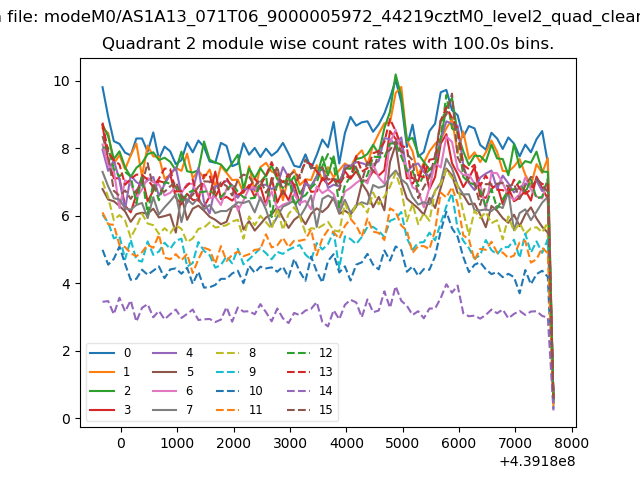
| Module-wise count rates for Quadrant B Data is divided into 100 sec bins |
 |
 |
| Module-wise count rates for Quadrant C Data is divided into 100 sec bins |
 |
 |
| Module-wise count rates for Quadrant D Data is divided into 100 sec bins |
 |
 |
| Parameter | Plot |
|---|---|
| CZT HV Monitor | 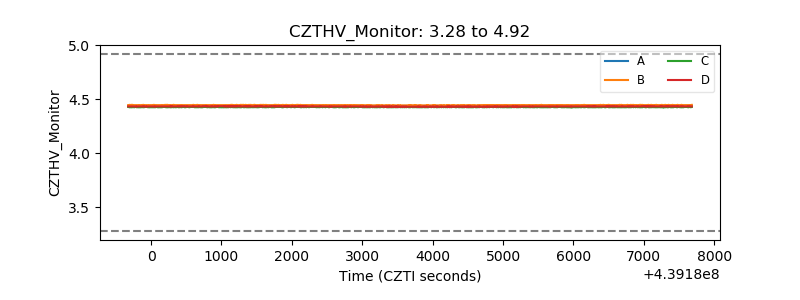 |
| D_VDD | 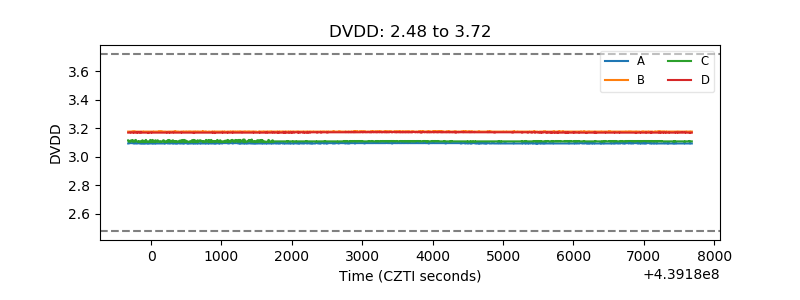 |
| Temperature 1 | 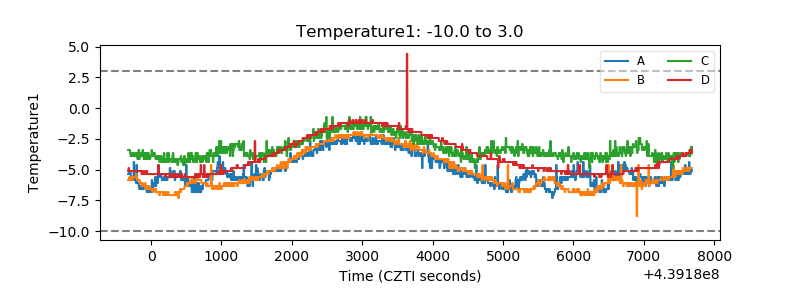 |
| Veto HV Monitor | 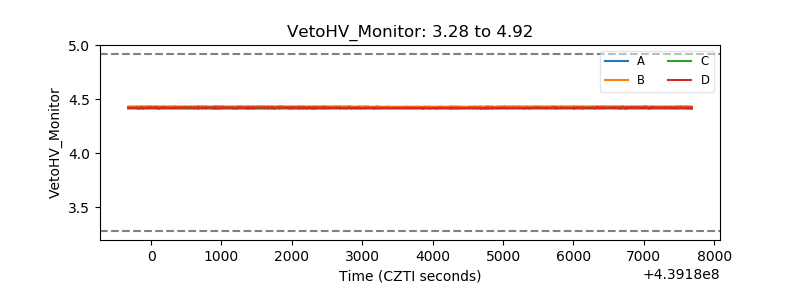 |
| Veto LLD | 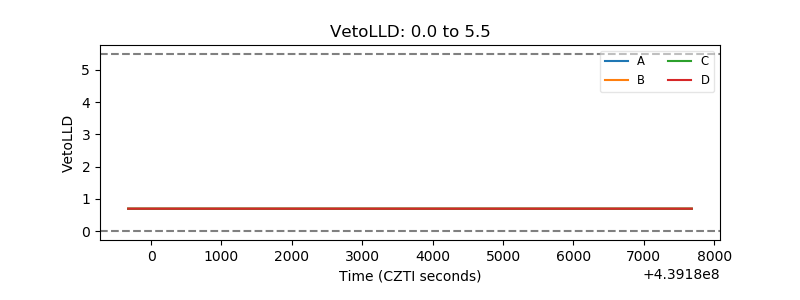 |
| Alpha Counter | 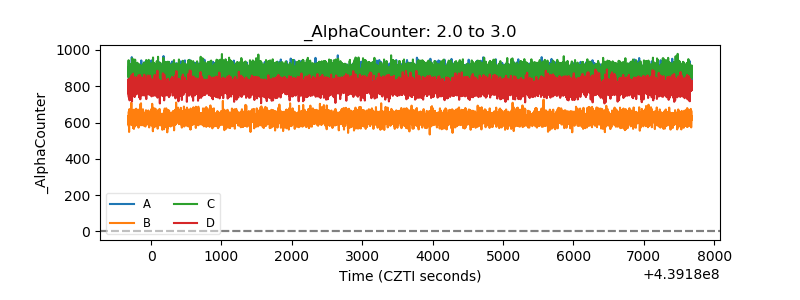 |
| _CPM_Rate | 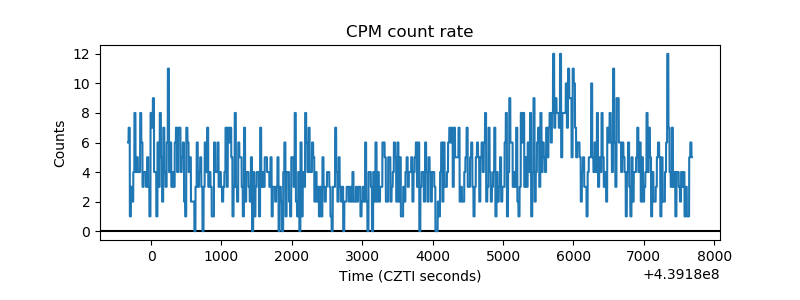 |
| CZT Counter | 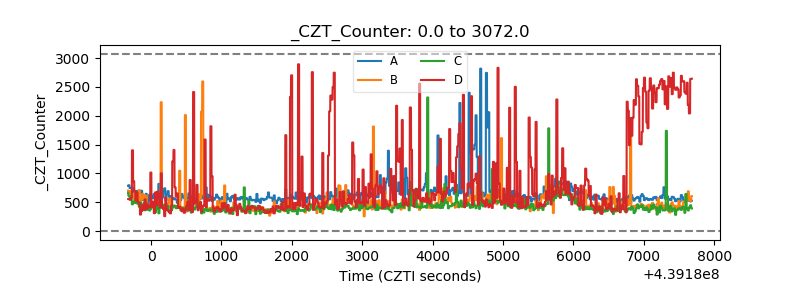 |
| +2.5 Volts monitor |  |
| +5 Volts monitor | 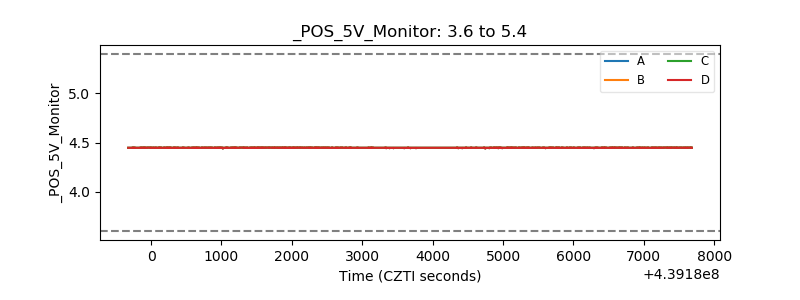 |
| _ROLL_ROT | 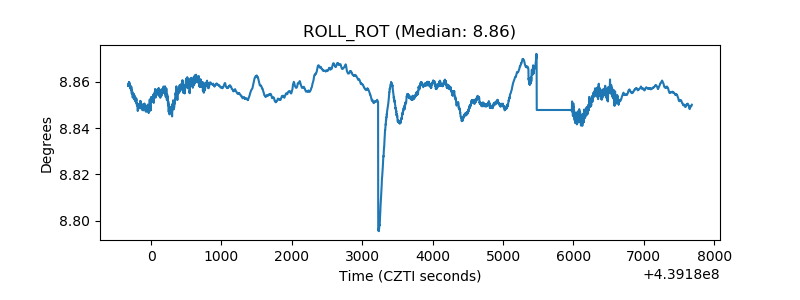 |
| _Roll_DEC | 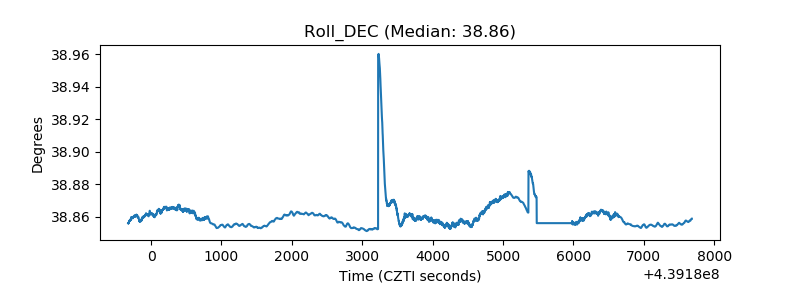 |
| _Roll_RA | 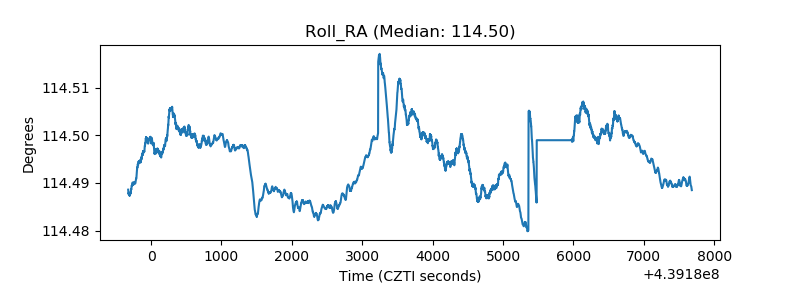 |
| Veto Counter | 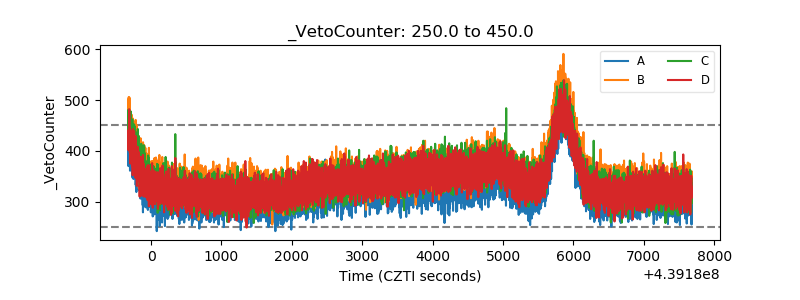 |