| Param | Original file | Final file |
|---|---|---|
| Filename | modeM0/AS1A13_071T06_9000005972_44221cztM0_level2.fits | modeM0/AS1A13_071T06_9000005972_44221cztM0_level2_quad_clean.evt |
| Size (bytes) | 400,697,280 | 59,060,160 |
| Size | 382.1 MB | 56.3 MB |
| Events in quadrant A | 2,689,053 | 448,231 |
| Events in quadrant B | 2,341,131 | 455,705 |
| Events in quadrant C | 1,895,560 | 431,106 |
| Events in quadrant D | 7,568,516 | 148,633 |
| Mode M0 | |||
|---|---|---|---|
| Quadrant | BADHDUFLAG | Total packets | Discarded packets |
| A | 0 | 11060 | 0 |
| B | 0 | 9926 | 1 |
| C | 0 | 9038 | 0 |
| D | 0 | 25486 | 0 |
| Mode SS | |||
|---|---|---|---|
| Quadrant | BADHDUFLAG | Total packets | Discarded packets |
| A | 0 | 86 | 0 |
| B | 0 | 86 | 0 |
| C | 0 | 86 | 0 |
| D | 0 | 86 | 0 |
| Quadrant | Total seconds | Saturated seconds | Saturation percentage |
|---|---|---|---|
| A | 4329 | 11 | 0.254100% |
| B | 4328 | 30 | 0.693161% |
| C | 4329 | 9 | 0.207900% |
| D | 4329 | 2808 | 64.864865% |
Noise dominated data is calculated using 1-second bins in cleaned event files. If a bin has >2000 counts, and if more than 50% of those come from <1% of pixels, then it is considered to be noise-dominated and hence unusable.
| Quadrant | # 1 sec bins | Bins with >0 counts | Bins with >2000 counts | High rate bins dominated by noise | Noise dominated (total time) | Noise dominated (detector-on time) | Marked lightcurve |
|---|---|---|---|---|---|---|---|
| A | 4329 | 4329 | 6 | 6 | 0.14% | 0.14% | 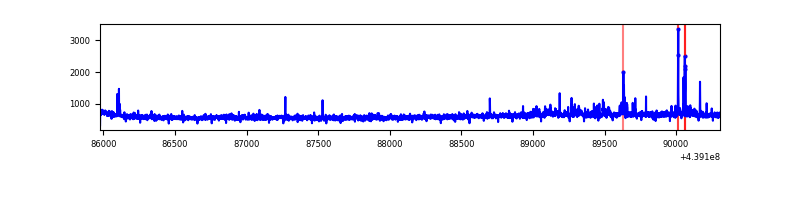 |
| B | 4328 | 4328 | 11 | 11 | 0.25% | 0.25% | 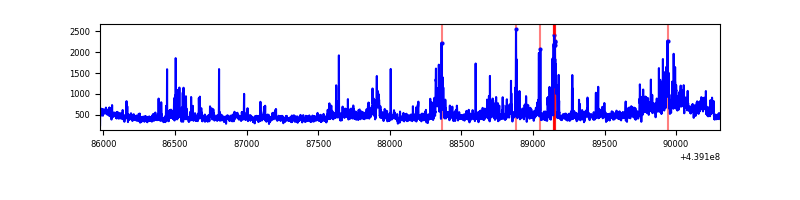 |
| C | 4329 | 4329 | 10 | 10 | 0.23% | 0.23% | 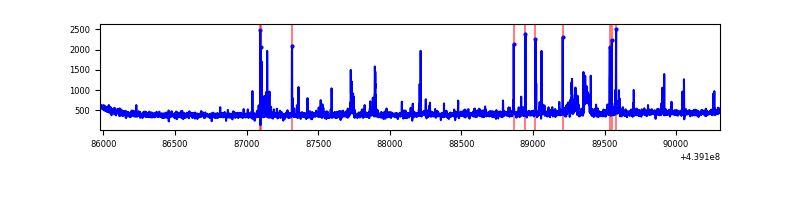 |
| D | 4328 | 4328 | 2154 | 2154 | 49.77% | 49.77% | 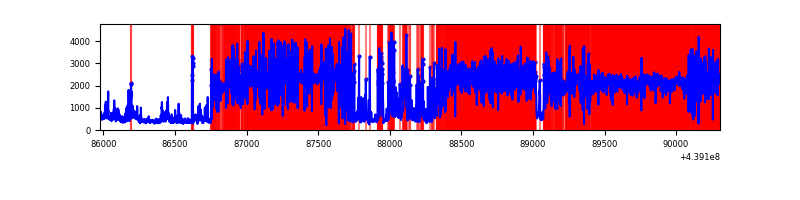 |
Top three noisy pixels from each quadrant. If the there are fewer than three noisy pixels in the level2.evt file, extra rows are filled as -1
| Pixel properties | Quadrant properties | ||||||
|---|---|---|---|---|---|---|---|
| Quadrant | DetID | PixID | Counts | Sigma | Mean | Median | Sigma |
| A | 10 | 83 | 825076 | 8568.39 | 457 | 448 | 96.2 |
| A | 15 | 223 | 84576 | 874.14 | 457 | 448 | 96.2 |
| A | 2 | 79 | 11876 | 118.74 | 457 | 448 | 96.2 |
| B | 0 | 200 | 173660 | 1906.4 | 451 | 437 | 90.9 |
| B | 5 | 235 | 120184 | 1317.87 | 451 | 437 | 90.9 |
| B | 4 | 170 | 80422 | 880.27 | 451 | 437 | 90.9 |
| C | 14 | 254 | 94617 | 897.77 | 440 | 441 | 104.9 |
| C | 1 | 16 | 35022 | 329.66 | 440 | 441 | 104.9 |
| C | 3 | 233 | 19772 | 184.28 | 440 | 441 | 104.9 |
| D | 4 | 221 | 5853962 | 87650.76 | 252 | 243 | 66.8 |
| D | 13 | 249 | 381665 | 5711.23 | 252 | 243 | 66.8 |
| D | 1 | 52 | 199890 | 2989.42 | 252 | 243 | 66.8 |
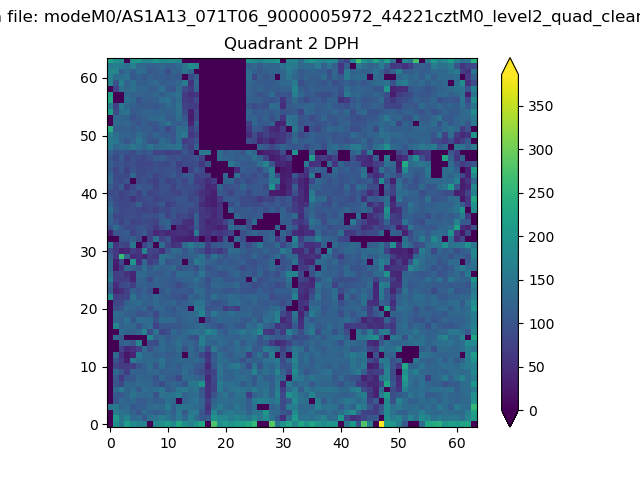
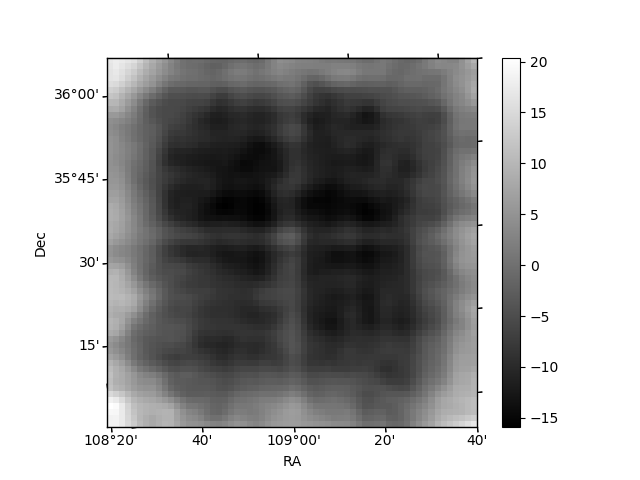
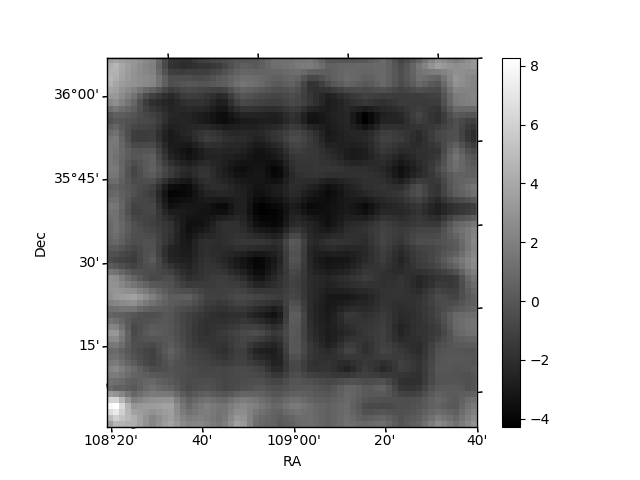
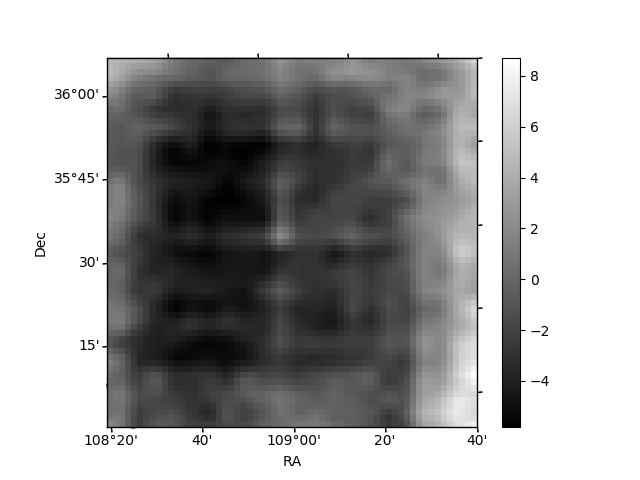
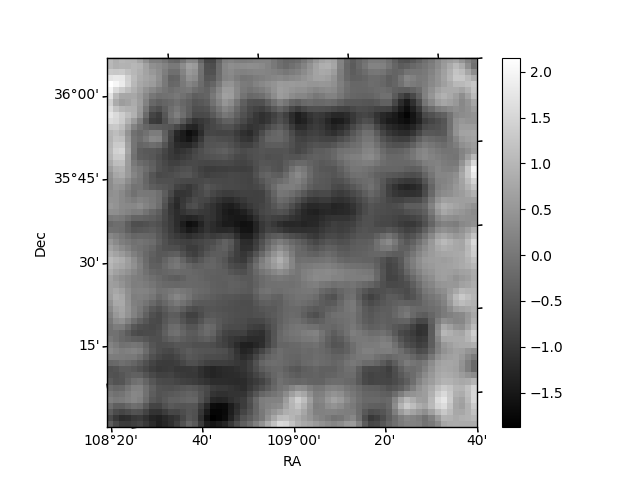
Histogram calculated using DETX and DETY for each event in the final _common_clean file
| Quadrant A | 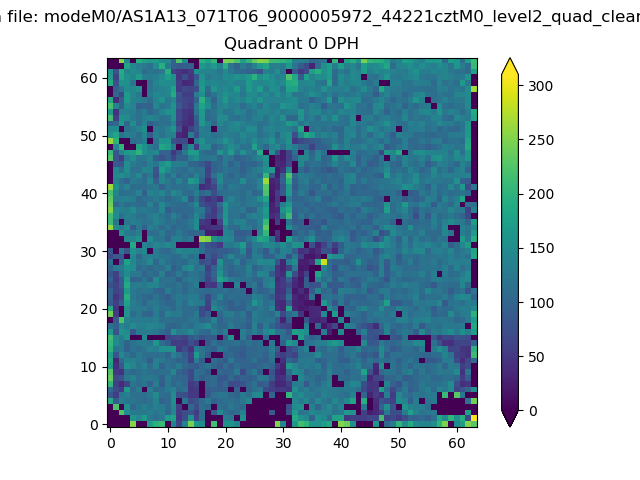 |
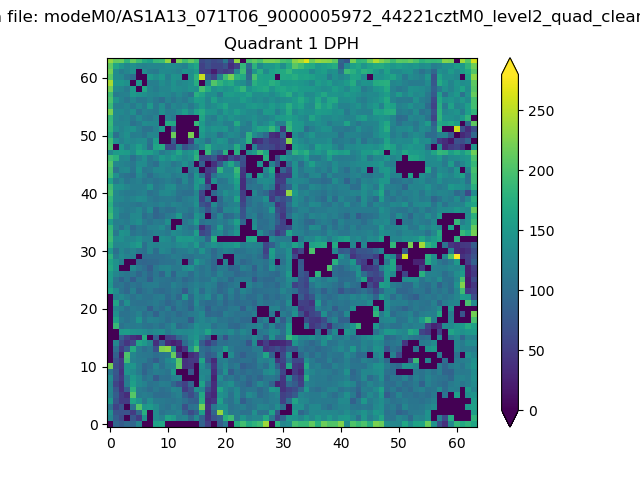 |
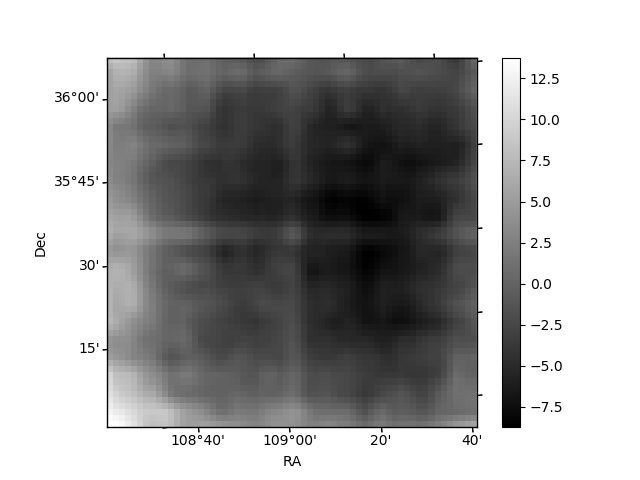
Quadrant B |
|---|---|---|---|
| Quadrant D | 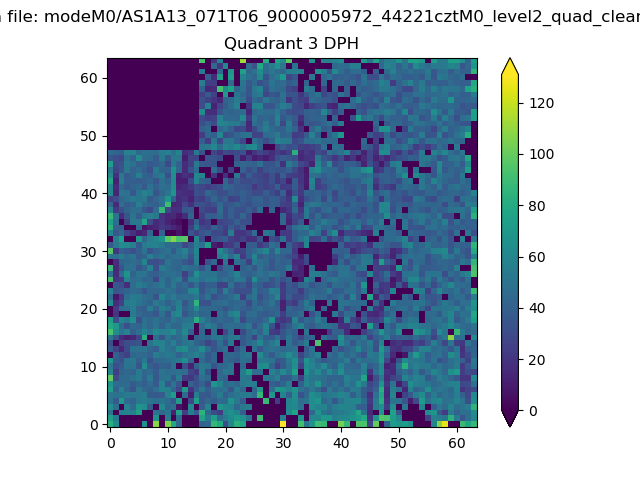 |
 |
Quadrant C |
| Plot type | Count rate plots | Images |
|---|---|---|
| Comparison with Poisson distribution Blue bars denote a histogram of data divided into 1 sec bins. Red curve is a Poisson curve with rate = median count rate of data. |
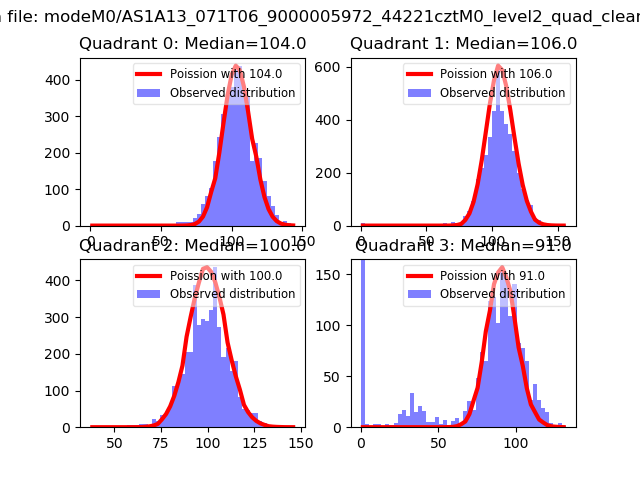 |
 |
| Quadrant-wise count rates Data is divided into 100 sec bins |
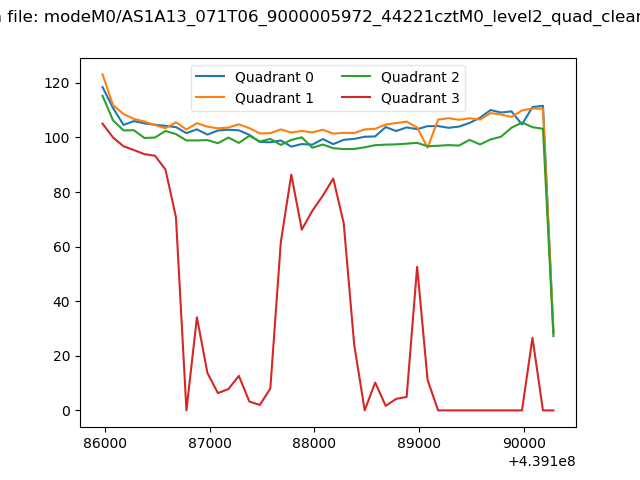 |
|
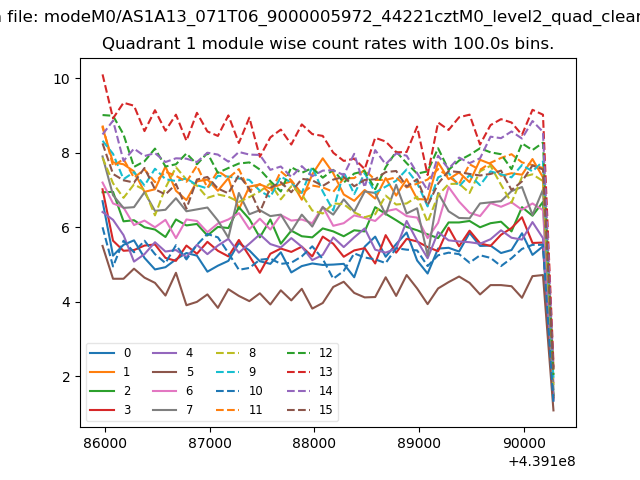
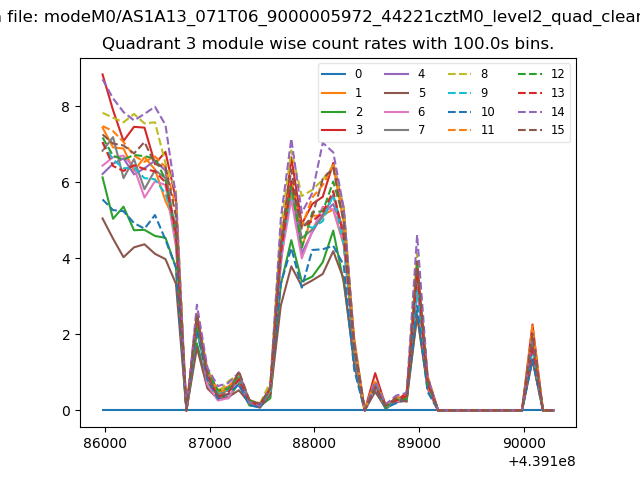
| Module-wise count rates for Quadrant A Data is divided into 100 sec bins |
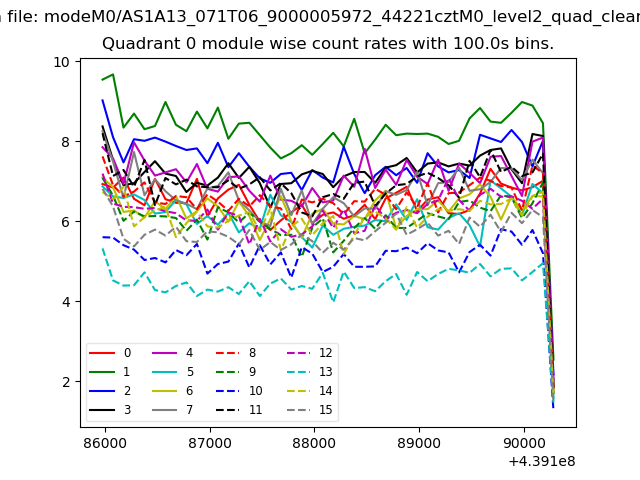 |
 |
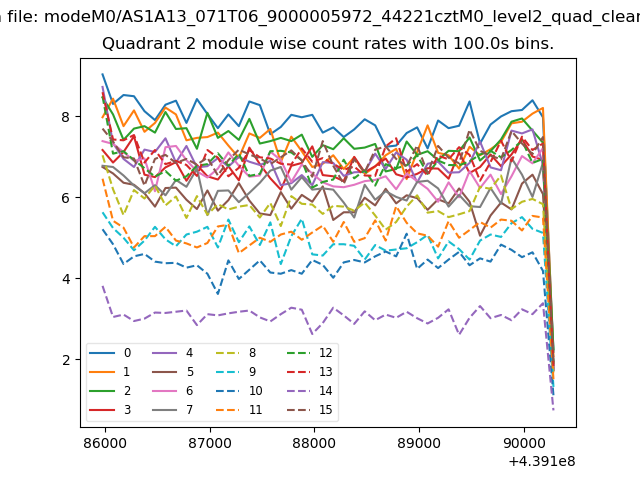
| Module-wise count rates for Quadrant B Data is divided into 100 sec bins |
 |
 |
| Module-wise count rates for Quadrant C Data is divided into 100 sec bins |
 |
 |
| Module-wise count rates for Quadrant D Data is divided into 100 sec bins |
 |
 |
| Parameter | Plot |
|---|---|
| CZT HV Monitor | 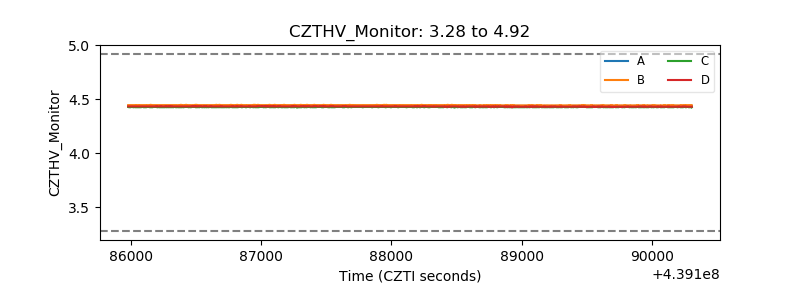 |
| D_VDD | 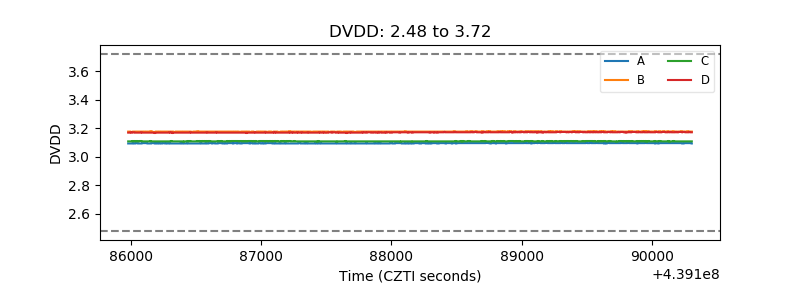 |
| Temperature 1 | 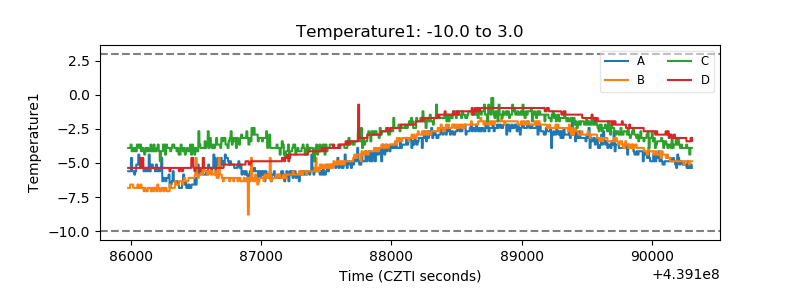 |
| Veto HV Monitor | 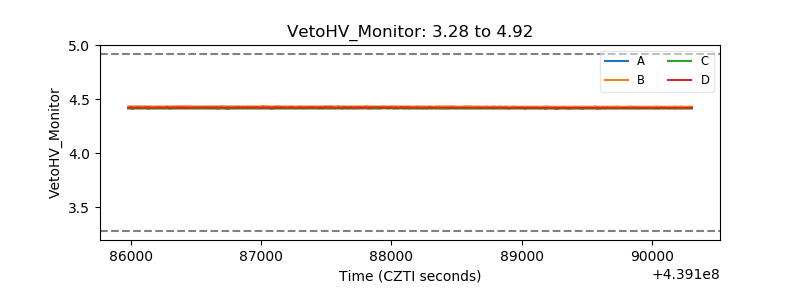 |
| Veto LLD | 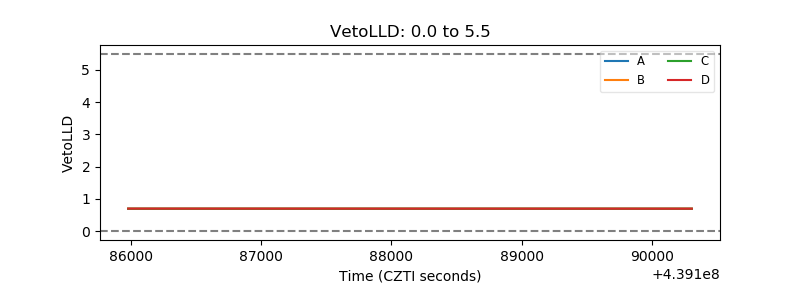 |
| Alpha Counter | 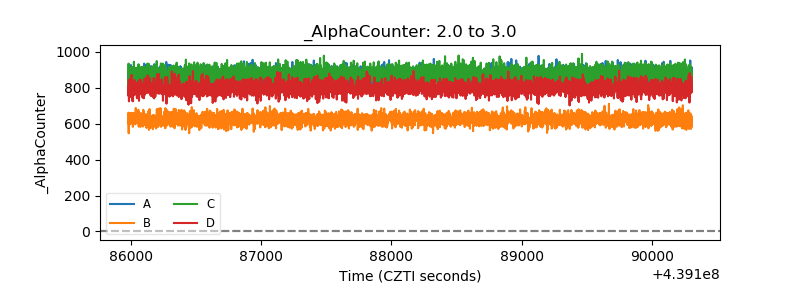 |
| _CPM_Rate |  |
| CZT Counter | 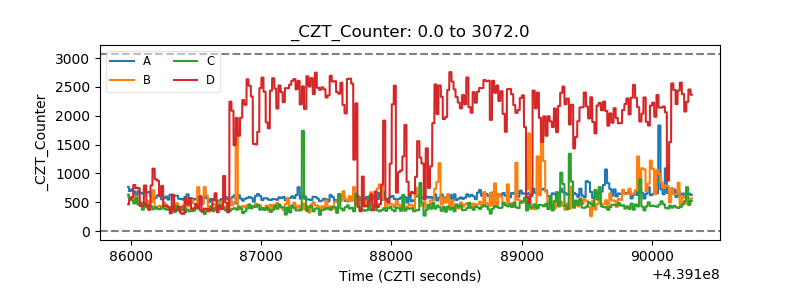 |
| +2.5 Volts monitor | 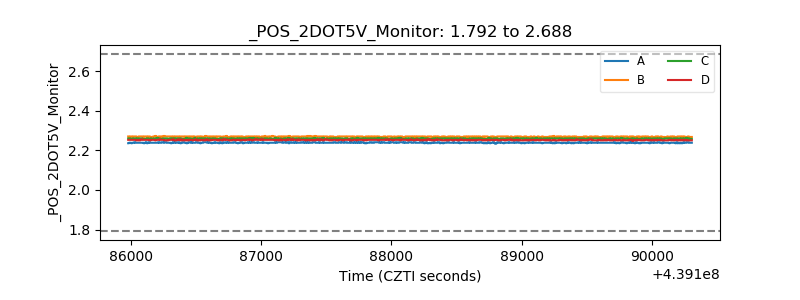 |
| +5 Volts monitor |  |
| _ROLL_ROT | 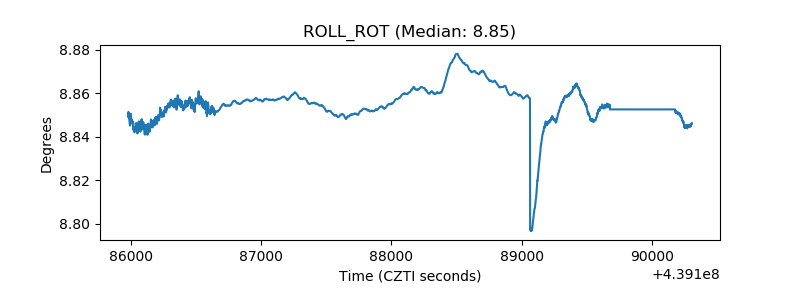 |
| _Roll_DEC | 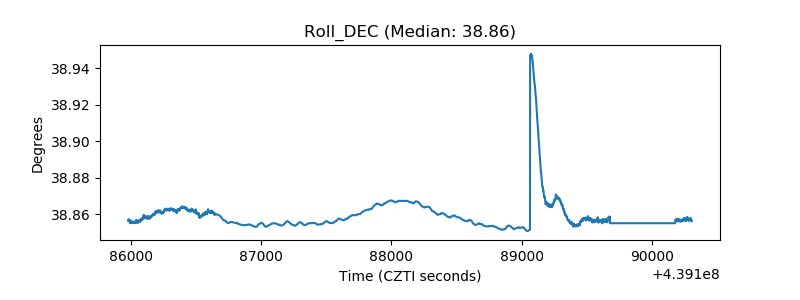 |
| _Roll_RA | 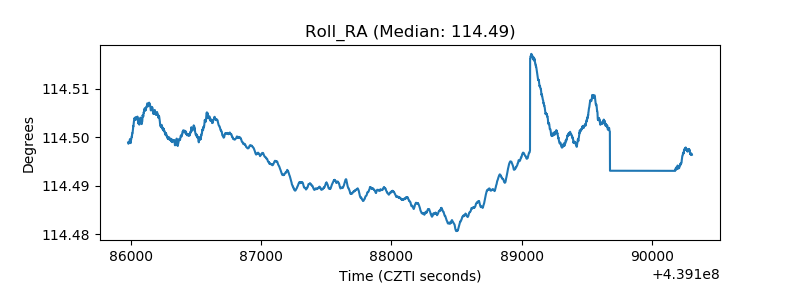 |
| Veto Counter | 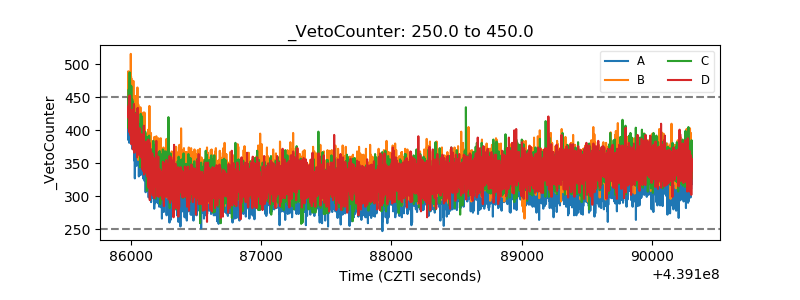 |