| Param | Original file | Final file |
|---|---|---|
| Filename | modeM0/AS1A13_071T06_9000005972_44222cztM0_level2.fits | modeM0/AS1A13_071T06_9000005972_44222cztM0_level2_quad_clean.evt |
| Size (bytes) | 1,477,013,760 | 204,307,200 |
| Size | 1.4 GB | 194.8 MB |
| Events in quadrant A | 12,405,314 | 1,465,713 |
| Events in quadrant B | 8,753,680 | 1,534,179 |
| Events in quadrant C | 7,047,952 | 1,507,535 |
| Events in quadrant D | 25,308,039 | 644,379 |
| Mode M0 | |||
|---|---|---|---|
| Quadrant | BADHDUFLAG | Total packets | Discarded packets |
| A | 0 | 48935 | 4 |
| B | 0 | 35975 | 4 |
| C | 0 | 31933 | 4 |
| D | 0 | 85345 | 4 |
| Mode SS | |||
|---|---|---|---|
| Quadrant | BADHDUFLAG | Total packets | Discarded packets |
| A | 0 | 306 | 0 |
| B | 0 | 306 | 0 |
| C | 0 | 306 | 0 |
| D | 0 | 306 | 0 |
| Mode M9 | |||
|---|---|---|---|
| Quadrant | BADHDUFLAG | Total packets | Discarded packets |
| A | 0 | 14 | 0 |
| B | 0 | 14 | 0 |
| C | 0 | 14 | 0 |
| D | 0 | 14 | 0 |
| Quadrant | Total seconds | Saturated seconds | Saturation percentage |
|---|---|---|---|
| A | 14969 | 1348 | 9.005278% |
| B | 14970 | 741 | 4.949900% |
| C | 14970 | 295 | 1.970608% |
| D | 14970 | 8660 | 57.849031% |
Noise dominated data is calculated using 1-second bins in cleaned event files. If a bin has >2000 counts, and if more than 50% of those come from <1% of pixels, then it is considered to be noise-dominated and hence unusable.
| Quadrant | # 1 sec bins | Bins with >0 counts | Bins with >2000 counts | High rate bins dominated by noise | Noise dominated (total time) | Noise dominated (detector-on time) | Marked lightcurve |
|---|---|---|---|---|---|---|---|
| A | 16389 | 14973 | 725 | 725 | 4.42% | 4.84% | 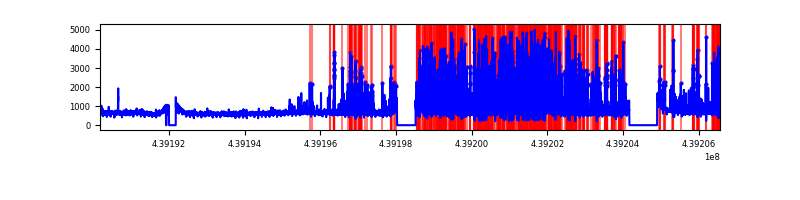 |
| B | 16390 | 14974 | 226 | 226 | 1.38% | 1.51% | 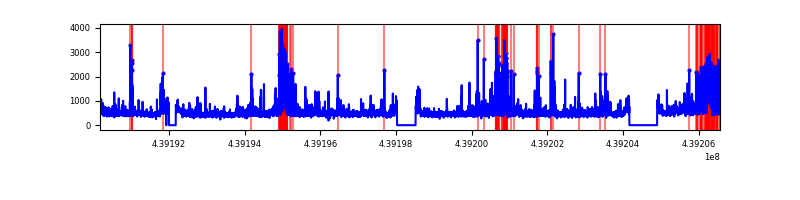 |
| C | 16390 | 14974 | 52 | 52 | 0.32% | 0.35% | 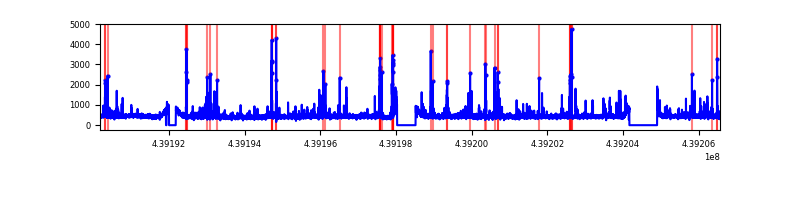 |
| D | 16390 | 14974 | 6448 | 6448 | 39.34% | 43.06% | 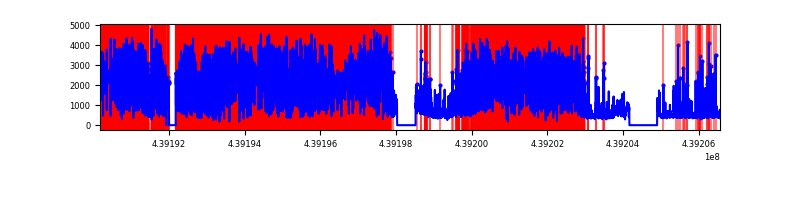 |
Top three noisy pixels from each quadrant. If the there are fewer than three noisy pixels in the level2.evt file, extra rows are filled as -1
| Pixel properties | Quadrant properties | ||||||
|---|---|---|---|---|---|---|---|
| Quadrant | DetID | PixID | Counts | Sigma | Mean | Median | Sigma |
| A | 10 | 83 | 2989247 | 8868.58 | 1626 | 1592 | 336.9 |
| A | 15 | 223 | 2873435 | 8524.8 | 1626 | 1592 | 336.9 |
| A | 2 | 79 | 127156 | 372.73 | 1626 | 1592 | 336.9 |
| B | 0 | 219 | 802802 | 2473.05 | 1646 | 1594 | 324.0 |
| B | 0 | 200 | 467499 | 1438.09 | 1646 | 1594 | 324.0 |
| B | 4 | 170 | 203260 | 622.47 | 1646 | 1594 | 324.0 |
| C | 14 | 254 | 333028 | 865.5 | 1629 | 1634 | 382.9 |
| C | 4 | 254 | 244648 | 634.68 | 1629 | 1634 | 382.9 |
| C | 3 | 233 | 64718 | 164.75 | 1629 | 1634 | 382.9 |
| D | 4 | 221 | 12595009 | 43815.27 | 1121 | 1083 | 287.4 |
| D | 12 | 2 | 5385803 | 18733.87 | 1121 | 1083 | 287.4 |
| D | 13 | 249 | 1411491 | 4906.92 | 1121 | 1083 | 287.4 |
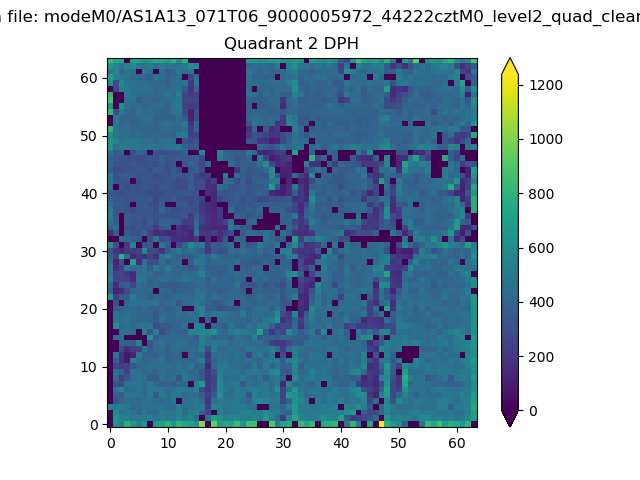
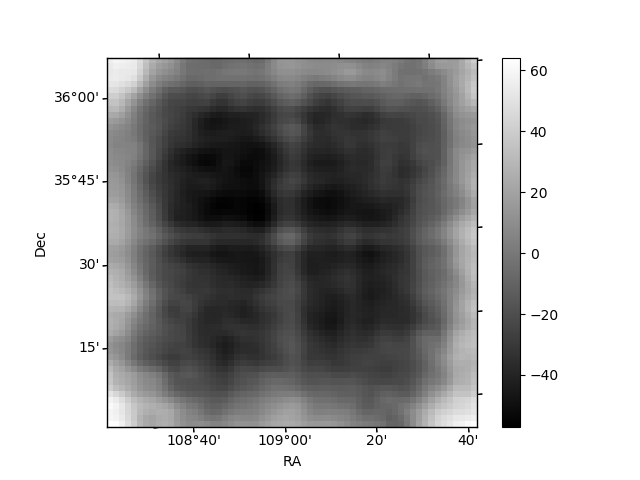
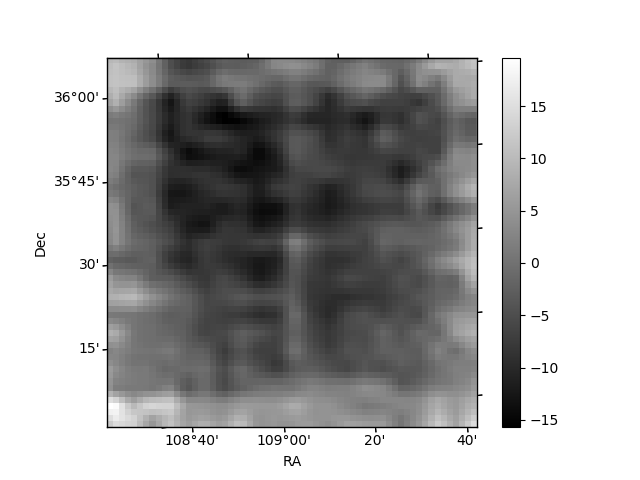
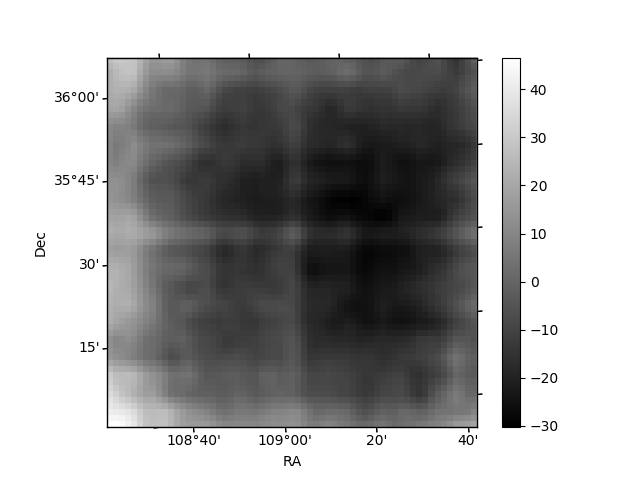
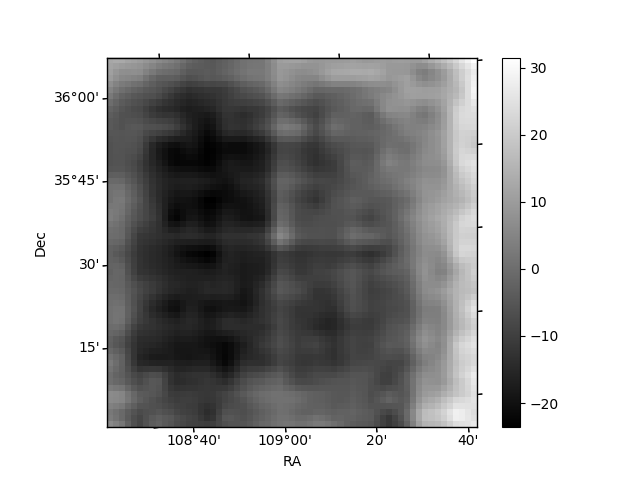
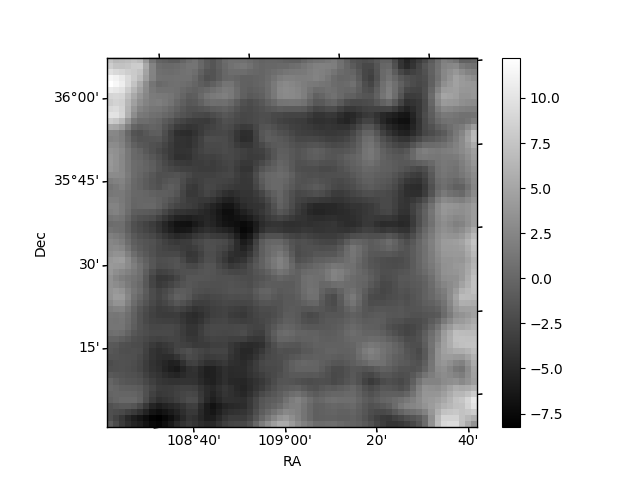
Histogram calculated using DETX and DETY for each event in the final _common_clean file
| Quadrant A | 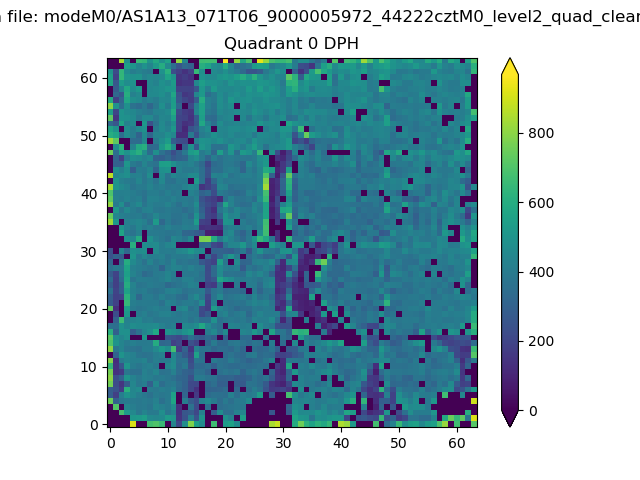 |
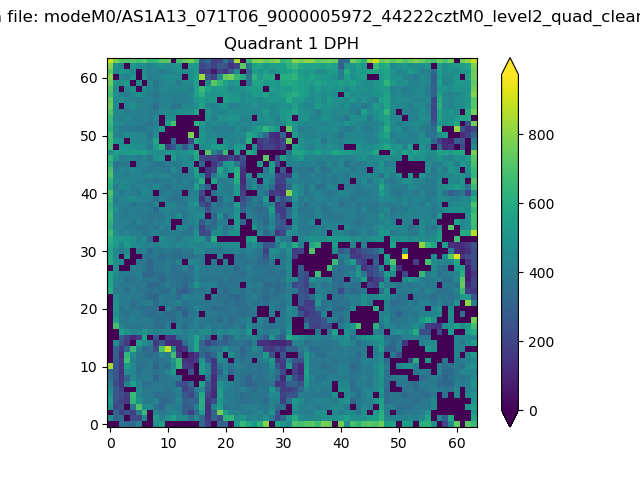 |
Quadrant B |
|---|---|---|---|
| Quadrant D | 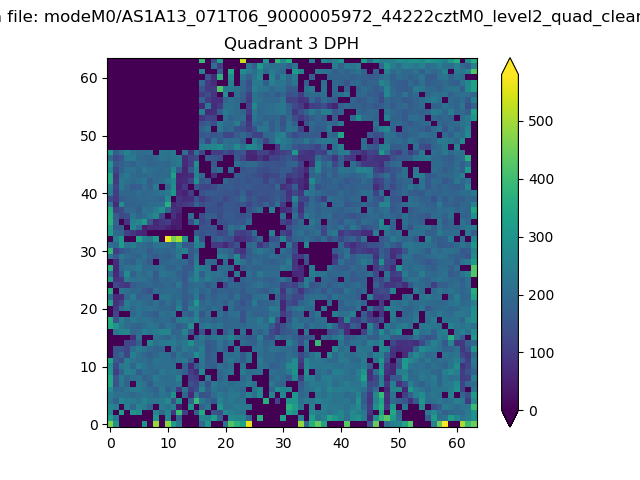 |
 |
Quadrant C |
| Plot type | Count rate plots | Images |
|---|---|---|
| Comparison with Poisson distribution Blue bars denote a histogram of data divided into 1 sec bins. Red curve is a Poisson curve with rate = median count rate of data. |
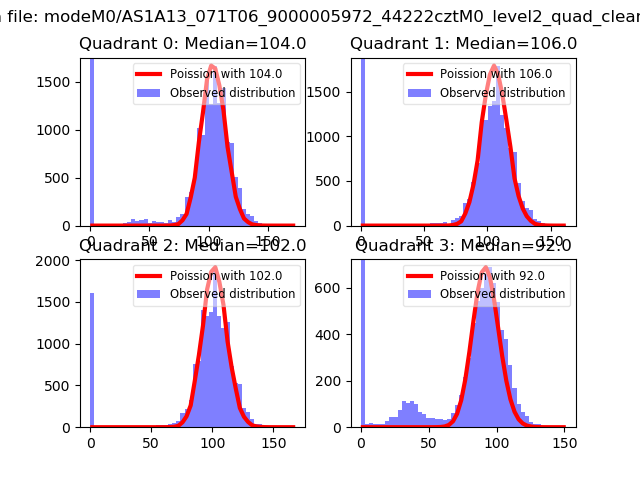 |
 |
| Quadrant-wise count rates Data is divided into 100 sec bins |
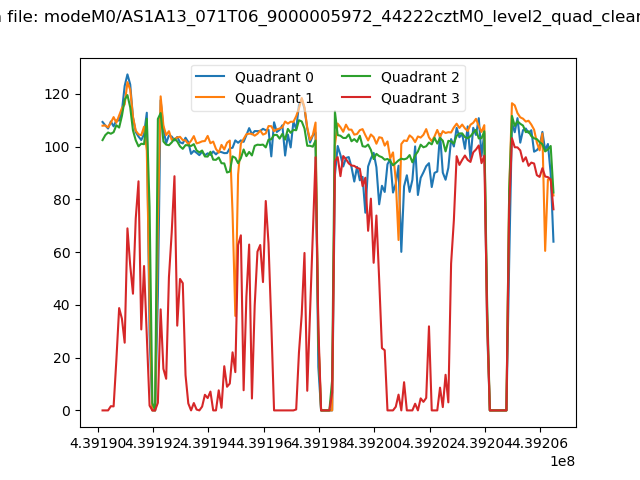 |
|
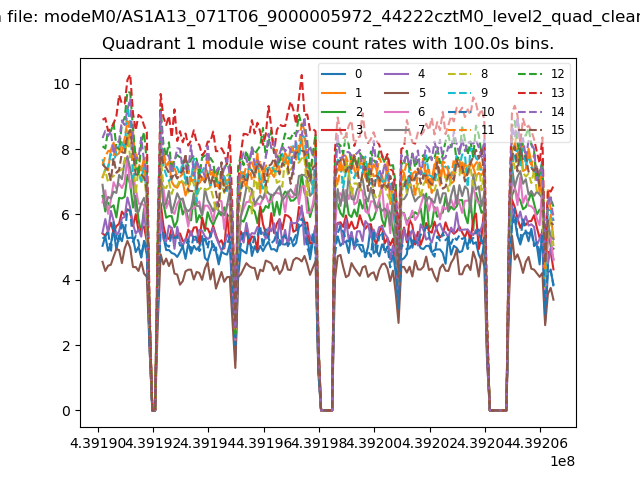
| Module-wise count rates for Quadrant A Data is divided into 100 sec bins |
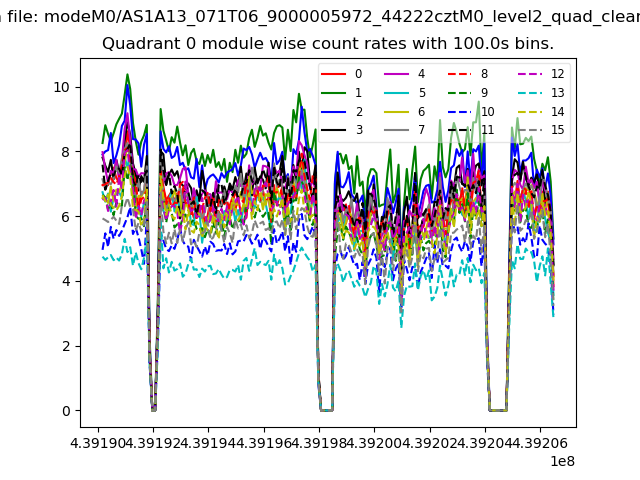 |
 |
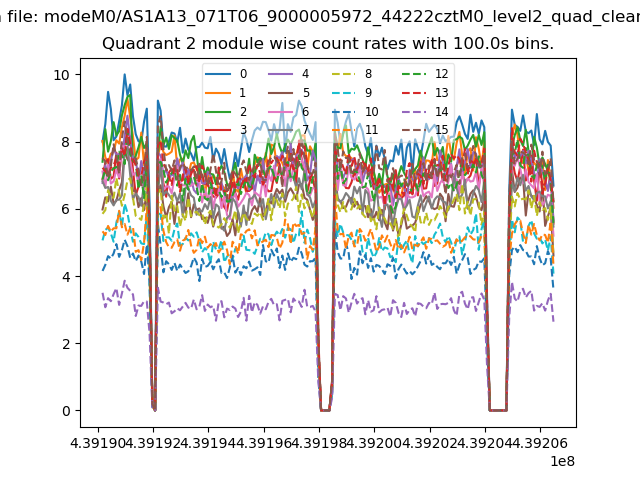
| Module-wise count rates for Quadrant B Data is divided into 100 sec bins |
 |
 |
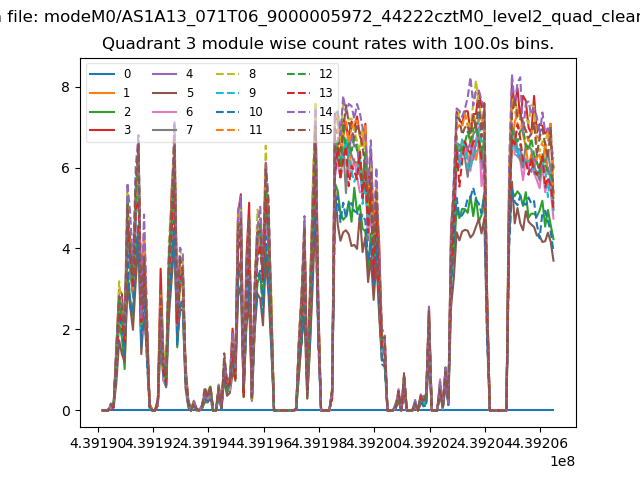
| Module-wise count rates for Quadrant C Data is divided into 100 sec bins |
 |
 |
| Module-wise count rates for Quadrant D Data is divided into 100 sec bins |
 |
 |
| Parameter | Plot |
|---|---|
| CZT HV Monitor | 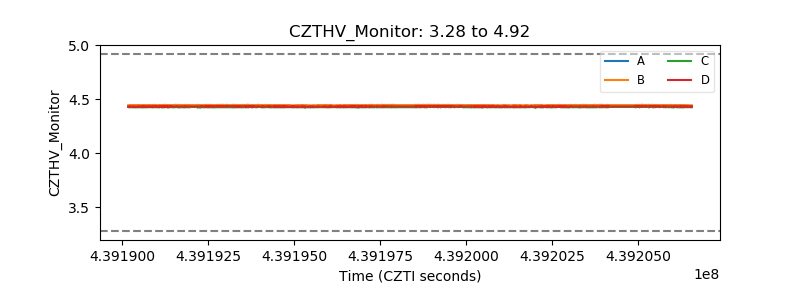 |
| D_VDD | 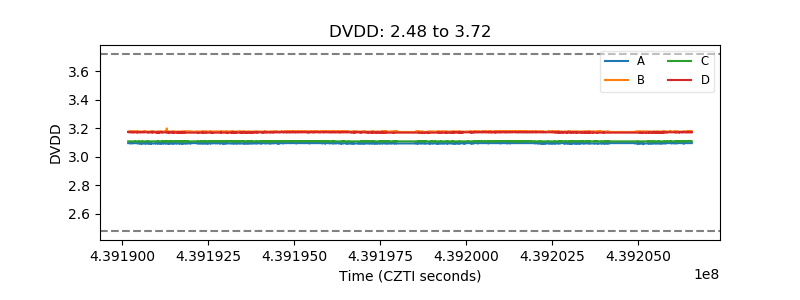 |
| Temperature 1 | 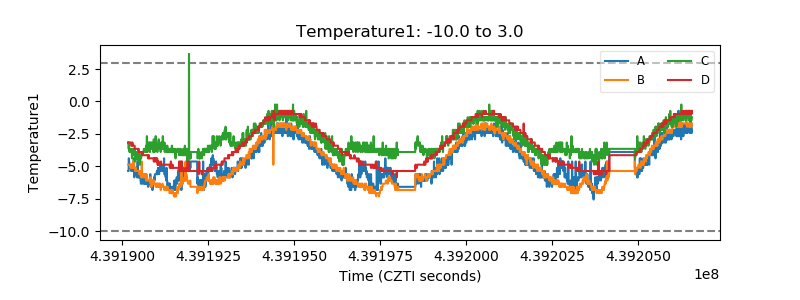 |
| Veto HV Monitor | 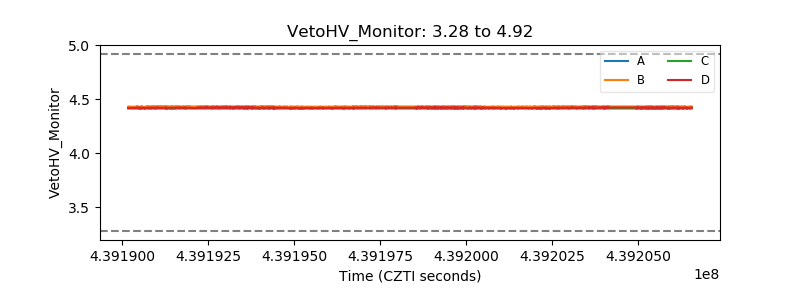 |
| Veto LLD | 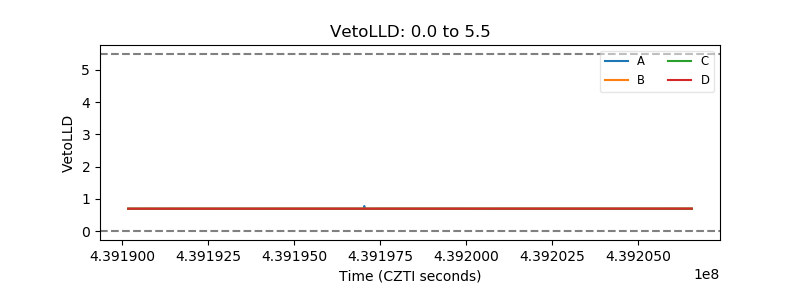 |
| Alpha Counter | 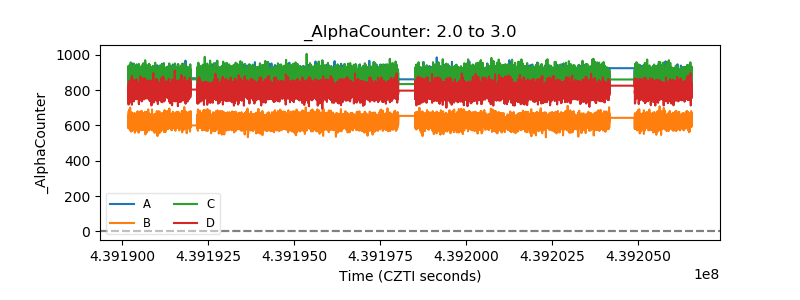 |
| _CPM_Rate | 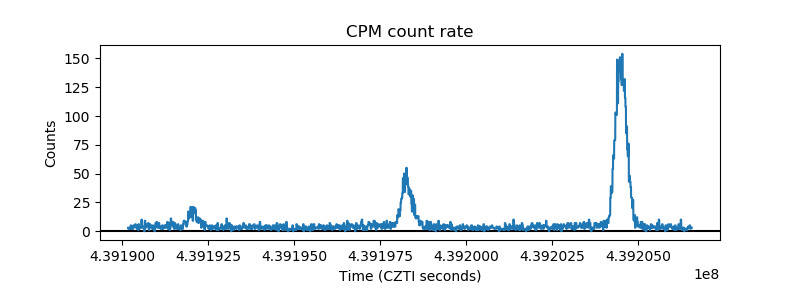 |
| CZT Counter | 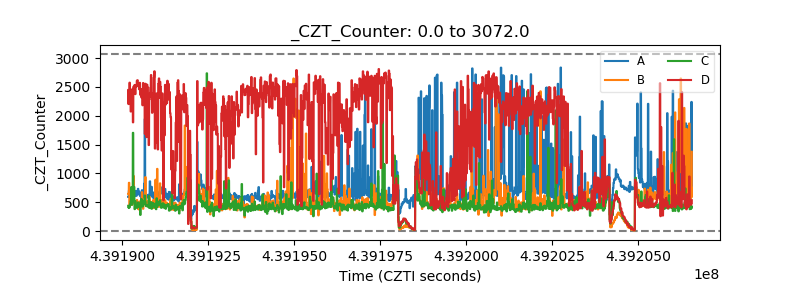 |
| +2.5 Volts monitor | 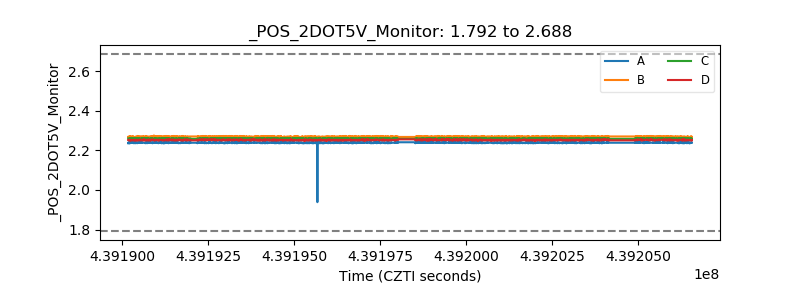 |
| +5 Volts monitor | 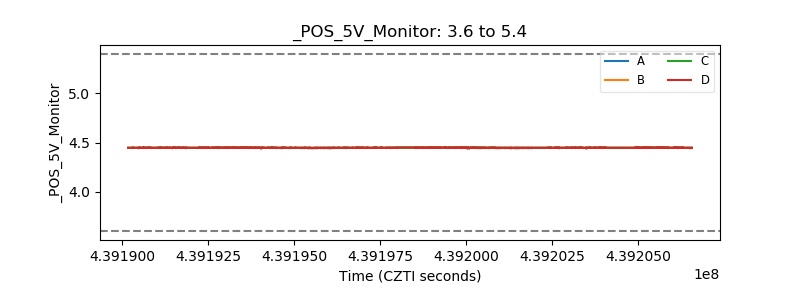 |
| _ROLL_ROT | 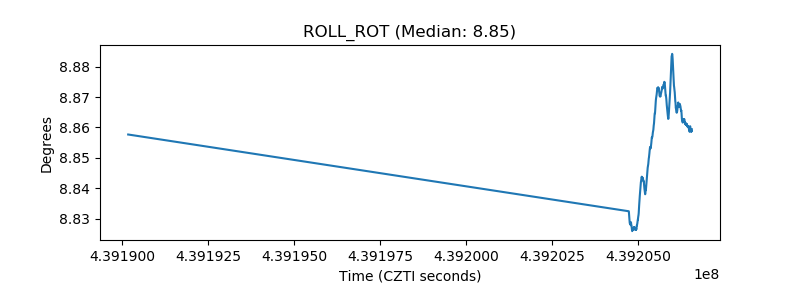 |
| _Roll_DEC | 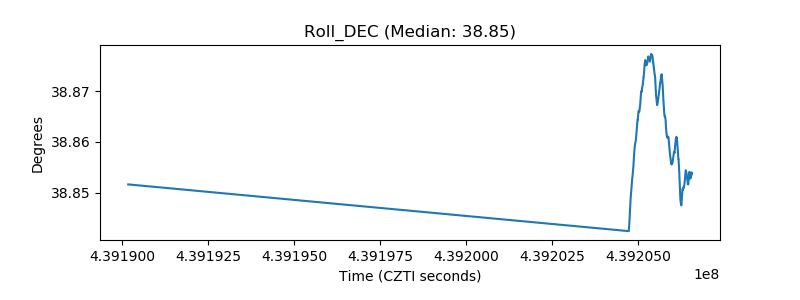 |
| _Roll_RA | 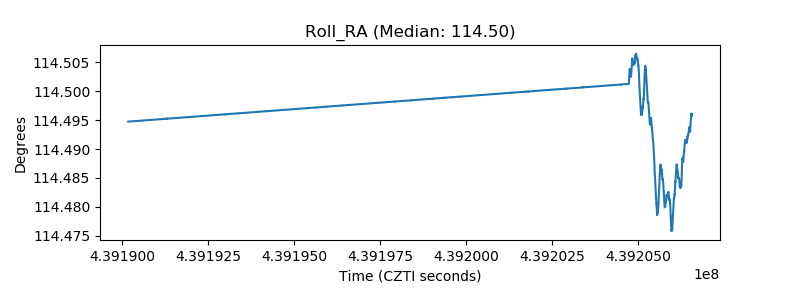 |
| Veto Counter | 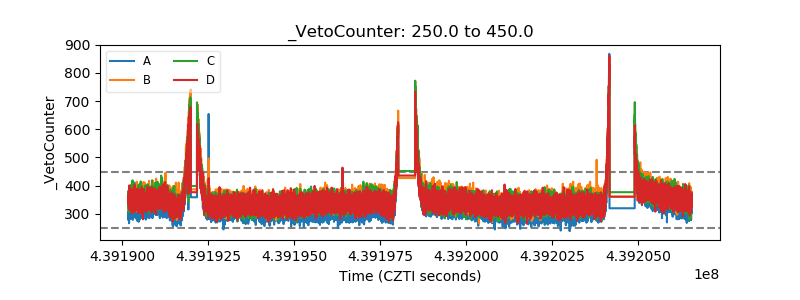 |