| Param | Original file | Final file |
|---|---|---|
| Filename | modeM0/AS1A13_071T06_9000005972_44225cztM0_level2.fits | modeM0/AS1A13_071T06_9000005972_44225cztM0_level2_quad_clean.evt |
| Size (bytes) | 596,643,840 | 104,875,200 |
| Size | 569.0 MB | 100.0 MB |
| Events in quadrant A | 6,167,182 | 727,297 |
| Events in quadrant B | 5,562,293 | 666,859 |
| Events in quadrant C | 3,183,681 | 725,812 |
| Events in quadrant D | 6,659,110 | 593,564 |
| Mode M0 | |||
|---|---|---|---|
| Quadrant | BADHDUFLAG | Total packets | Discarded packets |
| A | 0 | 23347 | 2 |
| B | 0 | 20958 | 2 |
| C | 0 | 14081 | 2 |
| D | 0 | 24341 | 3 |
| Mode SS | |||
|---|---|---|---|
| Quadrant | BADHDUFLAG | Total packets | Discarded packets |
| A | 0 | 134 | 0 |
| B | 0 | 134 | 0 |
| C | 0 | 134 | 0 |
| D | 0 | 134 | 0 |
| Mode M9 | |||
|---|---|---|---|
| Quadrant | BADHDUFLAG | Total packets | Discarded packets |
| A | 0 | 13 | 0 |
| B | 0 | 14 | 0 |
| C | 0 | 14 | 0 |
| D | 0 | 14 | 0 |
| Quadrant | Total seconds | Saturated seconds | Saturation percentage |
|---|---|---|---|
| A | 6624 | 372 | 5.615942% |
| B | 6624 | 956 | 14.432367% |
| C | 6624 | 61 | 0.920894% |
| D | 6623 | 991 | 14.963008% |
Noise dominated data is calculated using 1-second bins in cleaned event files. If a bin has >2000 counts, and if more than 50% of those come from <1% of pixels, then it is considered to be noise-dominated and hence unusable.
| Quadrant | # 1 sec bins | Bins with >0 counts | Bins with >2000 counts | High rate bins dominated by noise | Noise dominated (total time) | Noise dominated (detector-on time) | Marked lightcurve |
|---|---|---|---|---|---|---|---|
| A | 7719 | 6625 | 166 | 166 | 2.15% | 2.51% | 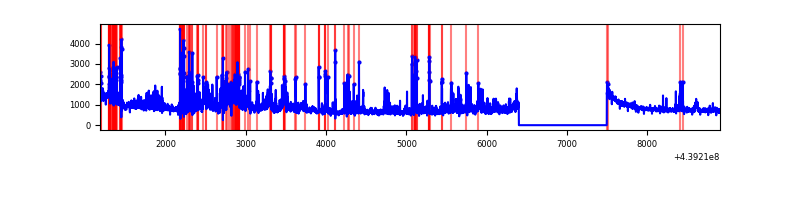 |
| B | 7719 | 6624 | 614 | 614 | 7.95% | 9.27% | 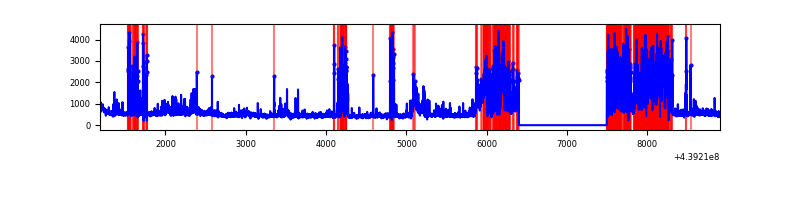 |
| C | 7719 | 6625 | 12 | 12 | 0.16% | 0.18% | 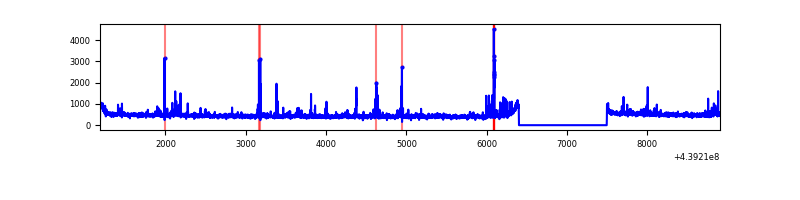 |
| D | 7718 | 6624 | 817 | 817 | 10.59% | 12.33% | 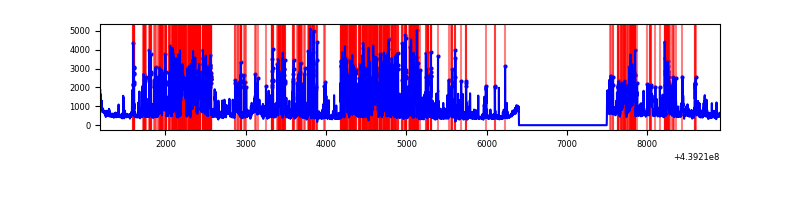 |
Top three noisy pixels from each quadrant. If the there are fewer than three noisy pixels in the level2.evt file, extra rows are filled as -1
| Pixel properties | Quadrant properties | ||||||
|---|---|---|---|---|---|---|---|
| Quadrant | DetID | PixID | Counts | Sigma | Mean | Median | Sigma |
| A | 10 | 83 | 1601062 | 10130.97 | 760 | 743 | 158.0 |
| A | 15 | 223 | 1490122 | 9428.65 | 760 | 743 | 158.0 |
| A | 2 | 79 | 106522 | 669.64 | 760 | 743 | 158.0 |
| B | 0 | 200 | 2119655 | 15125.75 | 716 | 694 | 140.1 |
| B | 0 | 219 | 162586 | 1155.63 | 716 | 694 | 140.1 |
| B | 5 | 172 | 151735 | 1078.17 | 716 | 694 | 140.1 |
| C | 14 | 254 | 102589 | 574.79 | 752 | 755 | 177.2 |
| C | 4 | 254 | 100055 | 560.49 | 752 | 755 | 177.2 |
| C | 3 | 233 | 40926 | 226.74 | 752 | 755 | 177.2 |
| D | 13 | 249 | 1906888 | 10609.14 | 714 | 690 | 179.7 |
| D | 1 | 52 | 767339 | 4266.87 | 714 | 690 | 179.7 |
| D | 2 | 249 | 346494 | 1924.61 | 714 | 690 | 179.7 |
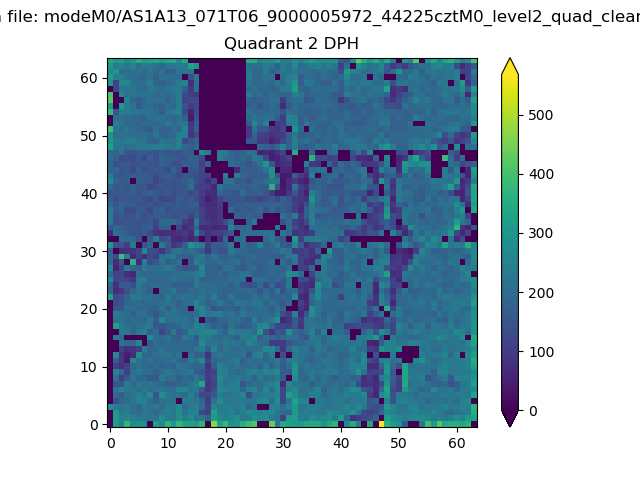
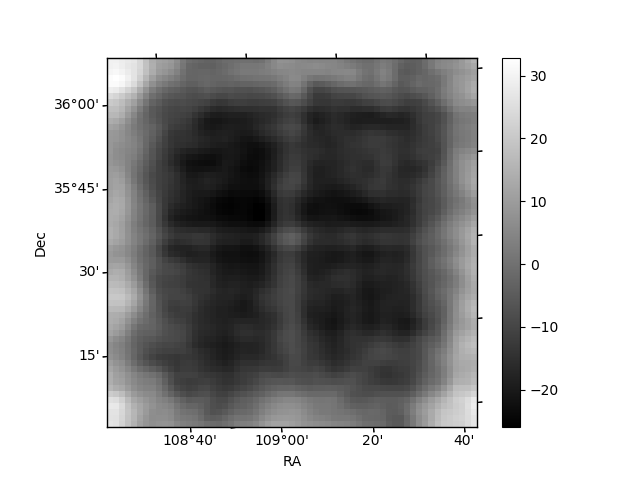
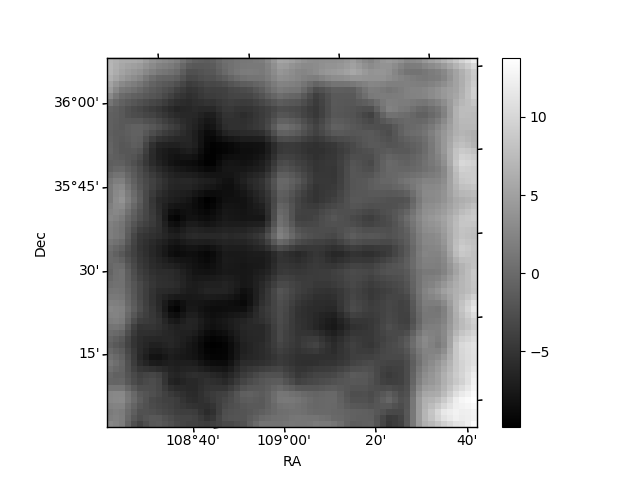
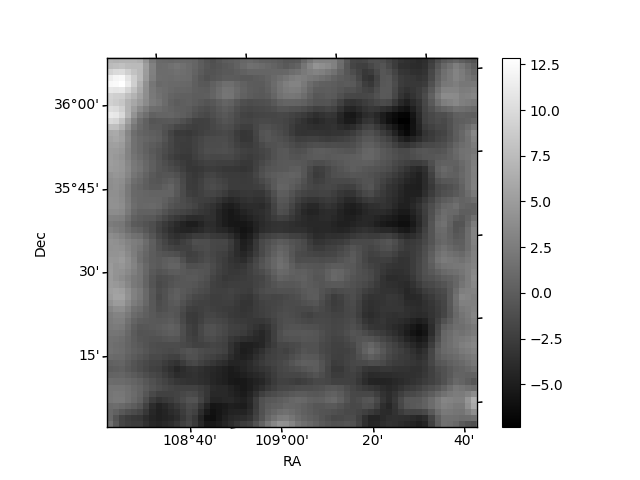
Histogram calculated using DETX and DETY for each event in the final _common_clean file
| Quadrant A | 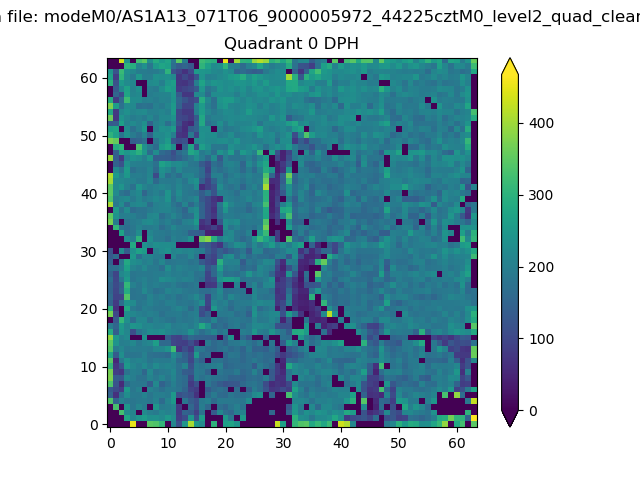 |
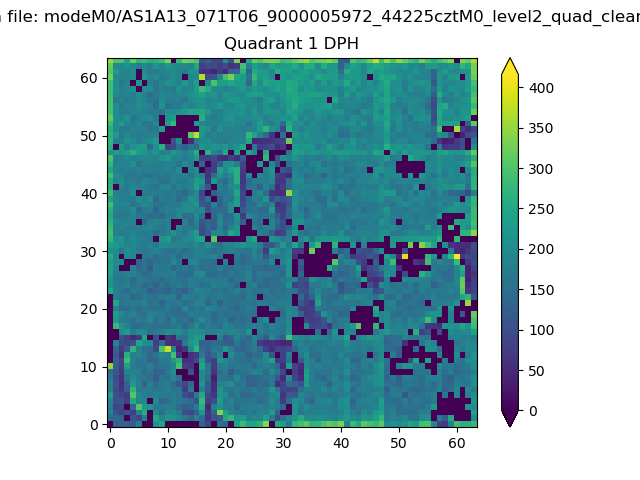 |
Quadrant B |
|---|---|---|---|
| Quadrant D | 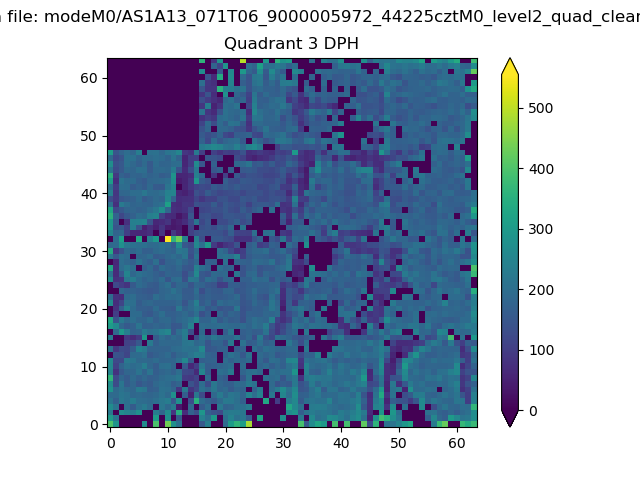 |
 |
Quadrant C |
| Plot type | Count rate plots | Images |
|---|---|---|
| Comparison with Poisson distribution Blue bars denote a histogram of data divided into 1 sec bins. Red curve is a Poisson curve with rate = median count rate of data. |
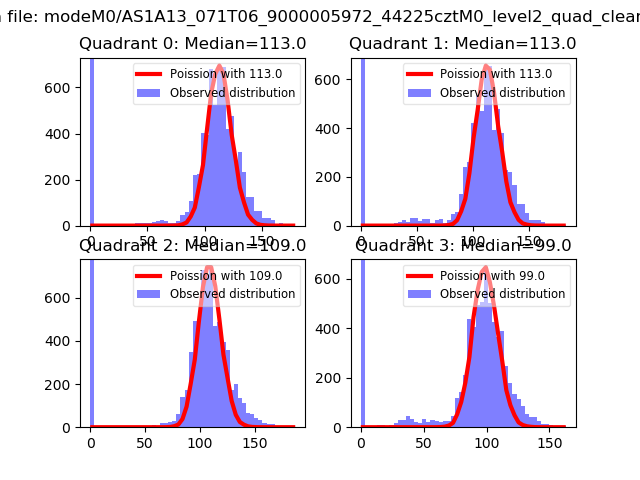 |
 |
| Quadrant-wise count rates Data is divided into 100 sec bins |
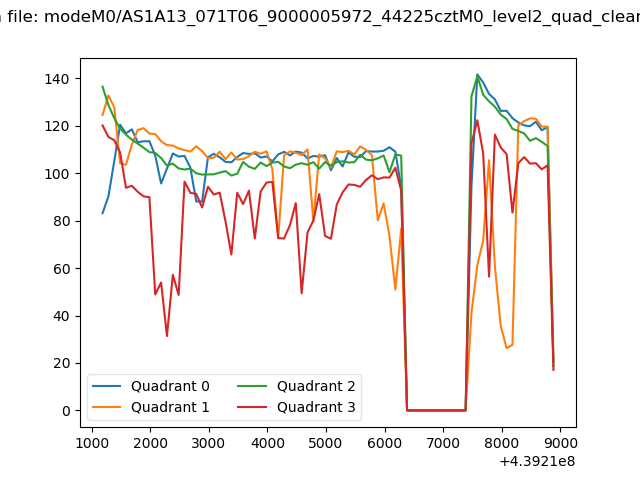 |
|
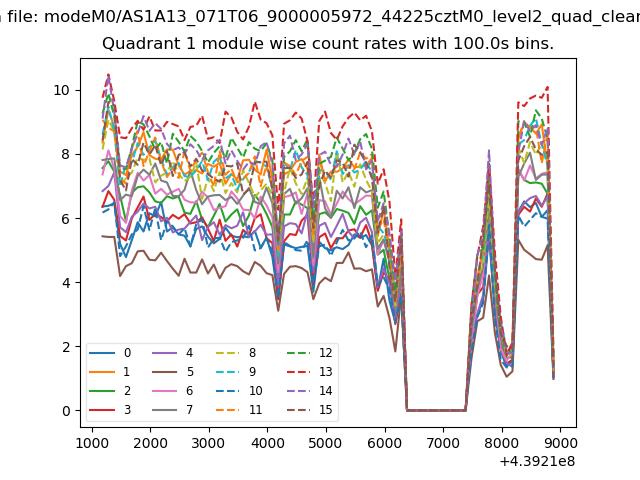
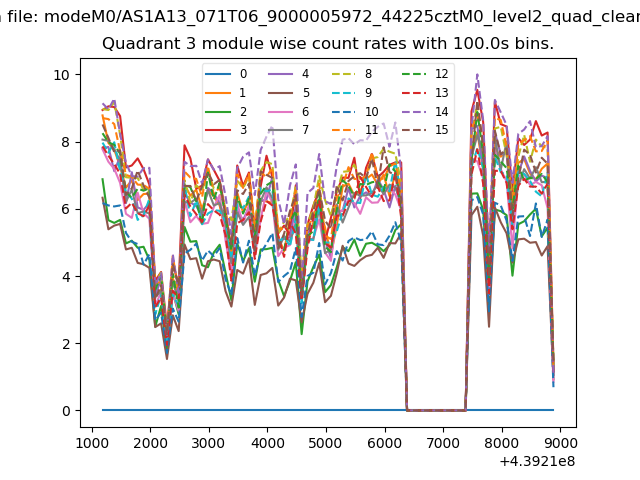
| Module-wise count rates for Quadrant A Data is divided into 100 sec bins |
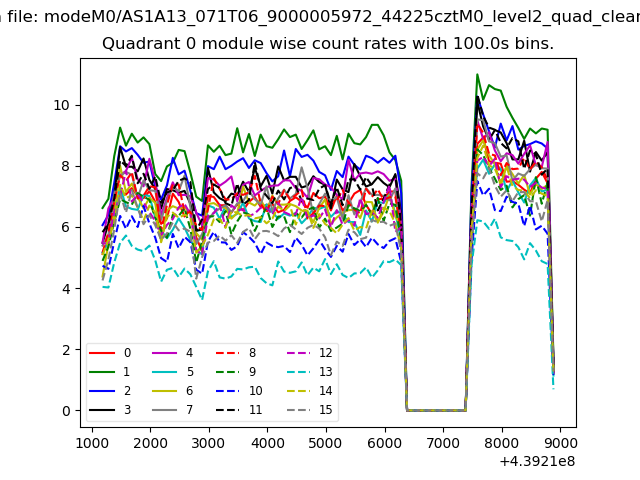 |
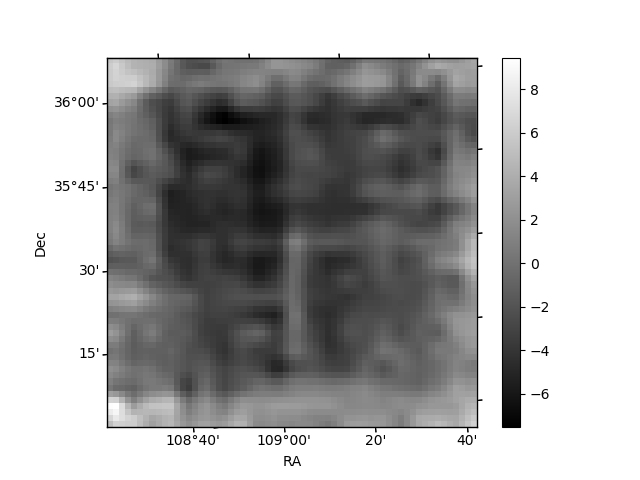 |
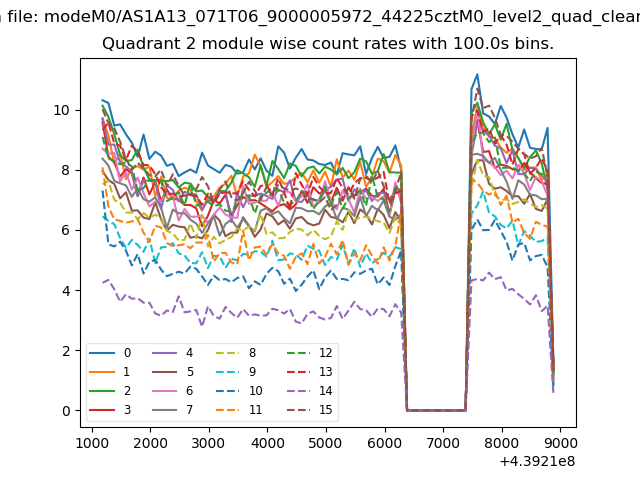
| Module-wise count rates for Quadrant B Data is divided into 100 sec bins |
 |
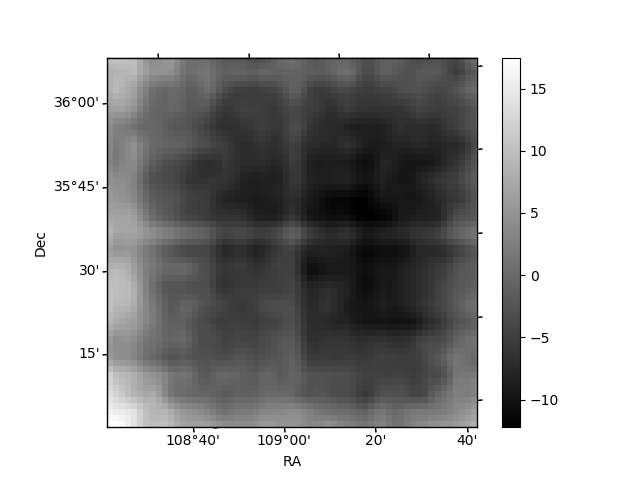 |
| Module-wise count rates for Quadrant C Data is divided into 100 sec bins |
 |
 |
| Module-wise count rates for Quadrant D Data is divided into 100 sec bins |
 |
 |
| Parameter | Plot |
|---|---|
| CZT HV Monitor | 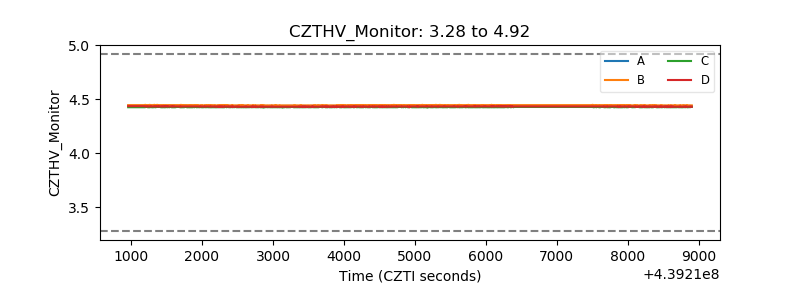 |
| D_VDD | 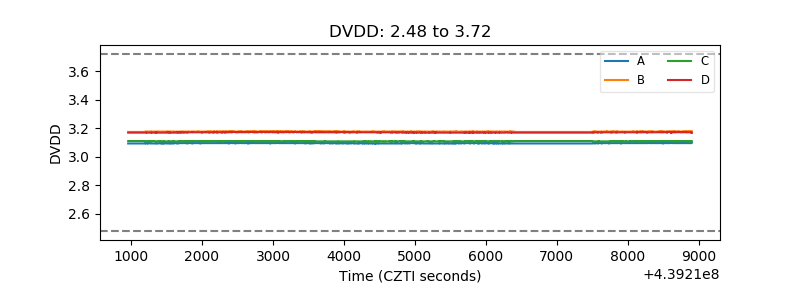 |
| Temperature 1 | 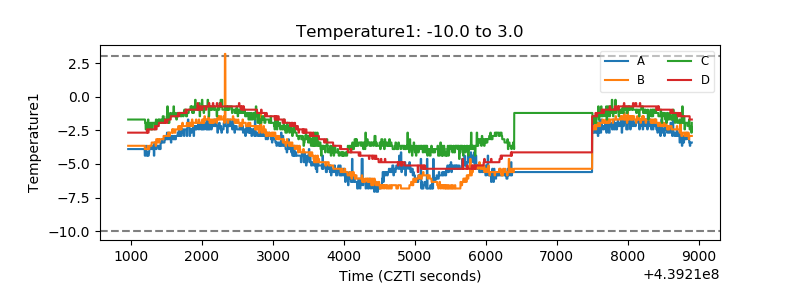 |
| Veto HV Monitor | 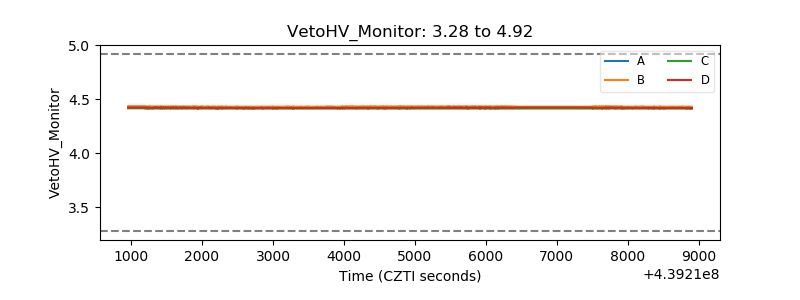 |
| Veto LLD | 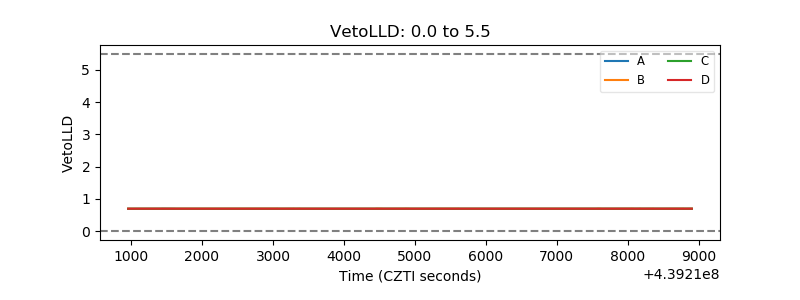 |
| Alpha Counter | 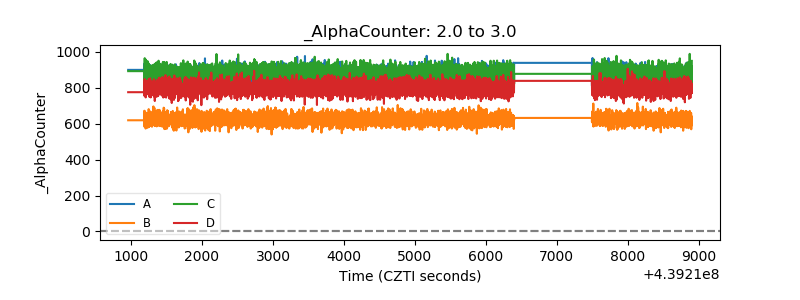 |
| _CPM_Rate | 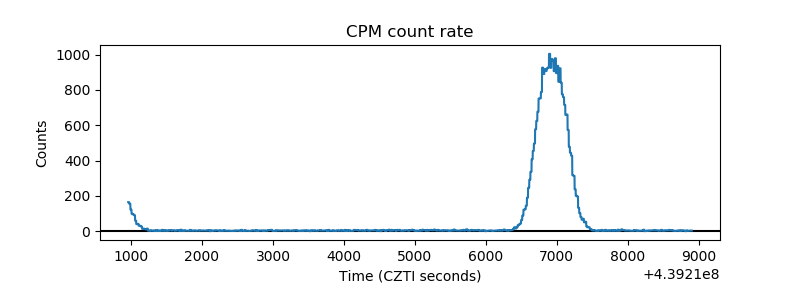 |
| CZT Counter | 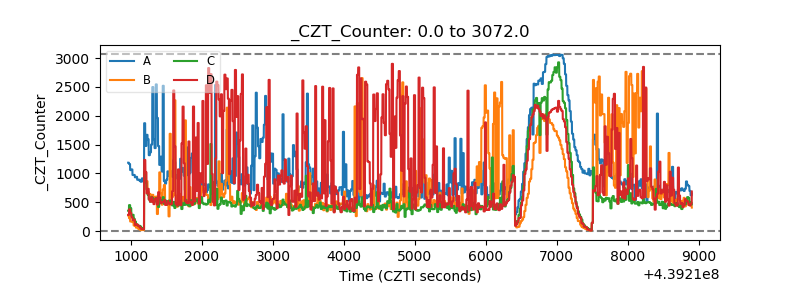 |
| +2.5 Volts monitor | 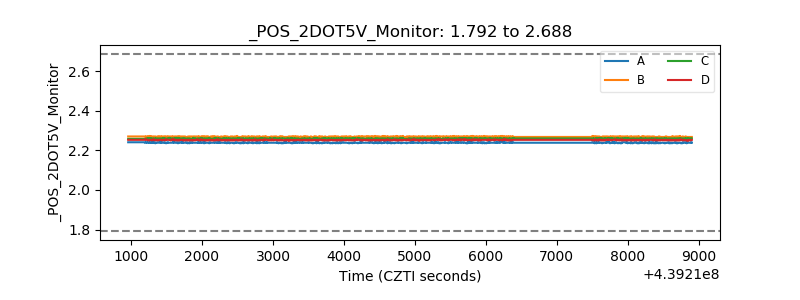 |
| +5 Volts monitor | 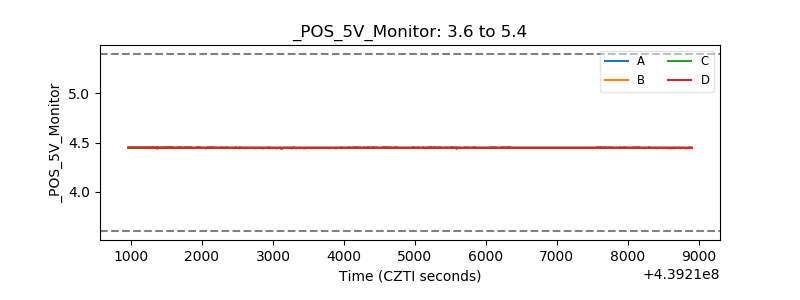 |
| _ROLL_ROT | 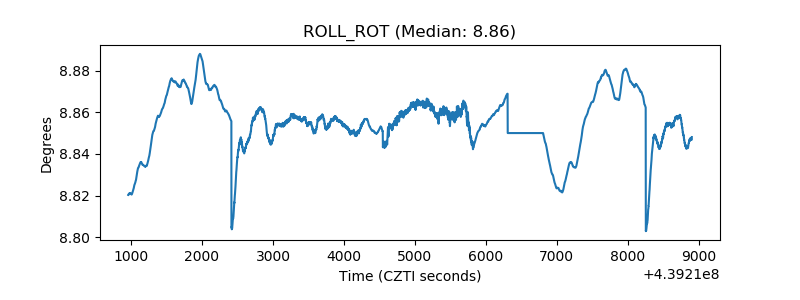 |
| _Roll_DEC | 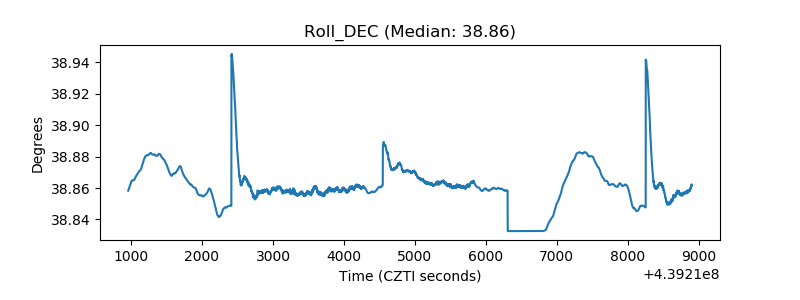 |
| _Roll_RA | 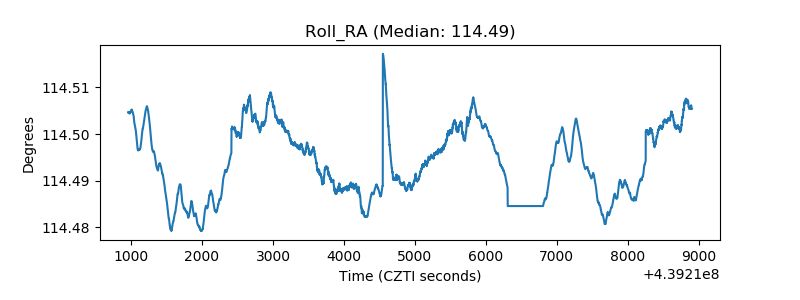 |
| Veto Counter | 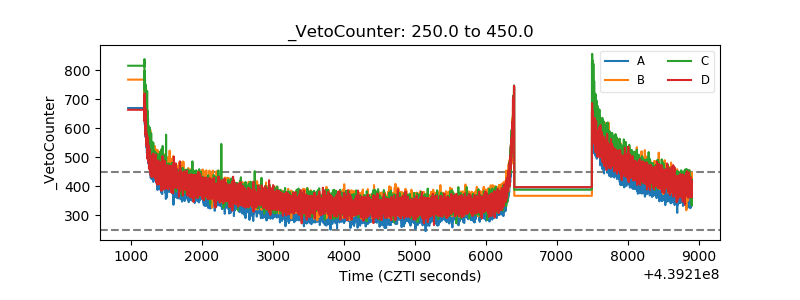 |