| Param | Original file | Final file |
|---|---|---|
| Filename | modeM0/AS1A13_071T06_9000005972_44227cztM0_level2.fits | modeM0/AS1A13_071T06_9000005972_44227cztM0_level2_quad_clean.evt |
| Size (bytes) | 500,659,200 | 110,926,080 |
| Size | 477.5 MB | 105.8 MB |
| Events in quadrant A | 6,670,749 | 697,829 |
| Events in quadrant B | 3,921,685 | 790,028 |
| Events in quadrant C | 3,237,604 | 758,015 |
| Events in quadrant D | 4,213,036 | 672,549 |
| Mode M0 | |||
|---|---|---|---|
| Quadrant | BADHDUFLAG | Total packets | Discarded packets |
| A | 0 | 24418 | 6 |
| B | 0 | 15875 | 2 |
| C | 0 | 13883 | 2 |
| D | 0 | 16823 | 2 |
| Mode SS | |||
|---|---|---|---|
| Quadrant | BADHDUFLAG | Total packets | Discarded packets |
| A | 0 | 130 | 0 |
| B | 0 | 130 | 0 |
| C | 0 | 130 | 0 |
| D | 0 | 130 | 0 |
| Mode M9 | |||
|---|---|---|---|
| Quadrant | BADHDUFLAG | Total packets | Discarded packets |
| A | 0 | 18 | 0 |
| B | 0 | 19 | 0 |
| C | 0 | 19 | 0 |
| D | 0 | 19 | 0 |
| Quadrant | Total seconds | Saturated seconds | Saturation percentage |
|---|---|---|---|
| A | 6306 | 858 | 13.606089% |
| B | 6306 | 194 | 3.076435% |
| C | 6306 | 121 | 1.918807% |
| D | 6306 | 332 | 5.264827% |
Noise dominated data is calculated using 1-second bins in cleaned event files. If a bin has >2000 counts, and if more than 50% of those come from <1% of pixels, then it is considered to be noise-dominated and hence unusable.
| Quadrant | # 1 sec bins | Bins with >0 counts | Bins with >2000 counts | High rate bins dominated by noise | Noise dominated (total time) | Noise dominated (detector-on time) | Marked lightcurve |
|---|---|---|---|---|---|---|---|
| A | 7520 | 6306 | 510 | 510 | 6.78% | 8.09% | 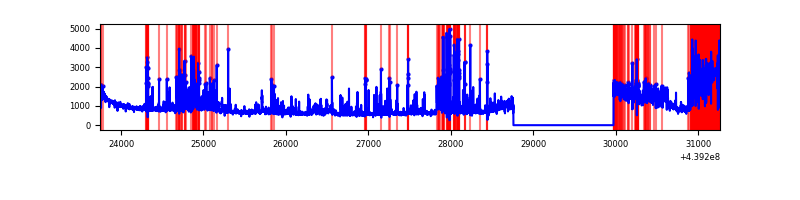 |
| B | 7521 | 6307 | 43 | 43 | 0.57% | 0.68% | 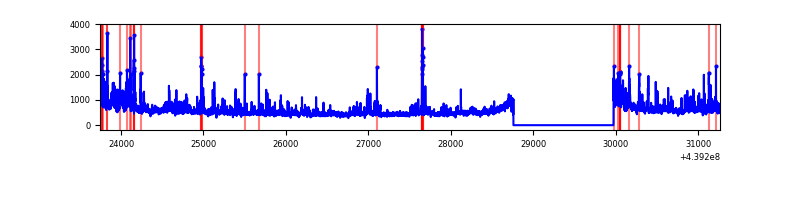 |
| C | 7521 | 6307 | 22 | 22 | 0.29% | 0.35% | 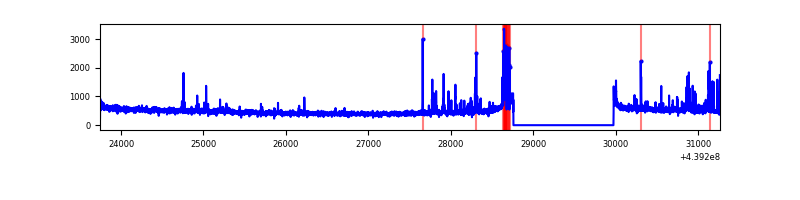 |
| D | 7521 | 6307 | 193 | 193 | 2.57% | 3.06% | 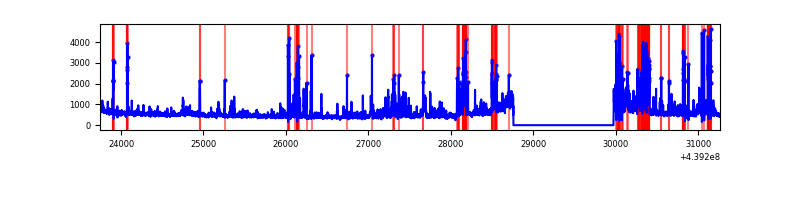 |
Top three noisy pixels from each quadrant. If the there are fewer than three noisy pixels in the level2.evt file, extra rows are filled as -1
| Pixel properties | Quadrant properties | ||||||
|---|---|---|---|---|---|---|---|
| Quadrant | DetID | PixID | Counts | Sigma | Mean | Median | Sigma |
| A | 15 | 223 | 1987076 | 13230.45 | 728 | 716 | 150.1 |
| A | 10 | 83 | 1572470 | 10468.91 | 728 | 716 | 150.1 |
| A | 10 | 248 | 274605 | 1824.28 | 728 | 716 | 150.1 |
| B | 0 | 200 | 439459 | 2965.78 | 765 | 744 | 147.9 |
| B | 5 | 172 | 80081 | 536.33 | 765 | 744 | 147.9 |
| B | 0 | 219 | 70930 | 474.47 | 765 | 744 | 147.9 |
| C | 4 | 254 | 148852 | 835.3 | 759 | 766 | 177.3 |
| C | 14 | 254 | 79211 | 442.48 | 759 | 766 | 177.3 |
| C | 3 | 233 | 27002 | 147.99 | 759 | 766 | 177.3 |
| D | 5 | 222 | 445597 | 2381.5 | 745 | 724 | 186.8 |
| D | 1 | 52 | 370029 | 1976.97 | 745 | 724 | 186.8 |
| D | 13 | 249 | 247602 | 1321.59 | 745 | 724 | 186.8 |
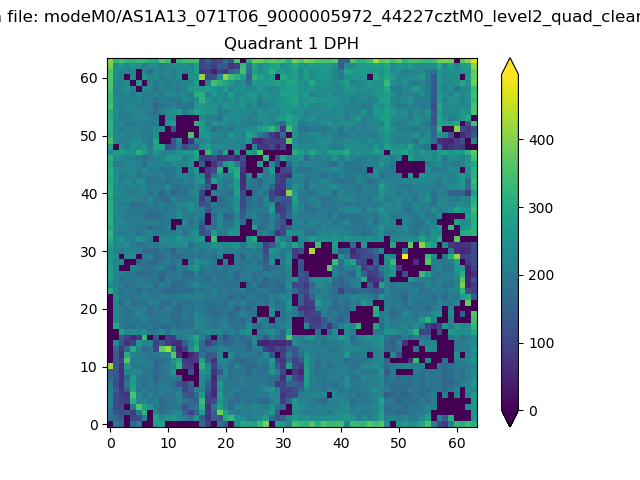
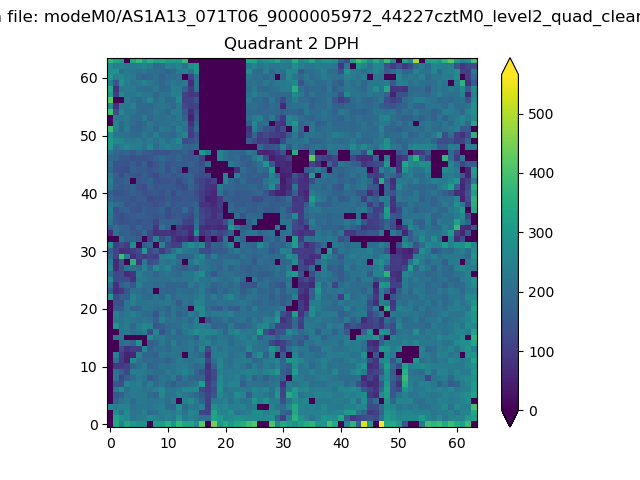
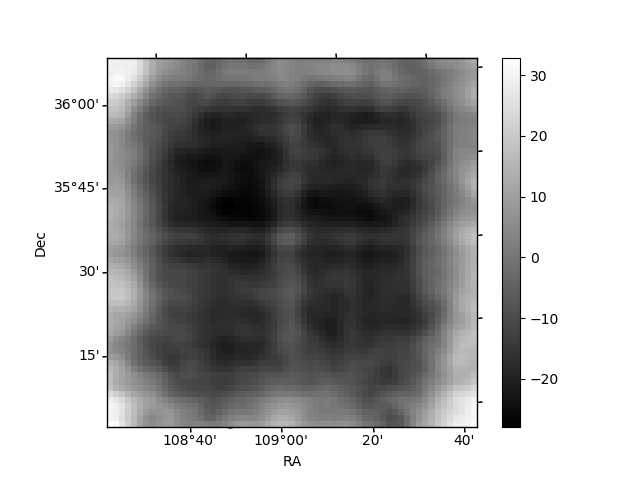
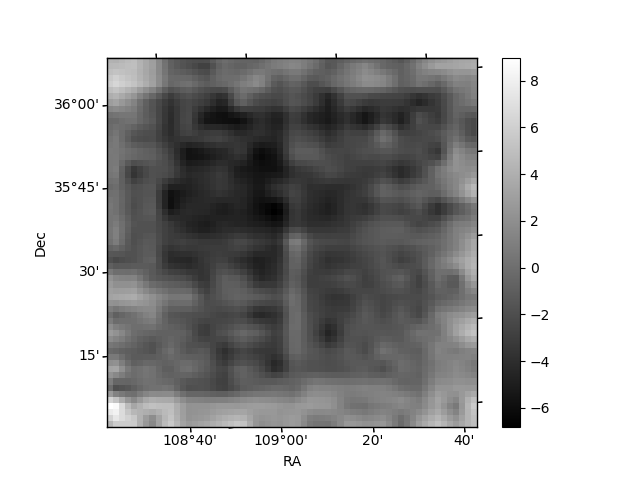
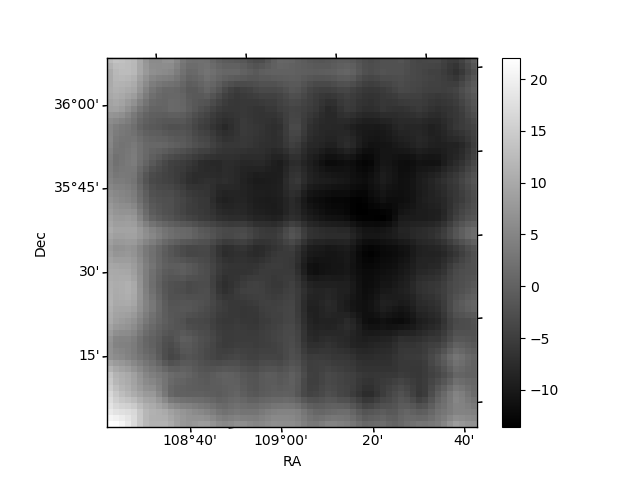
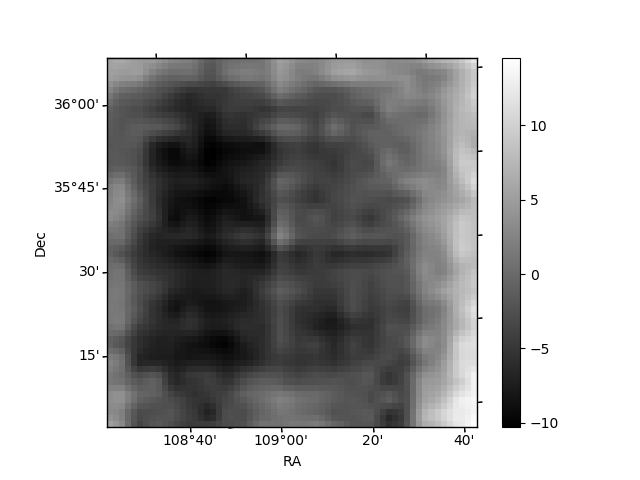
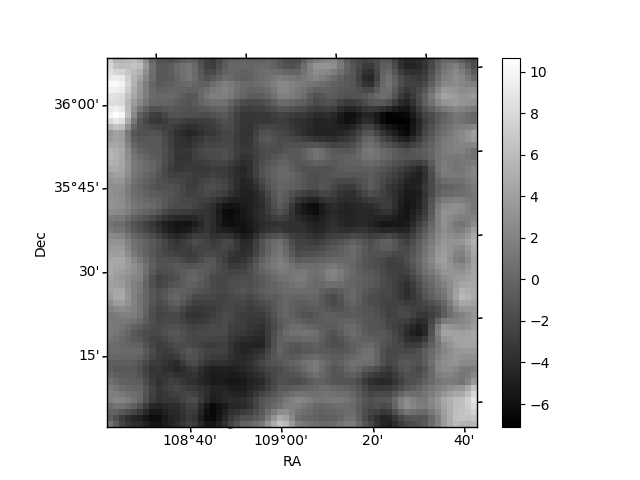
Histogram calculated using DETX and DETY for each event in the final _common_clean file
| Quadrant A |  |
 |
Quadrant B |
|---|---|---|---|
| Quadrant D | 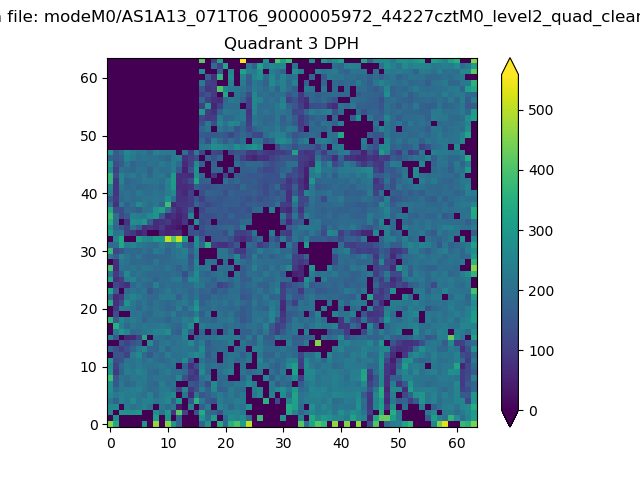 |
 |
Quadrant C |
| Plot type | Count rate plots | Images |
|---|---|---|
| Comparison with Poisson distribution Blue bars denote a histogram of data divided into 1 sec bins. Red curve is a Poisson curve with rate = median count rate of data. |
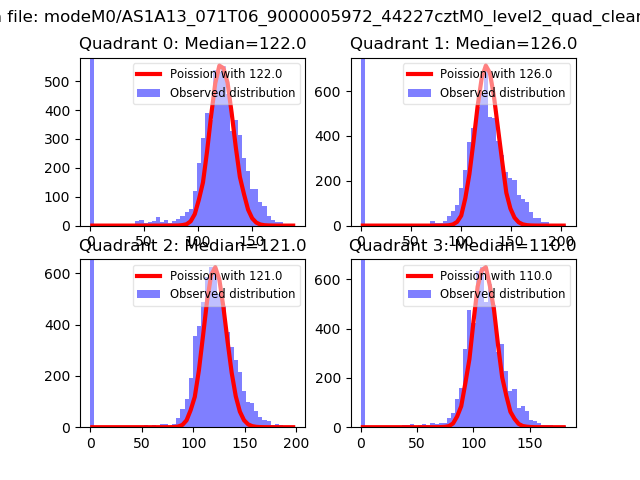 |
 |
| Quadrant-wise count rates Data is divided into 100 sec bins |
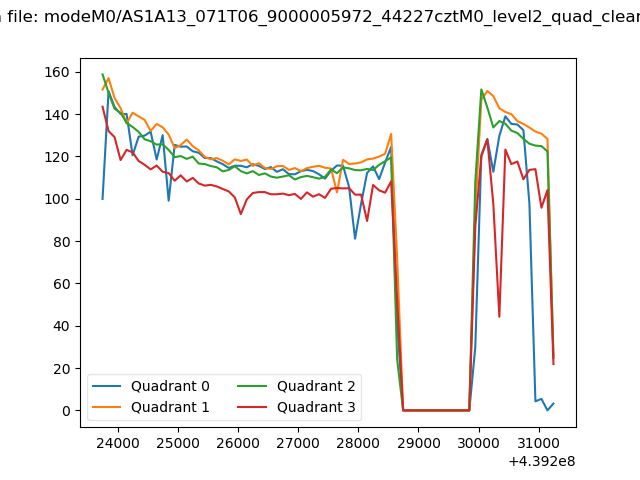 |
|
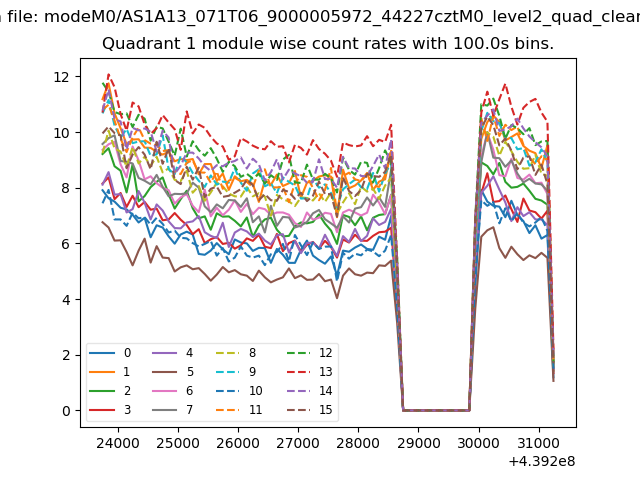
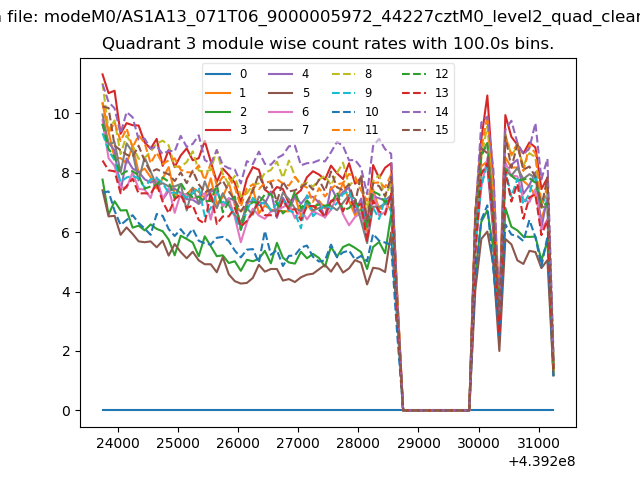
| Module-wise count rates for Quadrant A Data is divided into 100 sec bins |
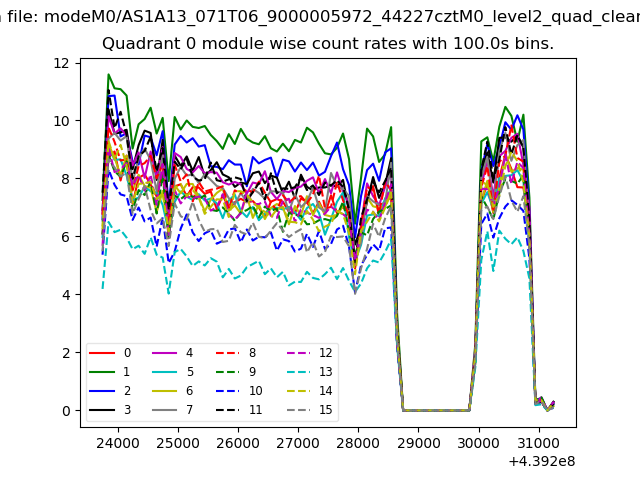 |
 |
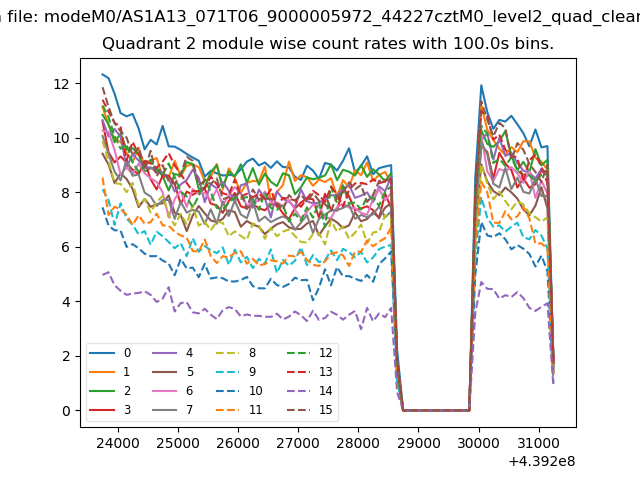
| Module-wise count rates for Quadrant B Data is divided into 100 sec bins |
 |
 |
| Module-wise count rates for Quadrant C Data is divided into 100 sec bins |
 |
 |
| Module-wise count rates for Quadrant D Data is divided into 100 sec bins |
 |
 |
| Parameter | Plot |
|---|---|
| CZT HV Monitor | 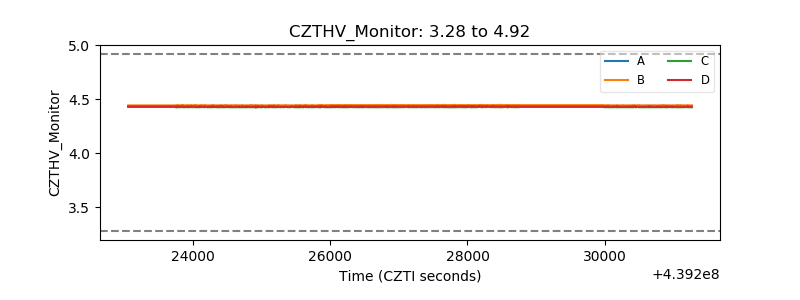 |
| D_VDD | 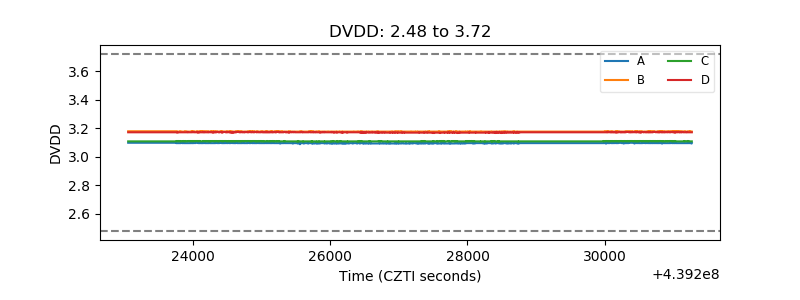 |
| Temperature 1 | 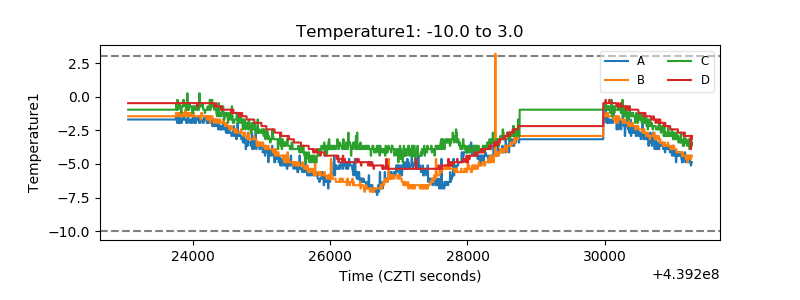 |
| Veto HV Monitor | 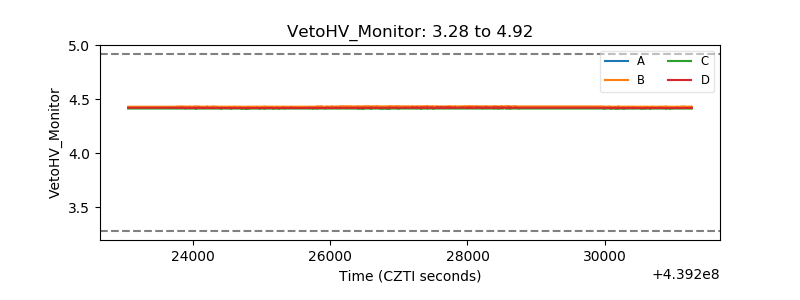 |
| Veto LLD | 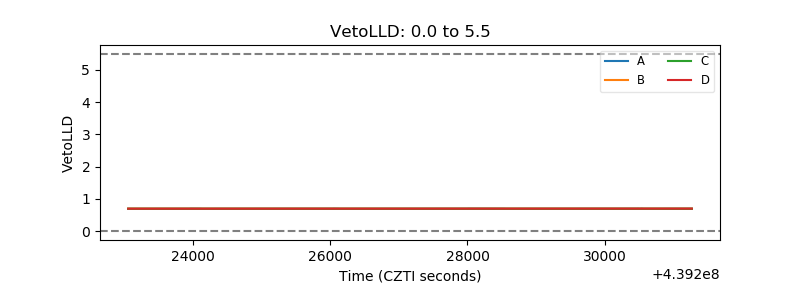 |
| Alpha Counter | 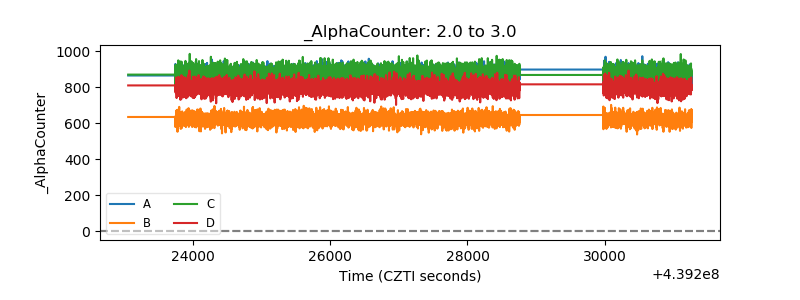 |
| _CPM_Rate | 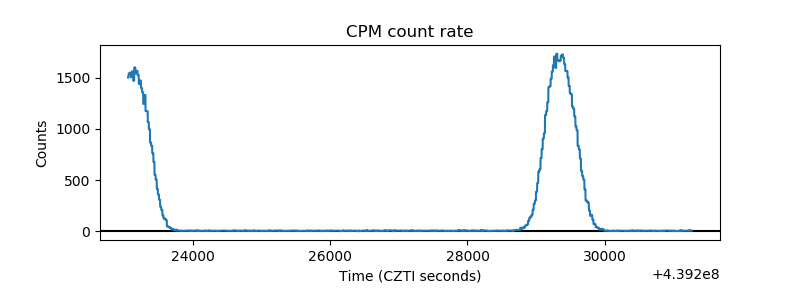 |
| CZT Counter | 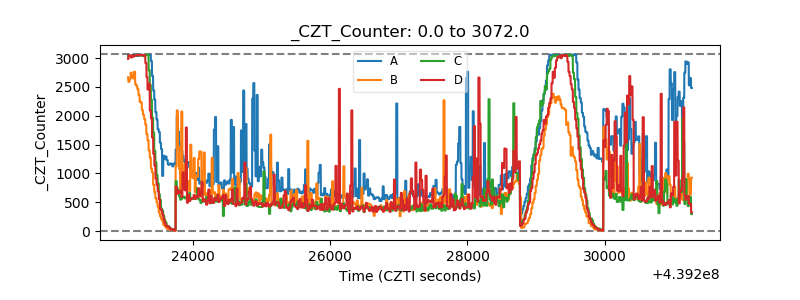 |
| +2.5 Volts monitor | 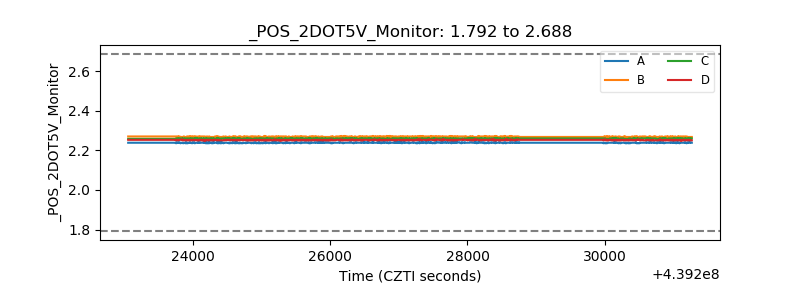 |
| +5 Volts monitor | 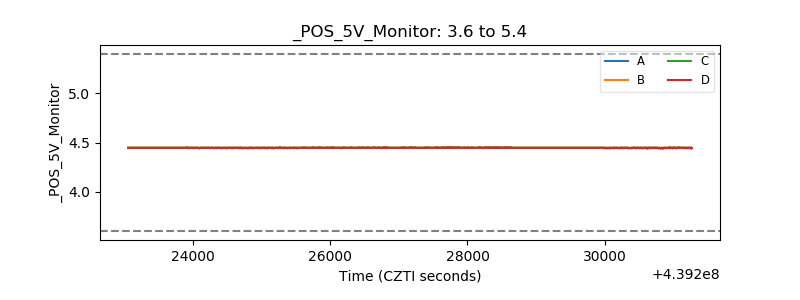 |
| _ROLL_ROT | 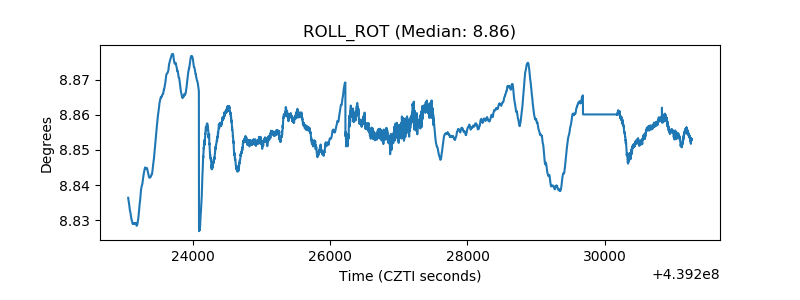 |
| _Roll_DEC | 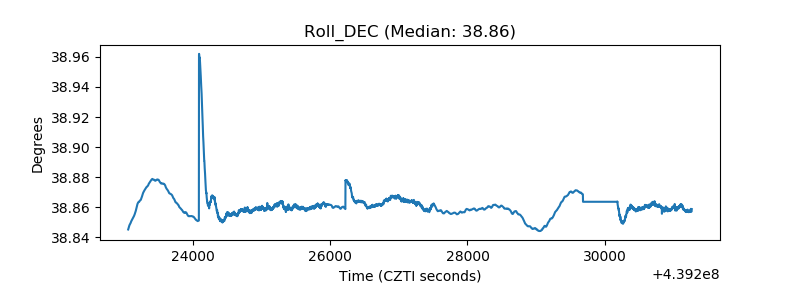 |
| _Roll_RA | 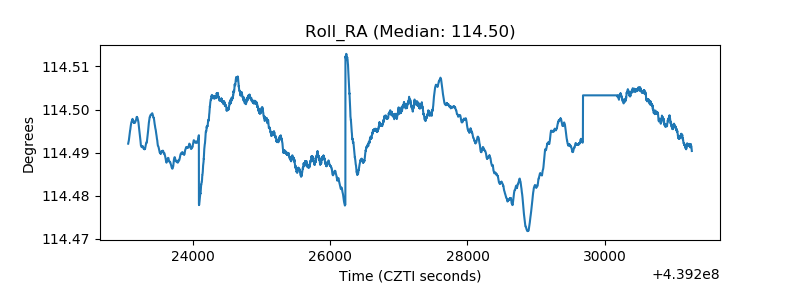 |
| Veto Counter | 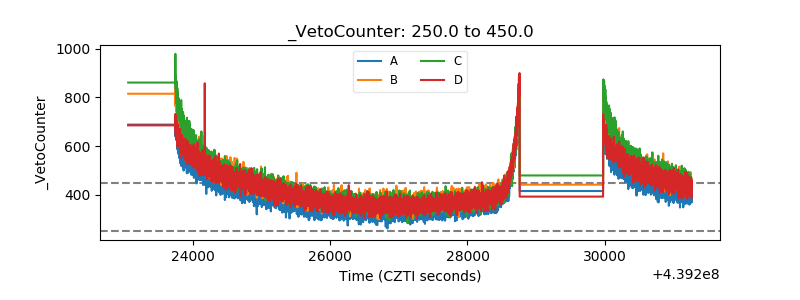 |