| Param | Original file | Final file |
|---|---|---|
| Filename | modeM0/AS1A13_071T06_9000005972_44228cztM0_level2.fits | modeM0/AS1A13_071T06_9000005972_44228cztM0_level2_quad_clean.evt |
| Size (bytes) | 622,843,200 | 100,152,000 |
| Size | 594.0 MB | 95.5 MB |
| Events in quadrant A | 10,273,769 | 507,925 |
| Events in quadrant B | 4,001,899 | 754,616 |
| Events in quadrant C | 3,199,965 | 733,009 |
| Events in quadrant D | 5,103,275 | 608,014 |
| Mode M0 | |||
|---|---|---|---|
| Quadrant | BADHDUFLAG | Total packets | Discarded packets |
| A | 0 | 34770 | 1 |
| B | 0 | 16070 | 1 |
| C | 0 | 13600 | 1 |
| D | 0 | 19401 | 1 |
| Mode SS | |||
|---|---|---|---|
| Quadrant | BADHDUFLAG | Total packets | Discarded packets |
| A | 0 | 124 | 0 |
| B | 0 | 124 | 0 |
| C | 0 | 124 | 0 |
| D | 0 | 124 | 0 |
| Mode M9 | |||
|---|---|---|---|
| Quadrant | BADHDUFLAG | Total packets | Discarded packets |
| A | 0 | 12 | 0 |
| B | 0 | 12 | 0 |
| C | 0 | 12 | 0 |
| D | 0 | 12 | 0 |
| Quadrant | Total seconds | Saturated seconds | Saturation percentage |
|---|---|---|---|
| A | 6148 | 2375 | 38.630449% |
| B | 6147 | 179 | 2.911990% |
| C | 6148 | 79 | 1.284971% |
| D | 6148 | 692 | 11.255693% |
Noise dominated data is calculated using 1-second bins in cleaned event files. If a bin has >2000 counts, and if more than 50% of those come from <1% of pixels, then it is considered to be noise-dominated and hence unusable.
| Quadrant | # 1 sec bins | Bins with >0 counts | Bins with >2000 counts | High rate bins dominated by noise | Noise dominated (total time) | Noise dominated (detector-on time) | Marked lightcurve |
|---|---|---|---|---|---|---|---|
| A | 7363 | 6149 | 1894 | 1894 | 25.72% | 30.80% | 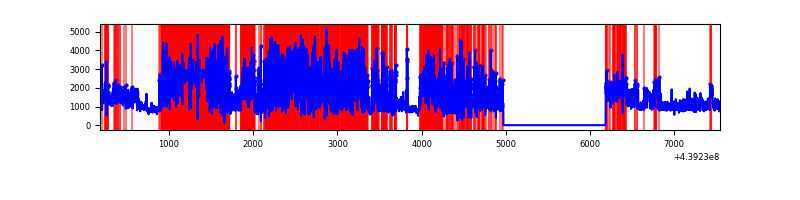 |
| B | 7362 | 6148 | 44 | 44 | 0.60% | 0.72% | 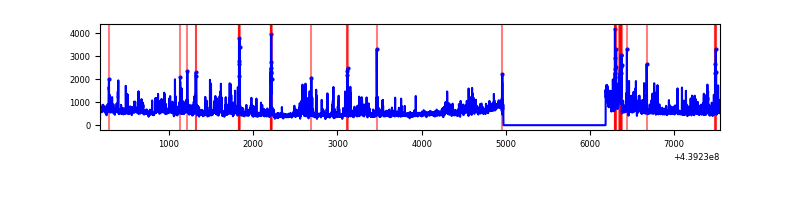 |
| C | 7363 | 6149 | 16 | 16 | 0.22% | 0.26% | 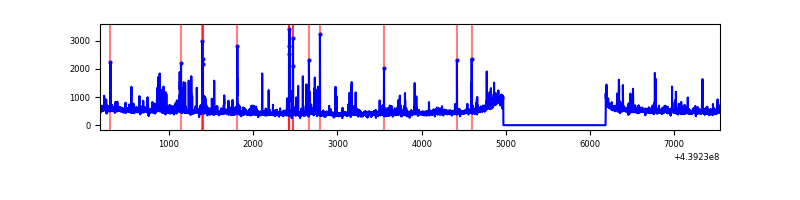 |
| D | 7363 | 6149 | 463 | 463 | 6.29% | 7.53% | 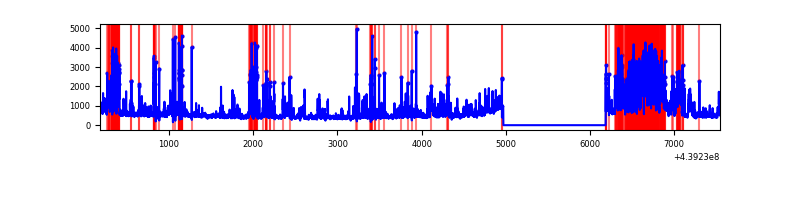 |
Top three noisy pixels from each quadrant. If the there are fewer than three noisy pixels in the level2.evt file, extra rows are filled as -1
| Pixel properties | Quadrant properties | ||||||
|---|---|---|---|---|---|---|---|
| Quadrant | DetID | PixID | Counts | Sigma | Mean | Median | Sigma |
| A | 15 | 223 | 6614801 | 52464.93 | 610 | 600 | 126.1 |
| A | 10 | 83 | 1261366 | 10000.6 | 610 | 600 | 126.1 |
| A | 10 | 248 | 11208 | 84.14 | 610 | 600 | 126.1 |
| B | 0 | 200 | 380500 | 2688.71 | 731 | 711 | 141.3 |
| B | 0 | 219 | 133236 | 938.21 | 731 | 711 | 141.3 |
| B | 4 | 158 | 111109 | 781.56 | 731 | 711 | 141.3 |
| C | 4 | 254 | 197095 | 1142.8 | 728 | 734 | 171.8 |
| C | 14 | 254 | 95719 | 552.8 | 728 | 734 | 171.8 |
| C | 3 | 233 | 29289 | 166.19 | 728 | 734 | 171.8 |
| D | 12 | 233 | 798343 | 4584.76 | 689 | 670 | 174.0 |
| D | 1 | 52 | 560687 | 3218.79 | 689 | 670 | 174.0 |
| D | 5 | 222 | 383888 | 2202.61 | 689 | 670 | 174.0 |
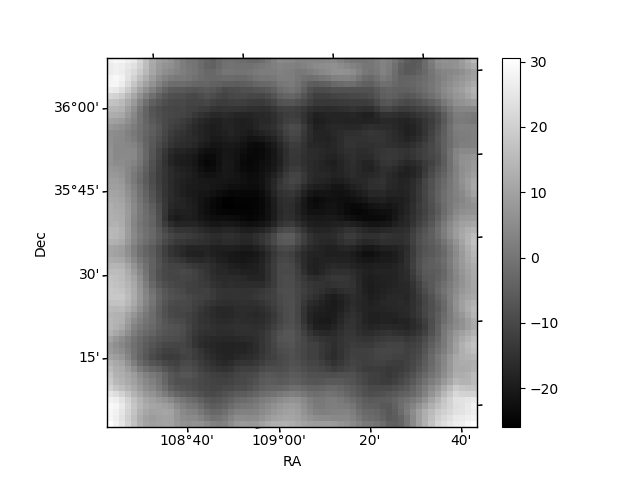
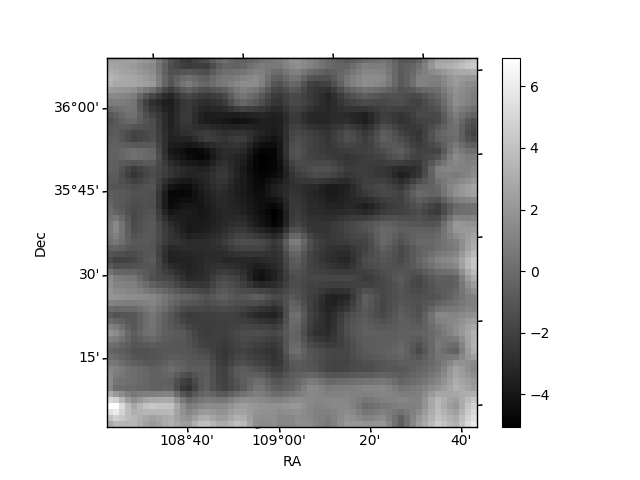
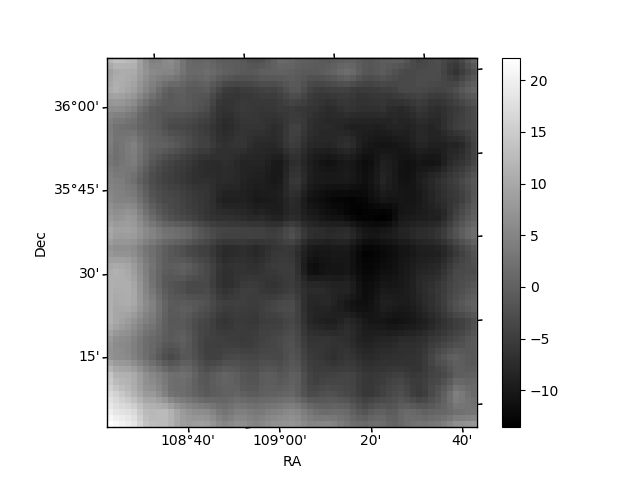
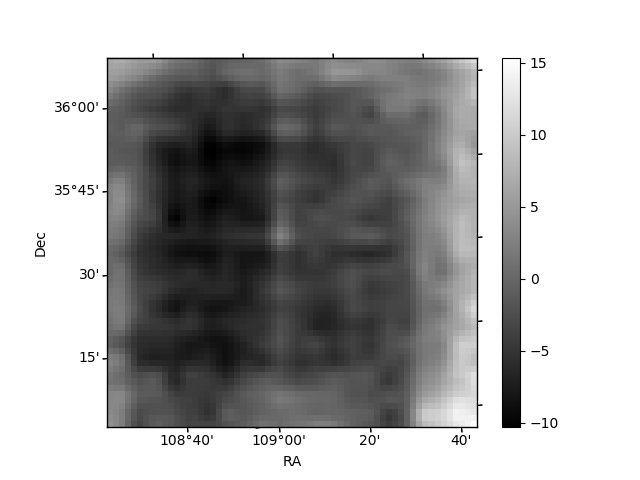
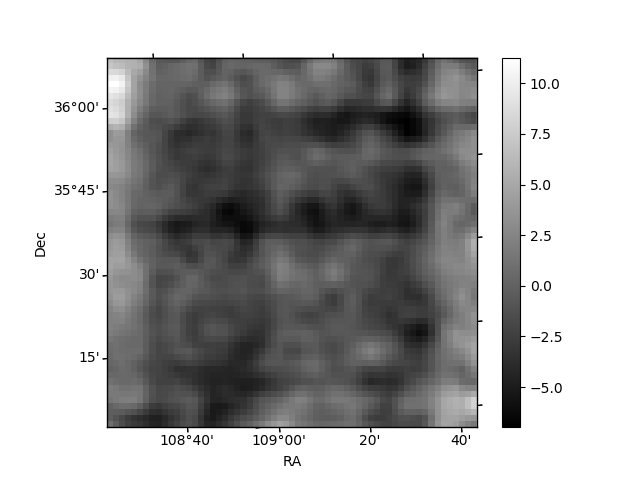
Histogram calculated using DETX and DETY for each event in the final _common_clean file
| Quadrant A | 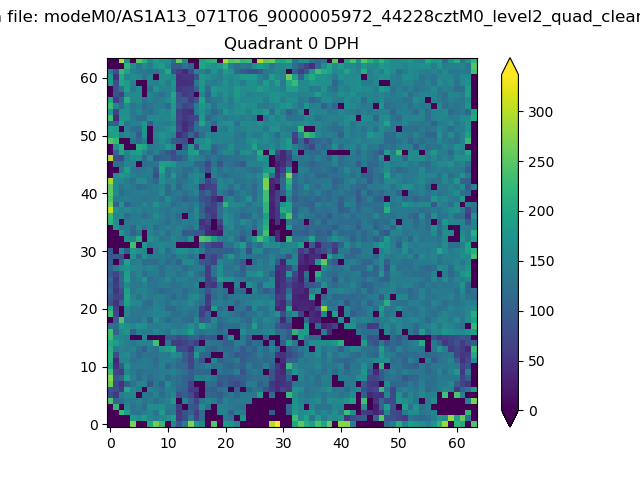 |
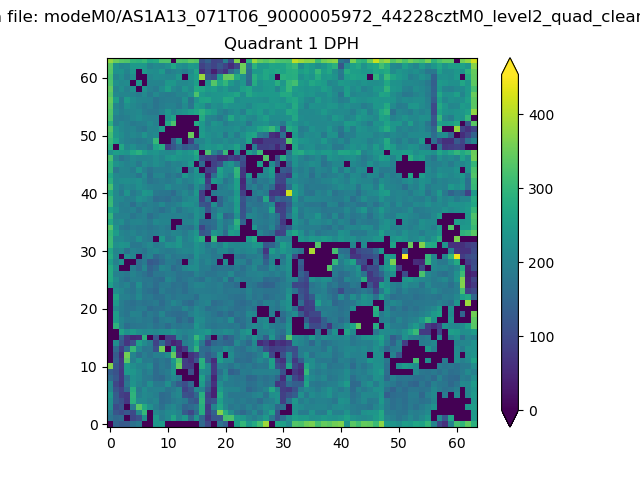 |
Quadrant B |
|---|---|---|---|
| Quadrant D |  |
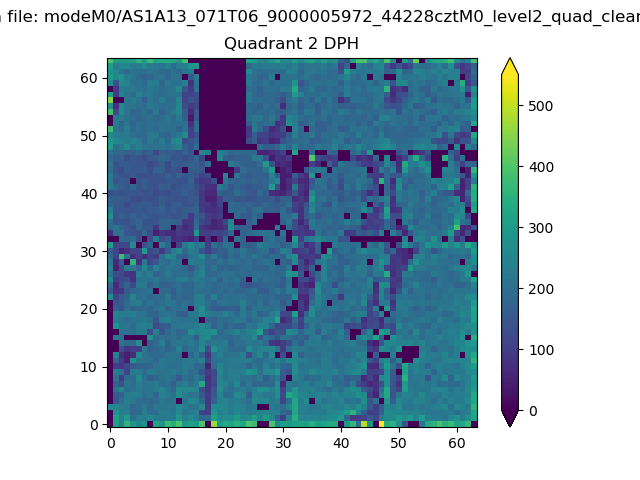 |
Quadrant C |
| Plot type | Count rate plots | Images |
|---|---|---|
| Comparison with Poisson distribution Blue bars denote a histogram of data divided into 1 sec bins. Red curve is a Poisson curve with rate = median count rate of data. |
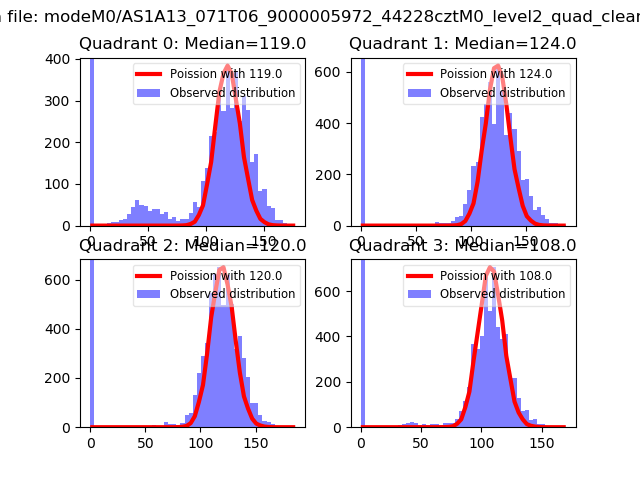 |
 |
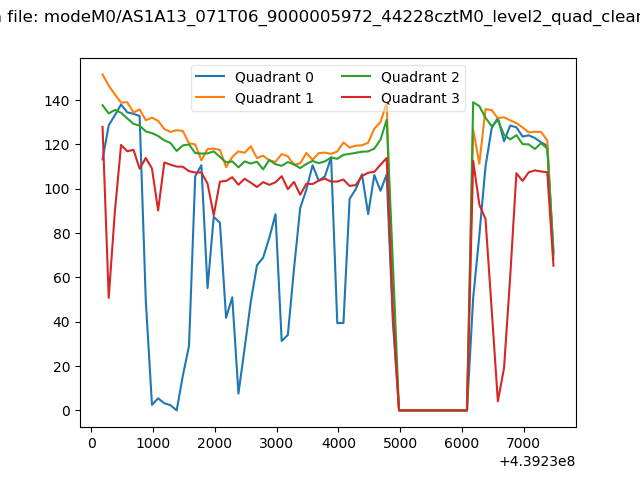
| Quadrant-wise count rates Data is divided into 100 sec bins |
 |
|
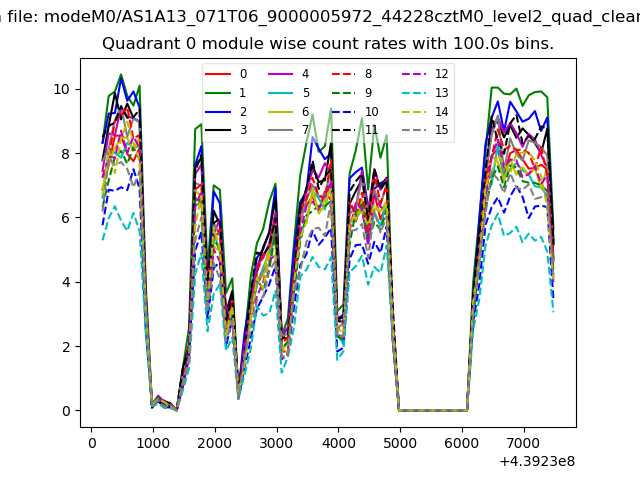
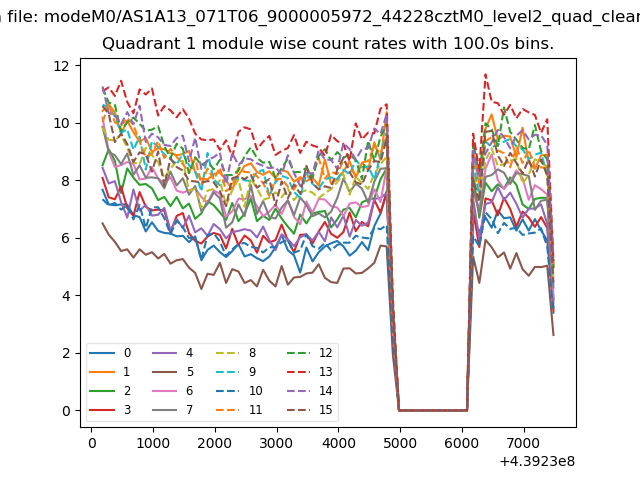
| Module-wise count rates for Quadrant A Data is divided into 100 sec bins |
 |
 |
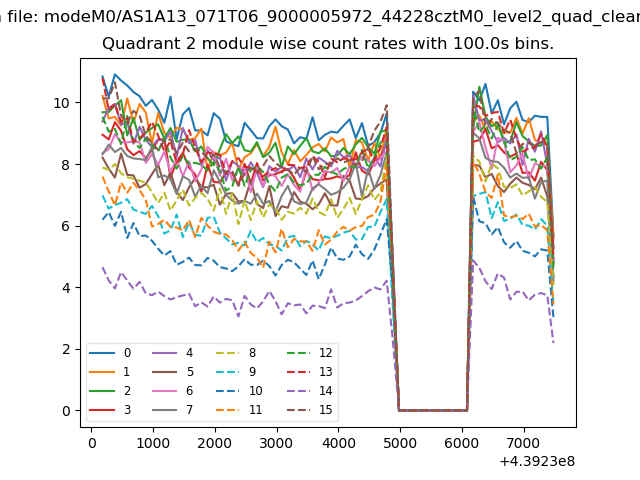
| Module-wise count rates for Quadrant B Data is divided into 100 sec bins |
 |
 |
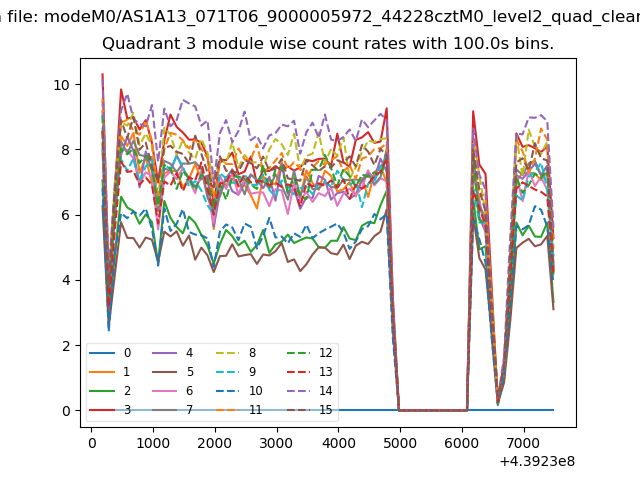
| Module-wise count rates for Quadrant C Data is divided into 100 sec bins |
 |
 |
| Module-wise count rates for Quadrant D Data is divided into 100 sec bins |
 |
 |
| Parameter | Plot |
|---|---|
| CZT HV Monitor | 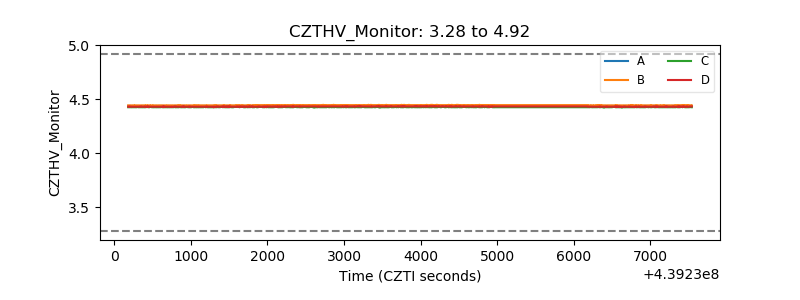 |
| D_VDD | 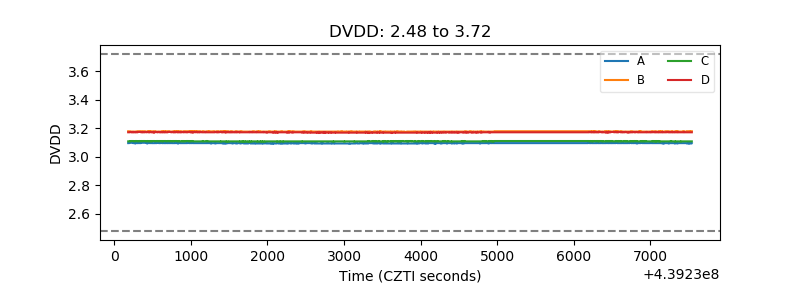 |
| Temperature 1 | 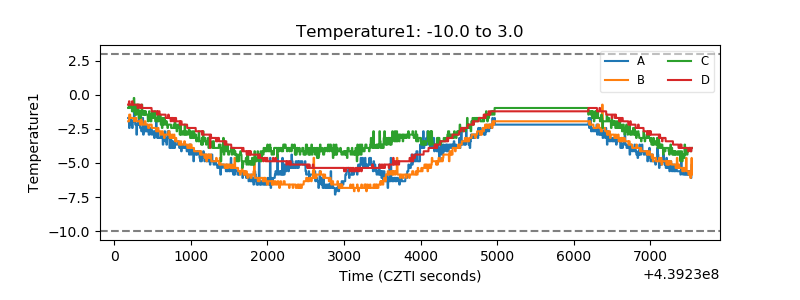 |
| Veto HV Monitor | 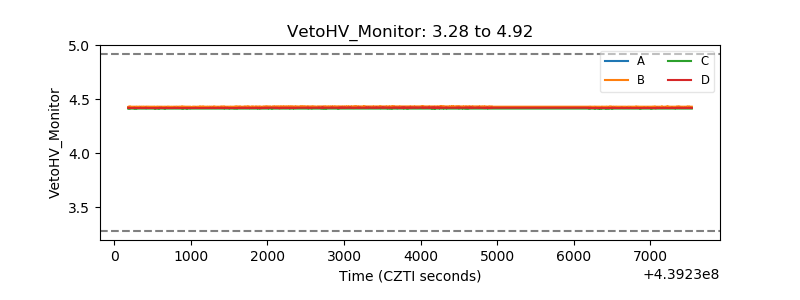 |
| Veto LLD | 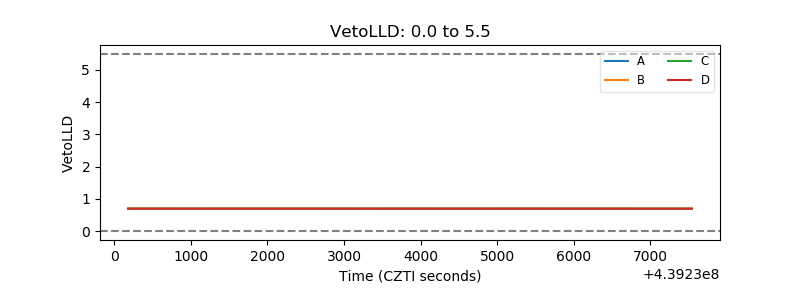 |
| Alpha Counter | 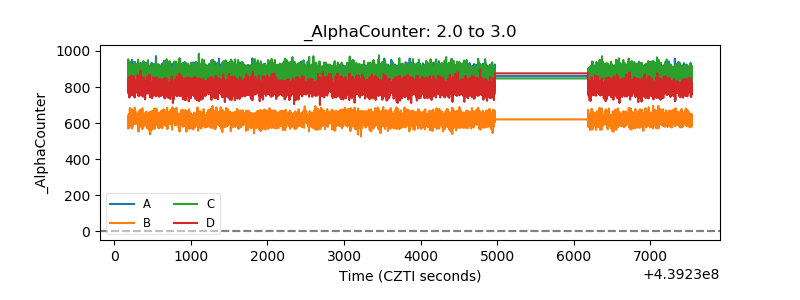 |
| _CPM_Rate | 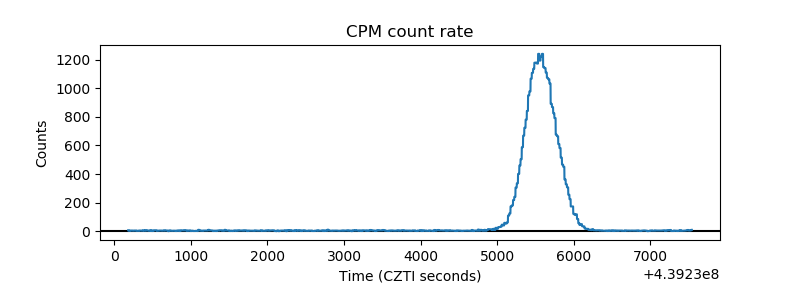 |
| CZT Counter | 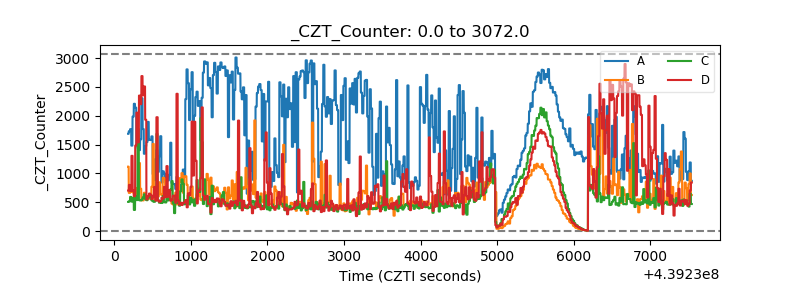 |
| +2.5 Volts monitor | 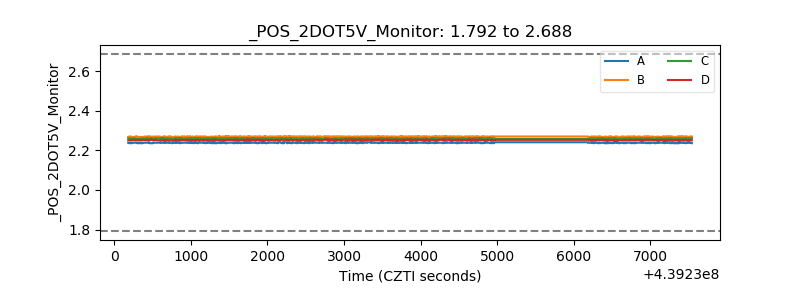 |
| +5 Volts monitor | 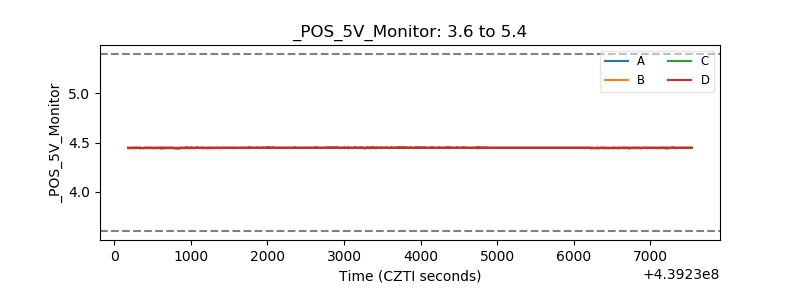 |
| _ROLL_ROT | 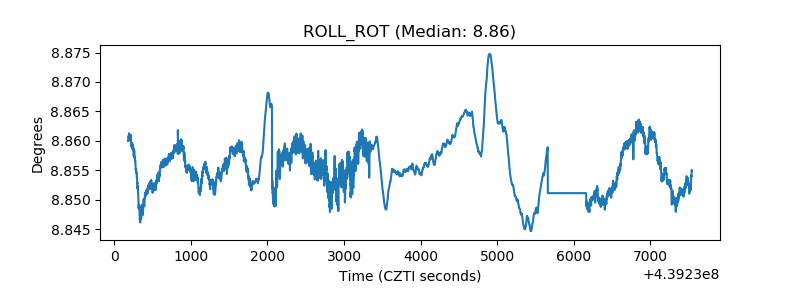 |
| _Roll_DEC | 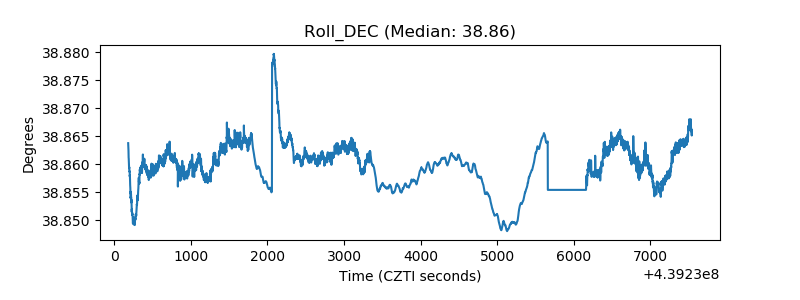 |
| _Roll_RA | 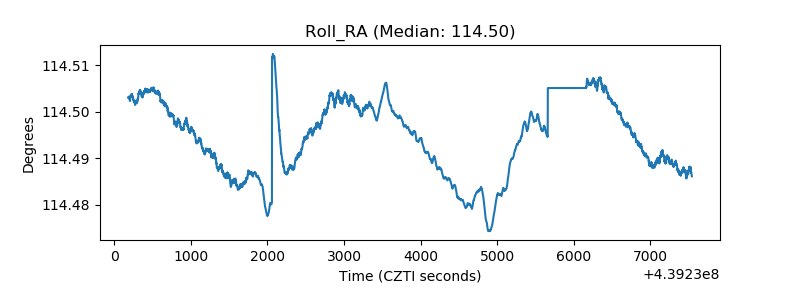 |
| Veto Counter | 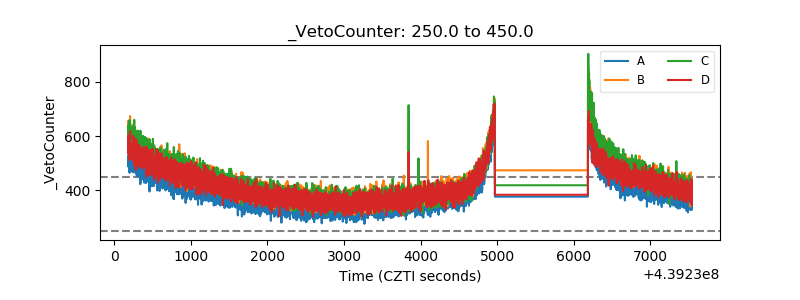 |