| Param | Original file | Final file |
|---|---|---|
| Filename | modeM0/AS1A13_071T06_9000005972_44229cztM0_level2.fits | modeM0/AS1A13_071T06_9000005972_44229cztM0_level2_quad_clean.evt |
| Size (bytes) | 585,656,640 | 104,826,240 |
| Size | 558.5 MB | 100.0 MB |
| Events in quadrant A | 7,926,239 | 602,184 |
| Events in quadrant B | 4,306,122 | 759,054 |
| Events in quadrant C | 3,312,691 | 742,641 |
| Events in quadrant D | 5,633,665 | 620,388 |
| Mode M0 | |||
|---|---|---|---|
| Quadrant | BADHDUFLAG | Total packets | Discarded packets |
| A | 0 | 28251 | 2 |
| B | 0 | 17104 | 2 |
| C | 0 | 14316 | 2 |
| D | 0 | 21161 | 2 |
| Mode SS | |||
|---|---|---|---|
| Quadrant | BADHDUFLAG | Total packets | Discarded packets |
| A | 0 | 130 | 0 |
| B | 0 | 130 | 0 |
| C | 0 | 130 | 0 |
| D | 0 | 130 | 0 |
| Mode M9 | |||
|---|---|---|---|
| Quadrant | BADHDUFLAG | Total packets | Discarded packets |
| A | 0 | 12 | 0 |
| B | 0 | 12 | 0 |
| C | 0 | 12 | 0 |
| D | 0 | 12 | 0 |
| Quadrant | Total seconds | Saturated seconds | Saturation percentage |
|---|---|---|---|
| A | 6452 | 1437 | 22.272164% |
| B | 6452 | 245 | 3.797272% |
| C | 6452 | 56 | 0.867948% |
| D | 6452 | 664 | 10.291383% |
Noise dominated data is calculated using 1-second bins in cleaned event files. If a bin has >2000 counts, and if more than 50% of those come from <1% of pixels, then it is considered to be noise-dominated and hence unusable.
| Quadrant | # 1 sec bins | Bins with >0 counts | Bins with >2000 counts | High rate bins dominated by noise | Noise dominated (total time) | Noise dominated (detector-on time) | Marked lightcurve |
|---|---|---|---|---|---|---|---|
| A | 7637 | 6453 | 1150 | 1150 | 15.06% | 17.82% | 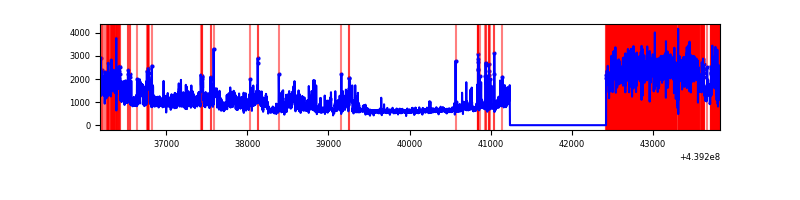 |
| B | 7637 | 6453 | 80 | 80 | 1.05% | 1.24% | 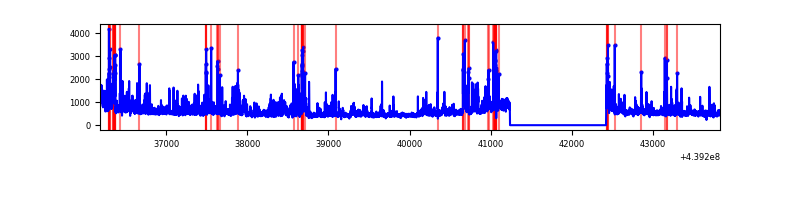 |
| C | 7637 | 6453 | 28 | 28 | 0.37% | 0.43% | 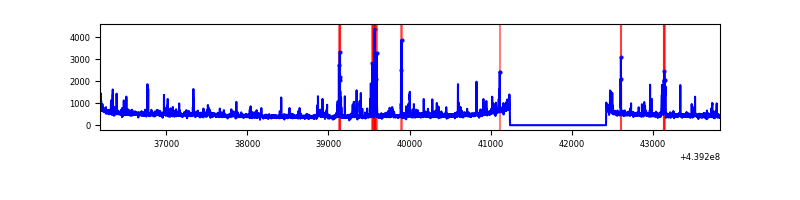 |
| D | 7637 | 6453 | 503 | 503 | 6.59% | 7.79% | 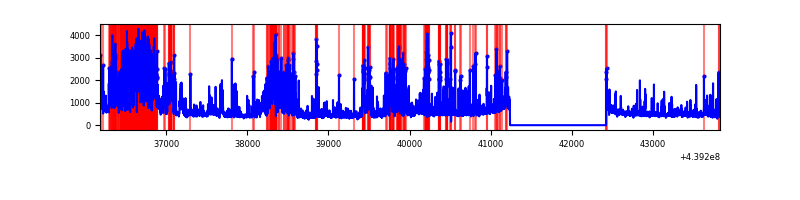 |
Top three noisy pixels from each quadrant. If the there are fewer than three noisy pixels in the level2.evt file, extra rows are filled as -1
| Pixel properties | Quadrant properties | ||||||
|---|---|---|---|---|---|---|---|
| Quadrant | DetID | PixID | Counts | Sigma | Mean | Median | Sigma |
| A | 15 | 223 | 3785890 | 26648.92 | 687 | 674 | 142.0 |
| A | 10 | 83 | 1448530 | 10193.29 | 687 | 674 | 142.0 |
| A | 7 | 3 | 11162 | 73.84 | 687 | 674 | 142.0 |
| B | 0 | 200 | 283348 | 1971.48 | 741 | 721 | 143.4 |
| B | 0 | 219 | 243360 | 1692.54 | 741 | 721 | 143.4 |
| B | 4 | 171 | 209287 | 1454.87 | 741 | 721 | 143.4 |
| C | 14 | 254 | 245395 | 1408.46 | 740 | 744 | 173.7 |
| C | 2 | 14 | 69384 | 395.16 | 740 | 744 | 173.7 |
| C | 4 | 254 | 52150 | 295.94 | 740 | 744 | 173.7 |
| D | 12 | 233 | 814438 | 4637.76 | 705 | 686 | 175.5 |
| D | 1 | 52 | 803131 | 4573.32 | 705 | 686 | 175.5 |
| D | 13 | 249 | 484089 | 2755.03 | 705 | 686 | 175.5 |
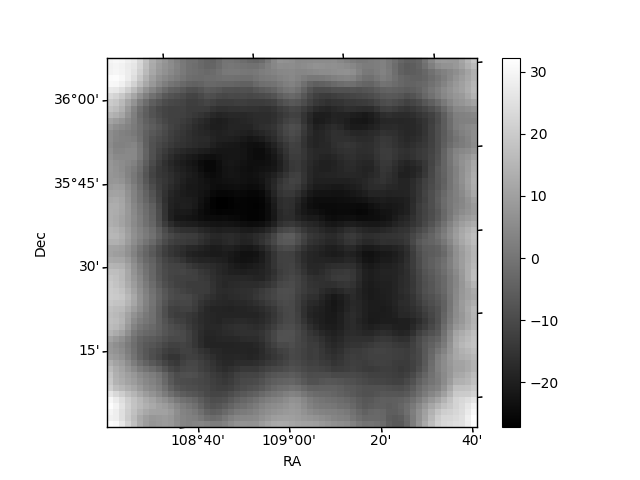
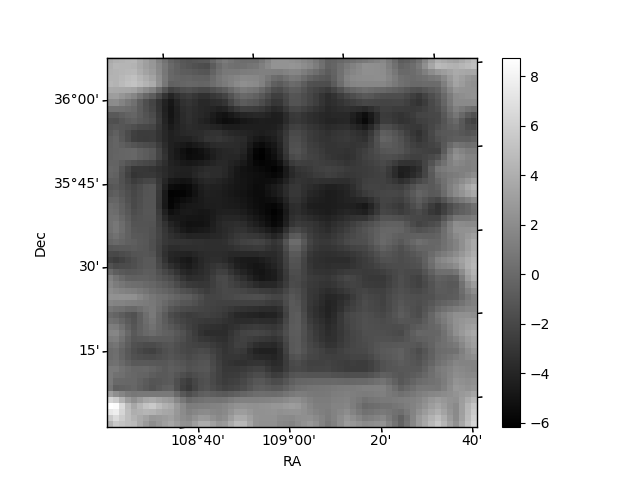
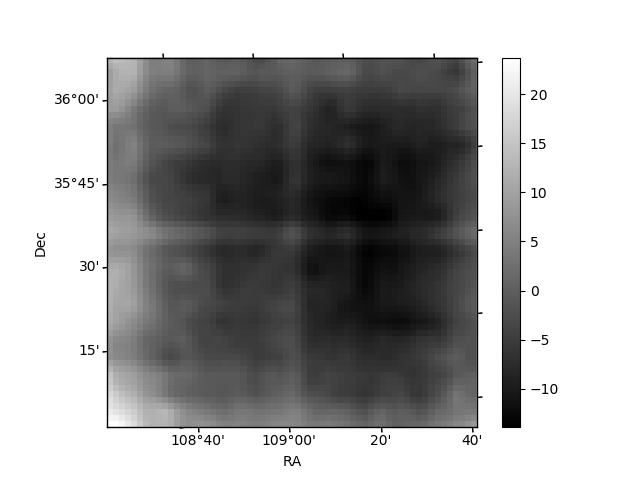
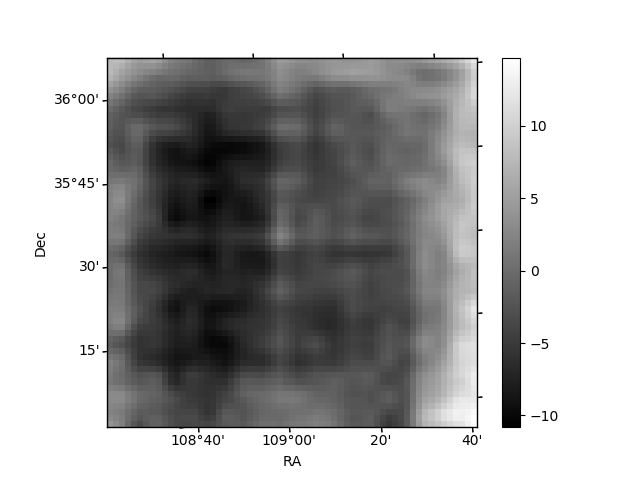
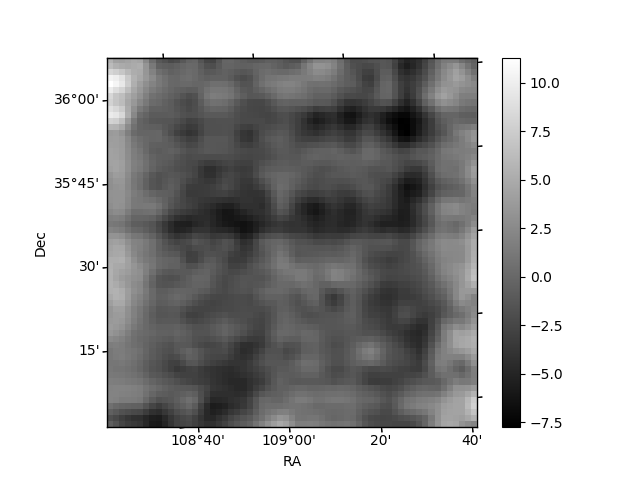
Histogram calculated using DETX and DETY for each event in the final _common_clean file
| Quadrant A | 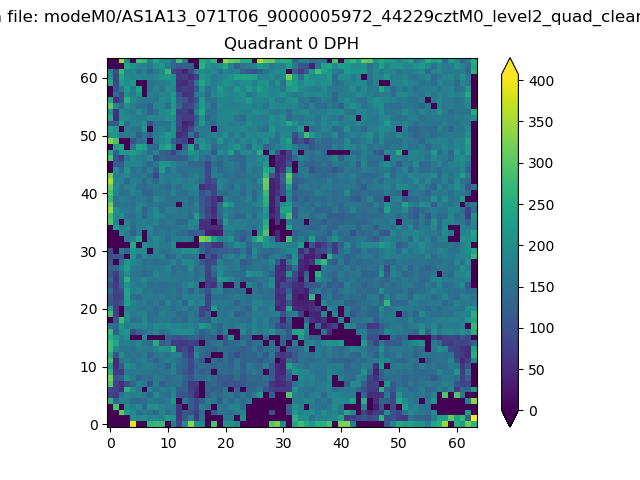 |
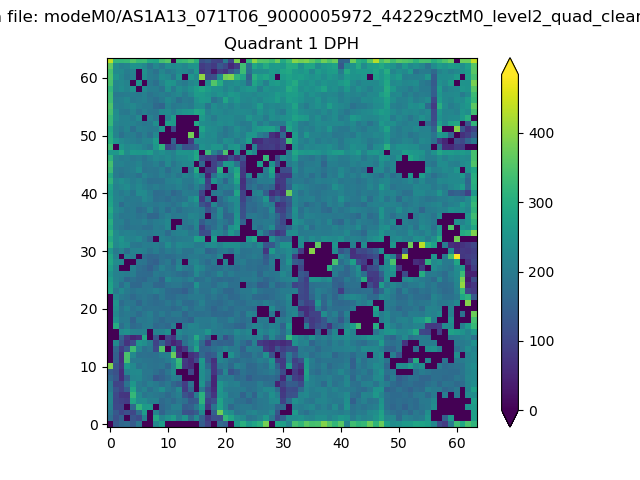 |
Quadrant B |
|---|---|---|---|
| Quadrant D | 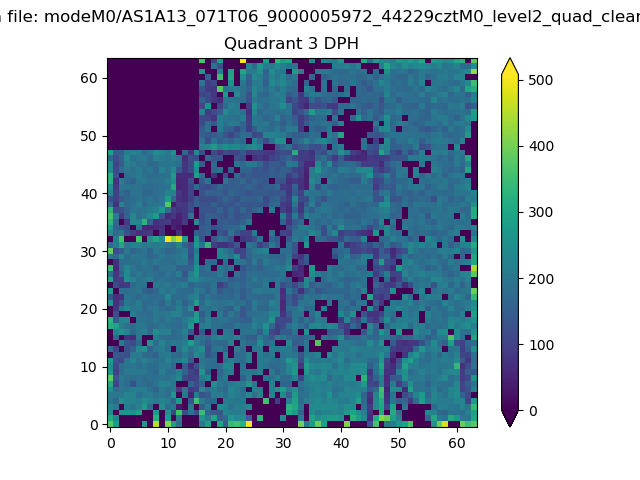 |
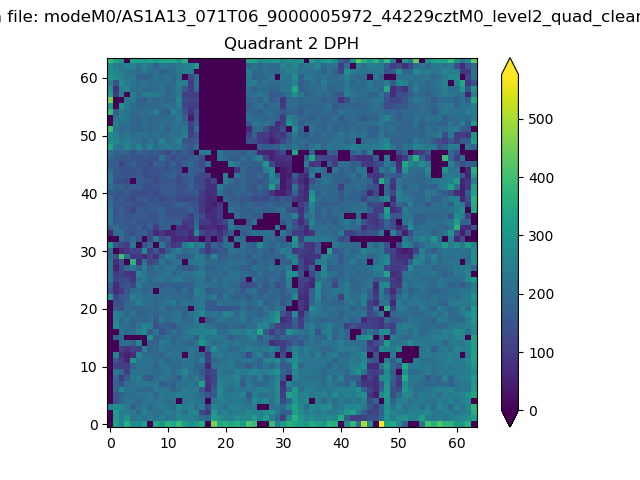 |
Quadrant C |
| Plot type | Count rate plots | Images |
|---|---|---|
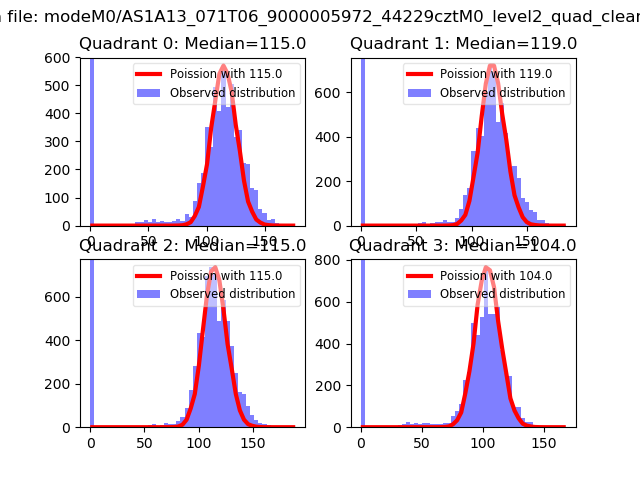
| Comparison with Poisson distribution Blue bars denote a histogram of data divided into 1 sec bins. Red curve is a Poisson curve with rate = median count rate of data. |
 |
 |
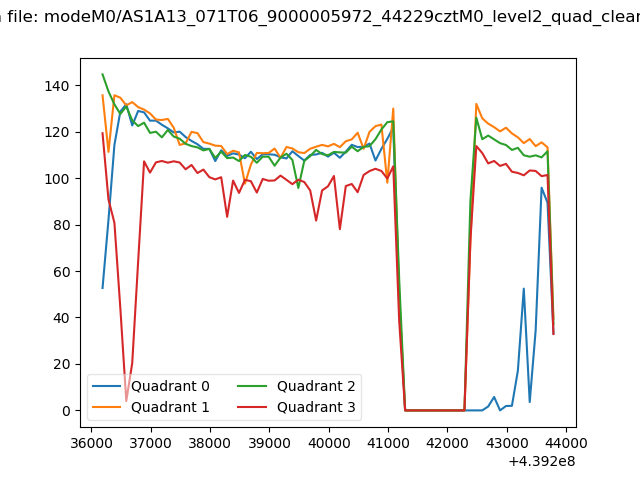
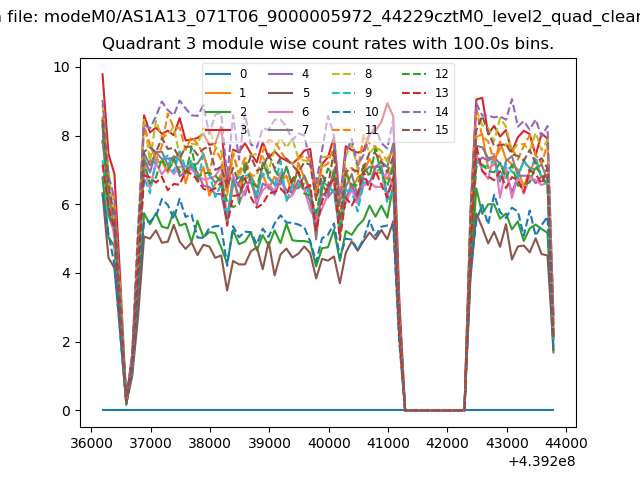
| Quadrant-wise count rates Data is divided into 100 sec bins |
 |
|
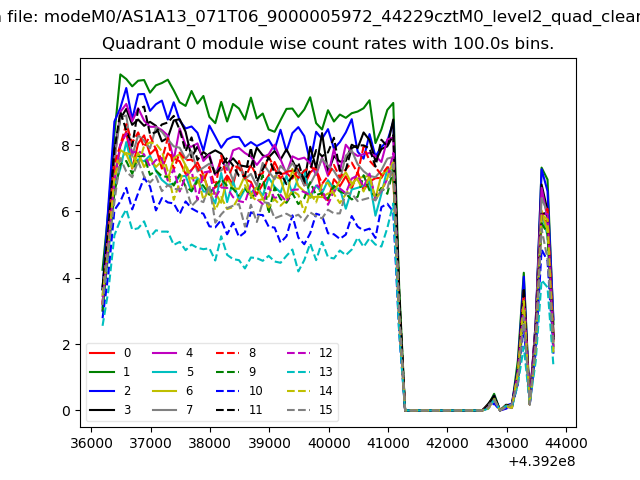
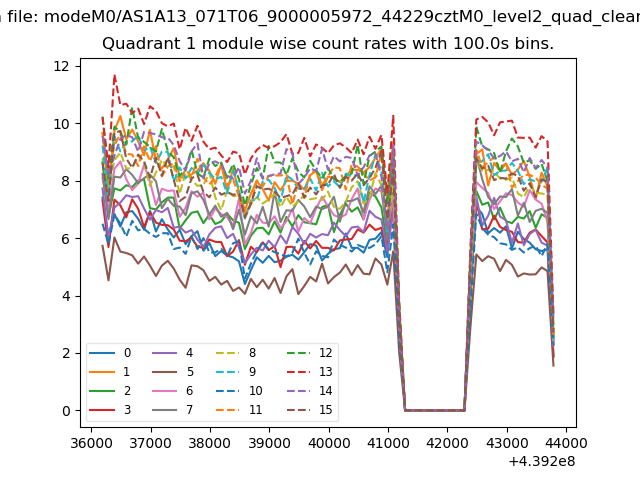
| Module-wise count rates for Quadrant A Data is divided into 100 sec bins |
 |
 |
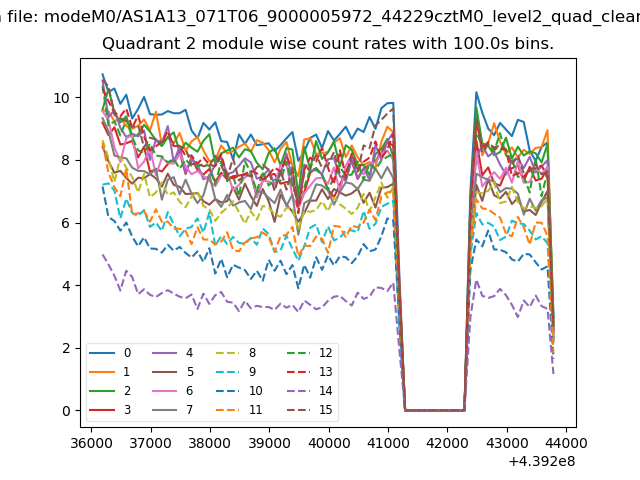
| Module-wise count rates for Quadrant B Data is divided into 100 sec bins |
 |
 |
| Module-wise count rates for Quadrant C Data is divided into 100 sec bins |
 |
 |
| Module-wise count rates for Quadrant D Data is divided into 100 sec bins |
 |
 |
| Parameter | Plot |
|---|---|
| CZT HV Monitor | 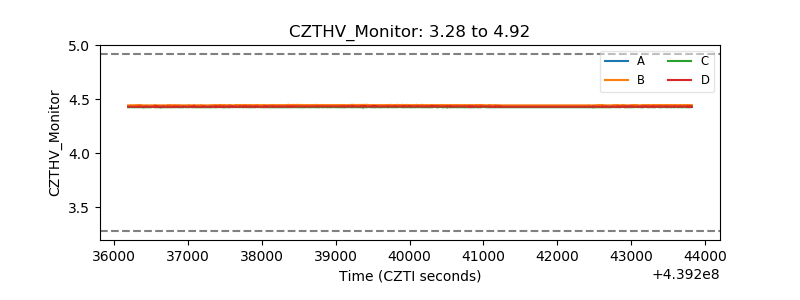 |
| D_VDD | 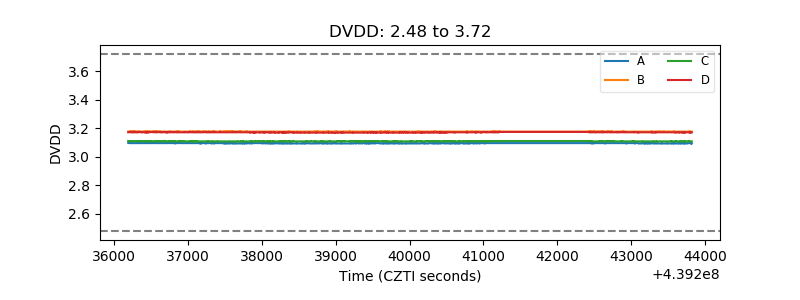 |
| Temperature 1 | 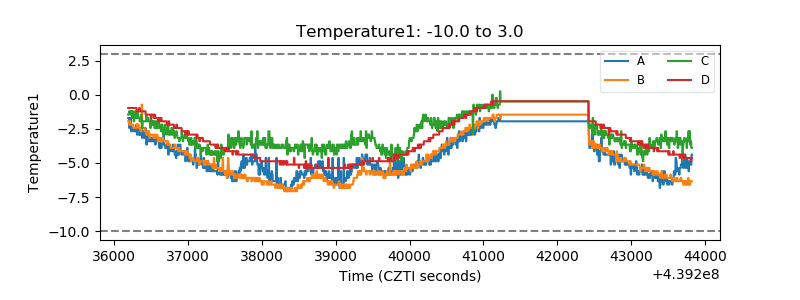 |
| Veto HV Monitor | 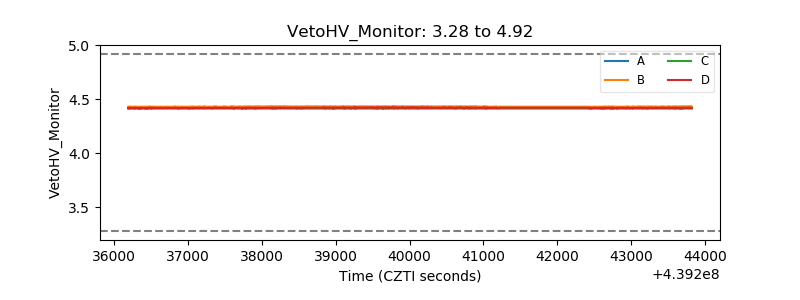 |
| Veto LLD | 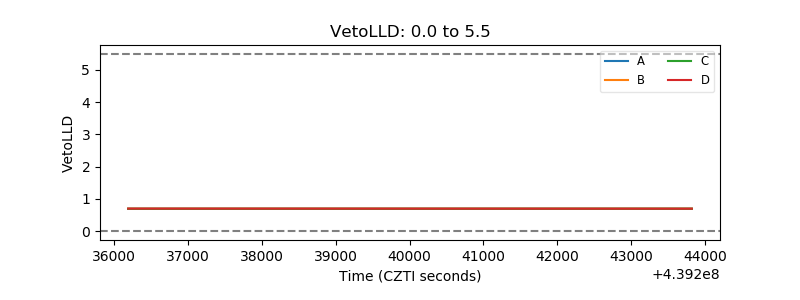 |
| Alpha Counter | 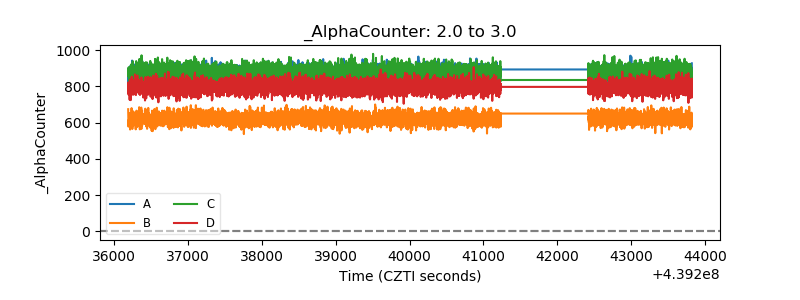 |
| _CPM_Rate | 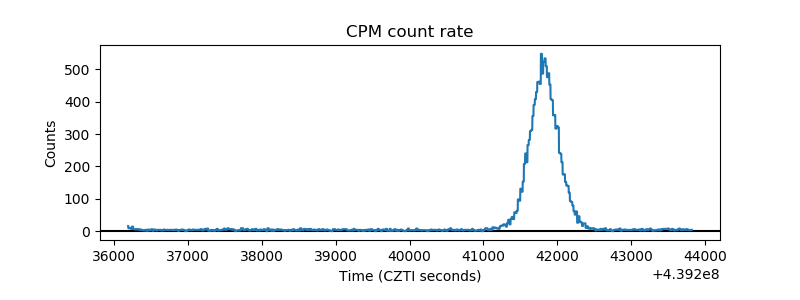 |
| CZT Counter | 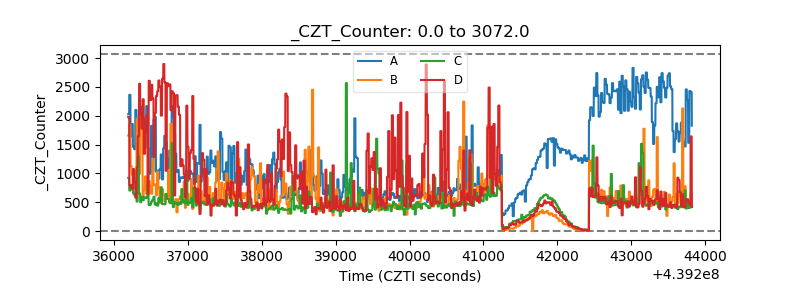 |
| +2.5 Volts monitor |  |
| +5 Volts monitor | 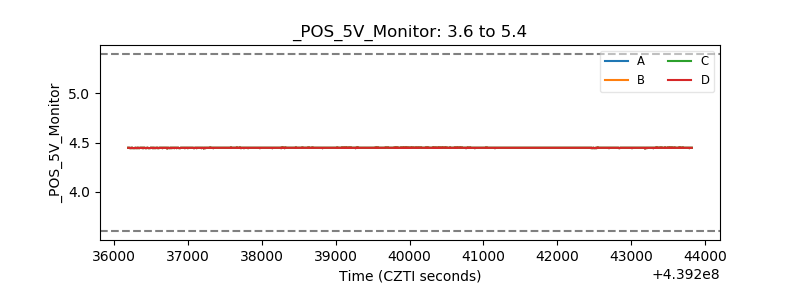 |
| _ROLL_ROT | 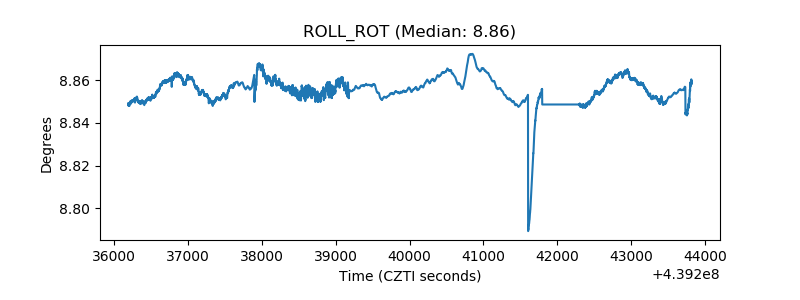 |
| _Roll_DEC | 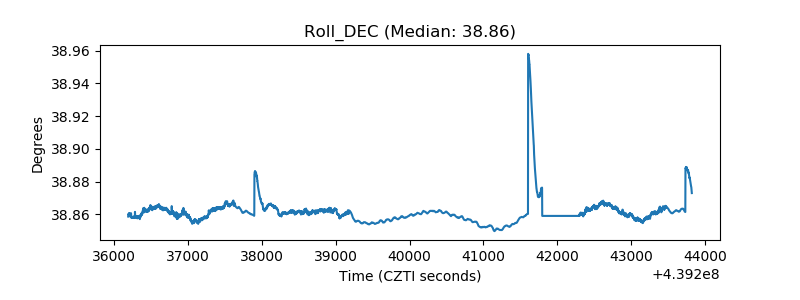 |
| _Roll_RA | 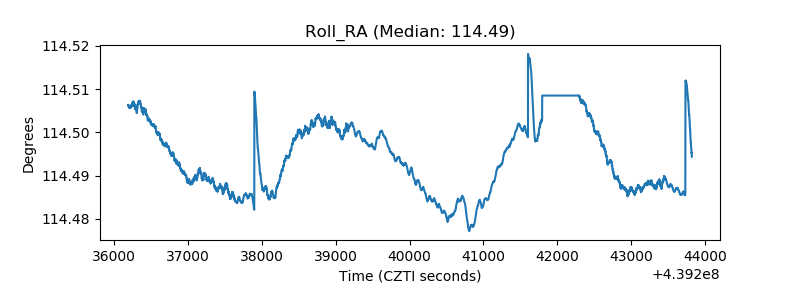 |
| Veto Counter | 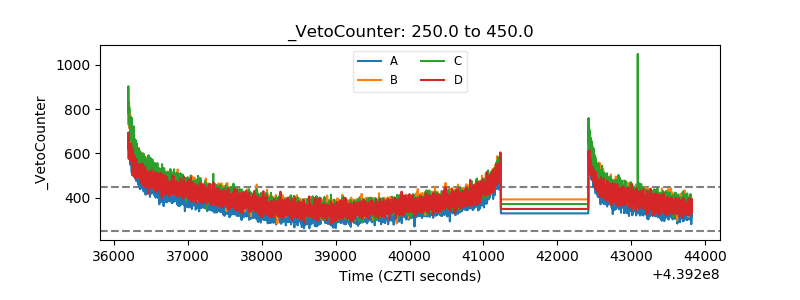 |