| Param | Original file | Final file |
|---|---|---|
| Filename | modeM0/AS1A13_071T06_9000005972_44230cztM0_level2.fits | modeM0/AS1A13_071T06_9000005972_44230cztM0_level2_quad_clean.evt |
| Size (bytes) | 610,024,320 | 105,223,680 |
| Size | 581.8 MB | 100.3 MB |
| Events in quadrant A | 10,167,976 | 538,342 |
| Events in quadrant B | 4,437,698 | 748,292 |
| Events in quadrant C | 3,409,381 | 744,460 |
| Events in quadrant D | 4,036,597 | 679,590 |
| Mode M0 | |||
|---|---|---|---|
| Quadrant | BADHDUFLAG | Total packets | Discarded packets |
| A | 0 | 35155 | 2 |
| B | 0 | 17855 | 2 |
| C | 0 | 15098 | 2 |
| D | 0 | 16915 | 2 |
| Mode SS | |||
|---|---|---|---|
| Quadrant | BADHDUFLAG | Total packets | Discarded packets |
| A | 0 | 138 | 0 |
| B | 0 | 138 | 0 |
| C | 0 | 138 | 0 |
| D | 0 | 138 | 0 |
| Mode M9 | |||
|---|---|---|---|
| Quadrant | BADHDUFLAG | Total packets | Discarded packets |
| A | 0 | 9 | 0 |
| B | 0 | 10 | 0 |
| C | 0 | 10 | 0 |
| D | 0 | 10 | 0 |
| Quadrant | Total seconds | Saturated seconds | Saturation percentage |
|---|---|---|---|
| A | 6824 | 2206 | 32.327081% |
| B | 6824 | 397 | 5.817702% |
| C | 6824 | 104 | 1.524033% |
| D | 6824 | 150 | 2.198124% |
Noise dominated data is calculated using 1-second bins in cleaned event files. If a bin has >2000 counts, and if more than 50% of those come from <1% of pixels, then it is considered to be noise-dominated and hence unusable.
| Quadrant | # 1 sec bins | Bins with >0 counts | Bins with >2000 counts | High rate bins dominated by noise | Noise dominated (total time) | Noise dominated (detector-on time) | Marked lightcurve |
|---|---|---|---|---|---|---|---|
| A | 7704 | 6825 | 1970 | 1970 | 25.57% | 28.86% | 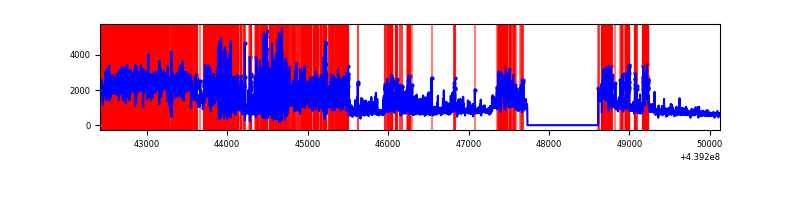 |
| B | 7704 | 6825 | 187 | 187 | 2.43% | 2.74% | 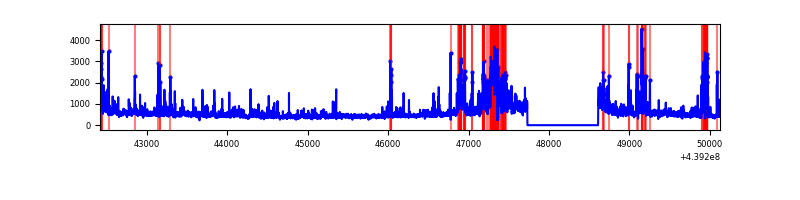 |
| C | 7704 | 6825 | 63 | 63 | 0.82% | 0.92% | 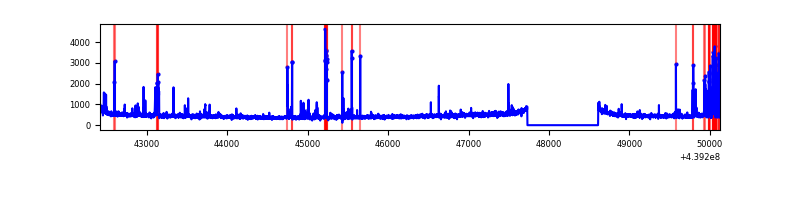 |
| D | 7704 | 6825 | 100 | 100 | 1.30% | 1.47% | 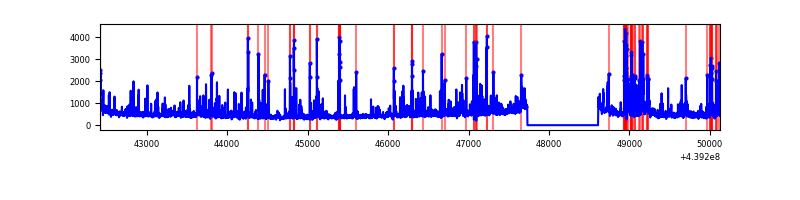 |
Top three noisy pixels from each quadrant. If the there are fewer than three noisy pixels in the level2.evt file, extra rows are filled as -1
| Pixel properties | Quadrant properties | ||||||
|---|---|---|---|---|---|---|---|
| Quadrant | DetID | PixID | Counts | Sigma | Mean | Median | Sigma |
| A | 15 | 223 | 6101883 | 43746.15 | 674 | 661 | 139.5 |
| A | 10 | 83 | 1415845 | 10146.96 | 674 | 661 | 139.5 |
| A | 2 | 79 | 20454 | 141.92 | 674 | 661 | 139.5 |
| B | 0 | 200 | 519489 | 3526.45 | 753 | 730 | 147.1 |
| B | 5 | 172 | 286315 | 1941.37 | 753 | 730 | 147.1 |
| B | 0 | 219 | 184040 | 1246.12 | 753 | 730 | 147.1 |
| C | 14 | 254 | 349646 | 1954.53 | 755 | 760 | 178.5 |
| C | 2 | 14 | 46864 | 258.28 | 755 | 760 | 178.5 |
| C | 3 | 233 | 30971 | 169.25 | 755 | 760 | 178.5 |
| D | 13 | 249 | 442172 | 2348.78 | 748 | 726 | 187.9 |
| D | 5 | 222 | 213156 | 1130.27 | 748 | 726 | 187.9 |
| D | 1 | 52 | 165709 | 877.82 | 748 | 726 | 187.9 |
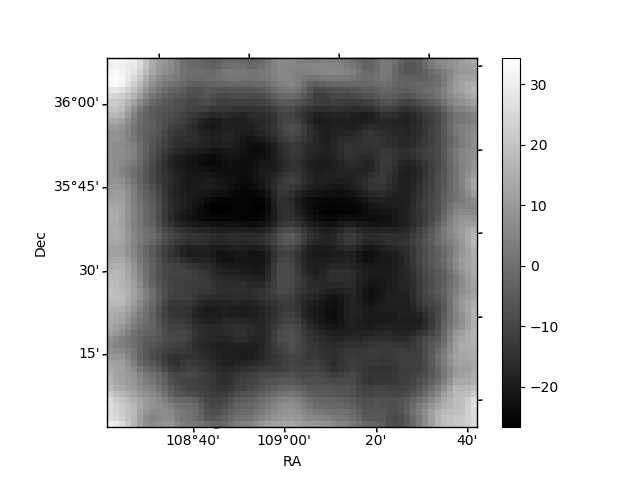
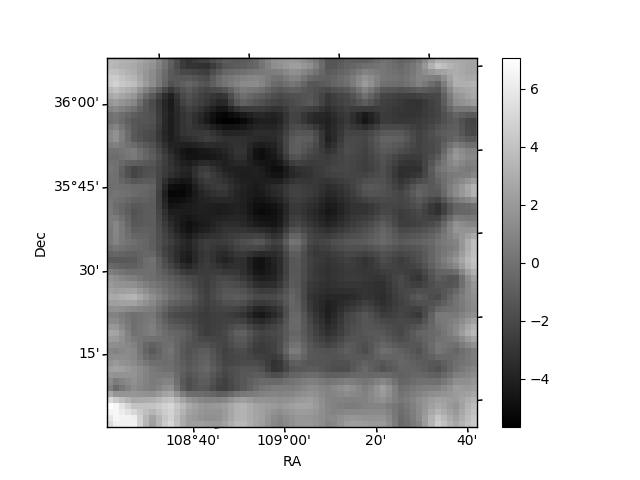
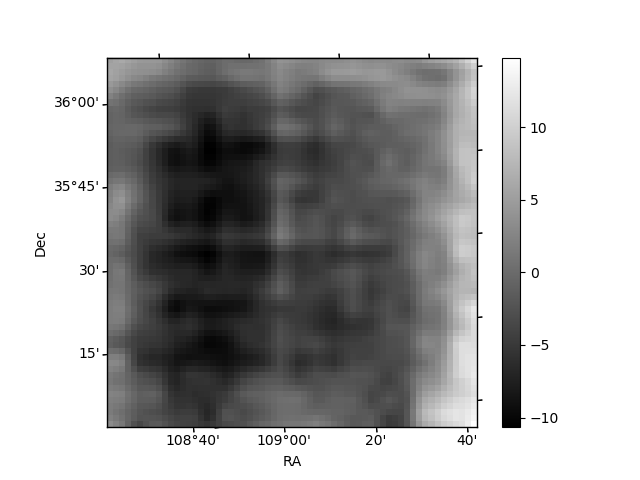
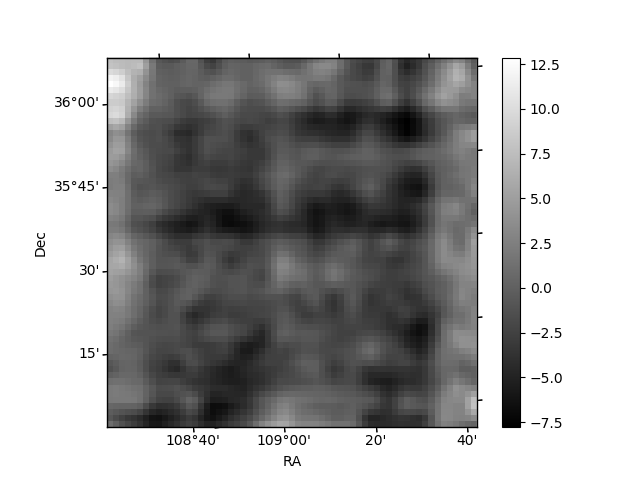
Histogram calculated using DETX and DETY for each event in the final _common_clean file
| Quadrant A | 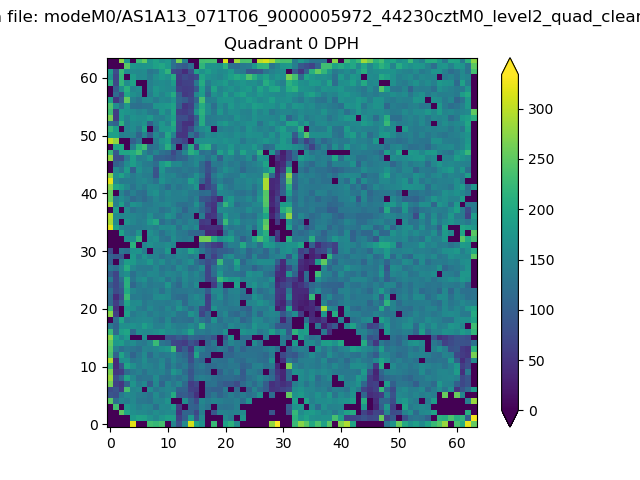 |
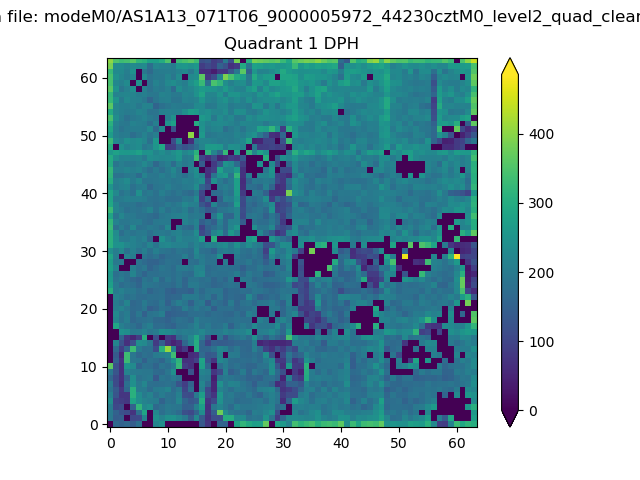 |
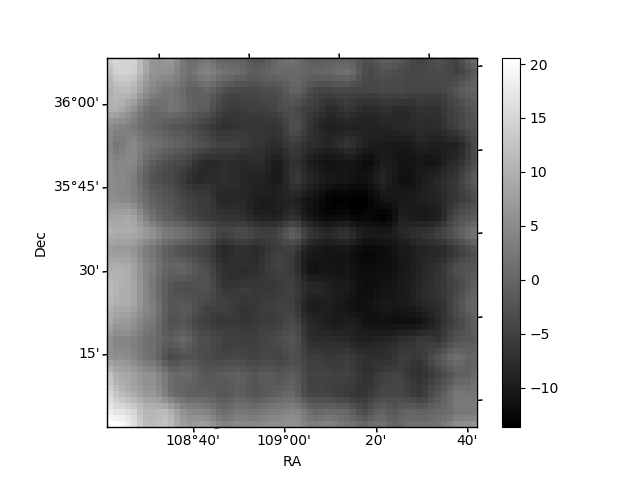
Quadrant B |
|---|---|---|---|
| Quadrant D | 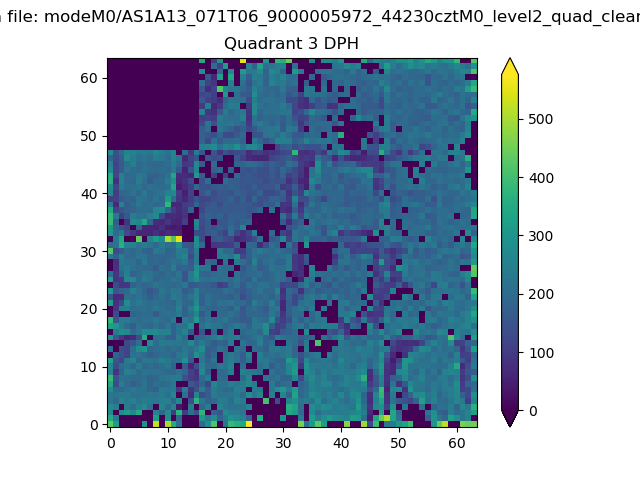 |
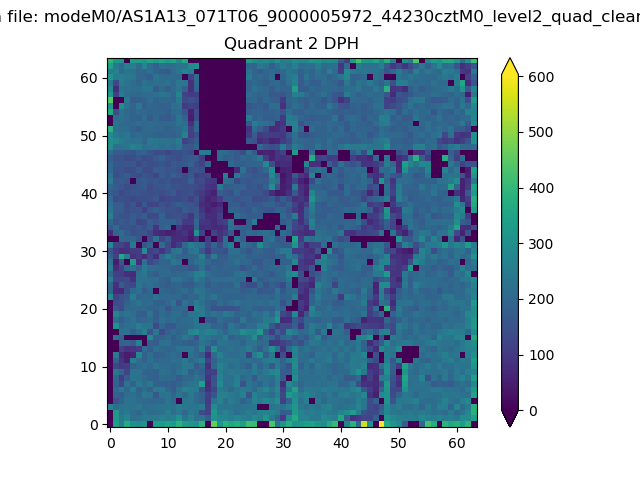 |
Quadrant C |
| Plot type | Count rate plots | Images |
|---|---|---|
| Comparison with Poisson distribution Blue bars denote a histogram of data divided into 1 sec bins. Red curve is a Poisson curve with rate = median count rate of data. |
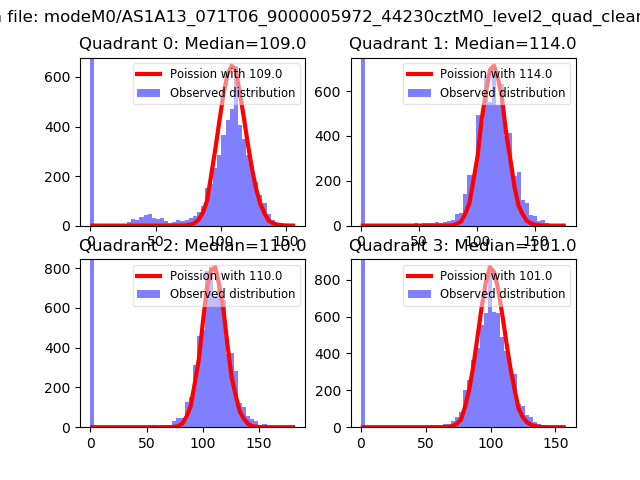 |
 |
| Quadrant-wise count rates Data is divided into 100 sec bins |
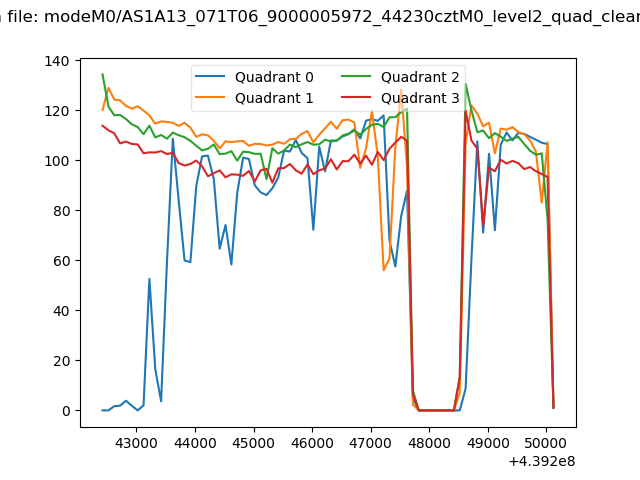 |
|
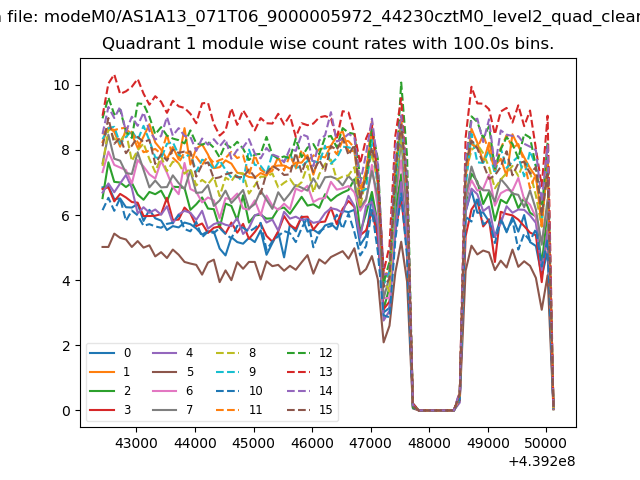
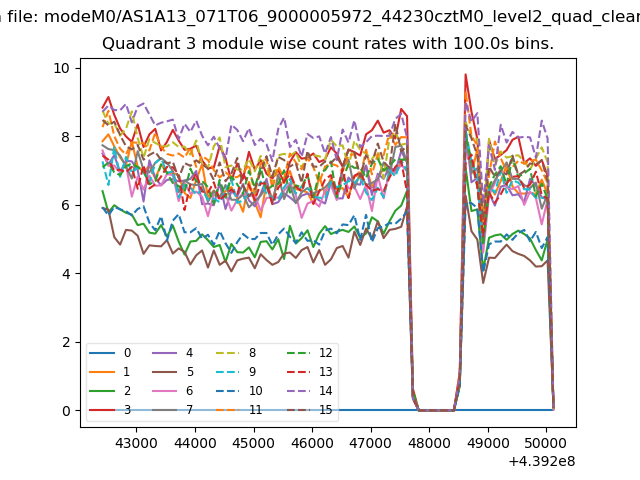
| Module-wise count rates for Quadrant A Data is divided into 100 sec bins |
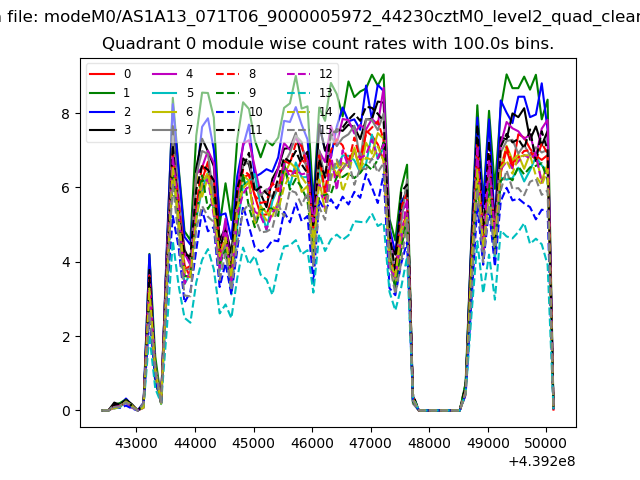 |
 |
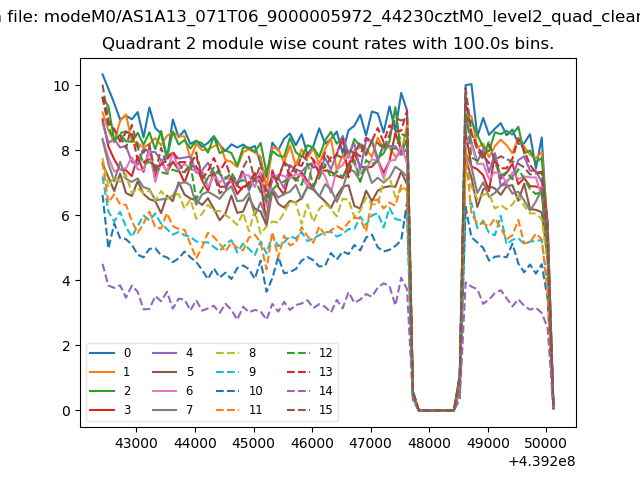
| Module-wise count rates for Quadrant B Data is divided into 100 sec bins |
 |
 |
| Module-wise count rates for Quadrant C Data is divided into 100 sec bins |
 |
 |
| Module-wise count rates for Quadrant D Data is divided into 100 sec bins |
 |
 |
| Parameter | Plot |
|---|---|
| CZT HV Monitor | 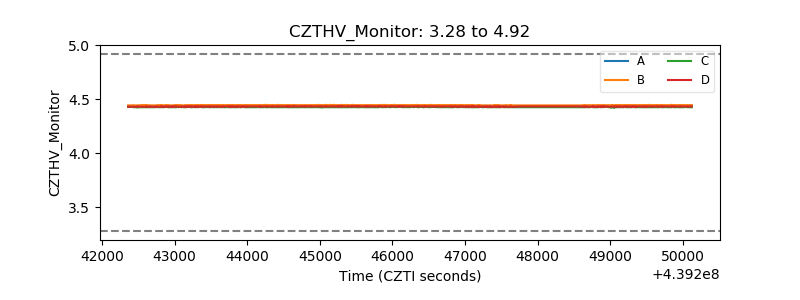 |
| D_VDD | 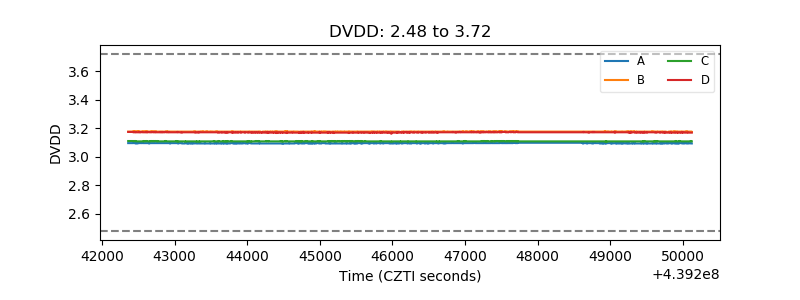 |
| Temperature 1 | 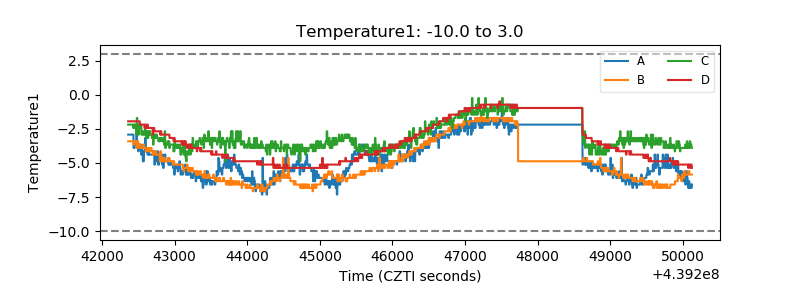 |
| Veto HV Monitor | 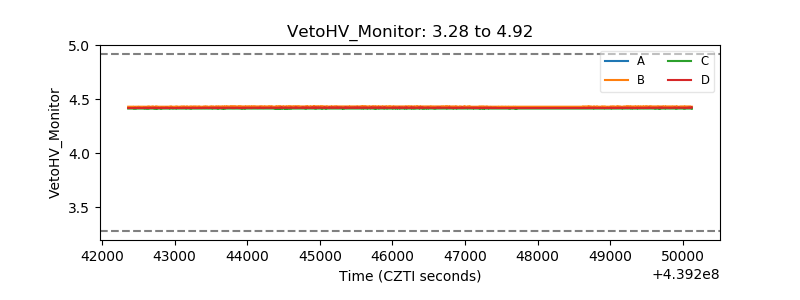 |
| Veto LLD | 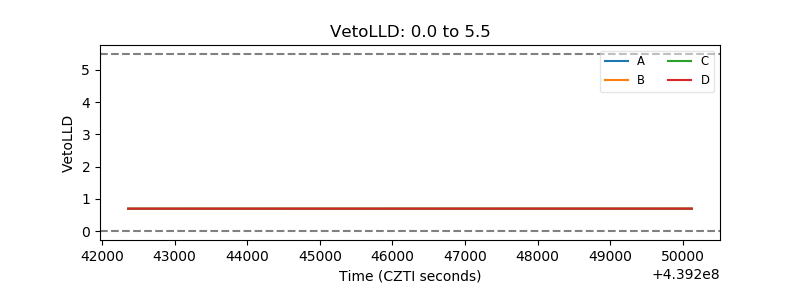 |
| Alpha Counter | 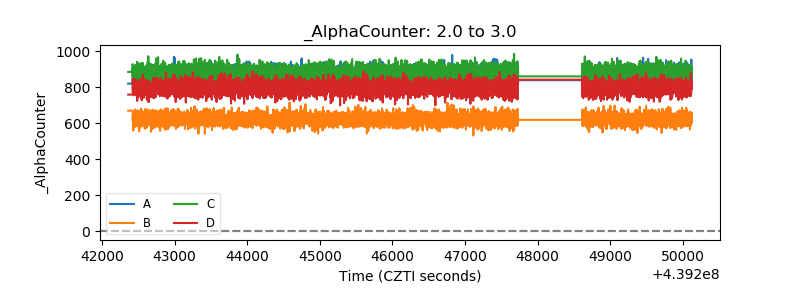 |
| _CPM_Rate | 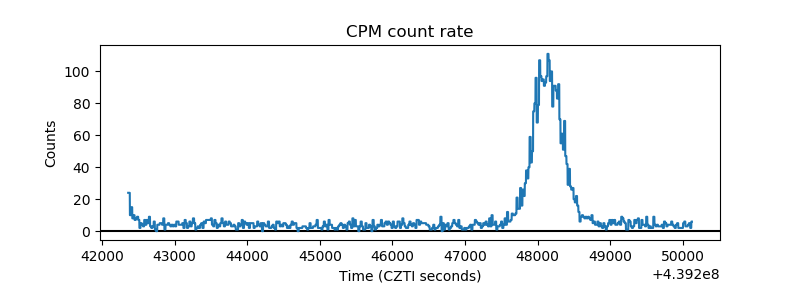 |
| CZT Counter | 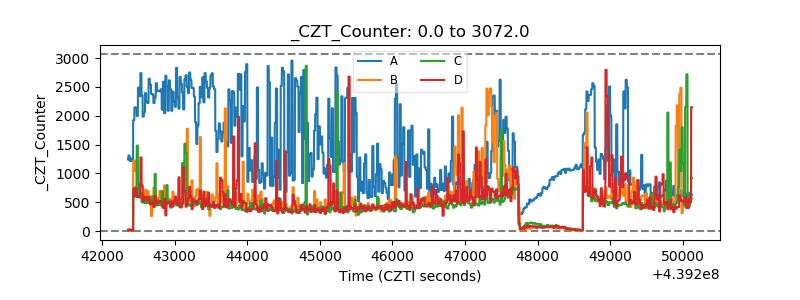 |
| +2.5 Volts monitor | 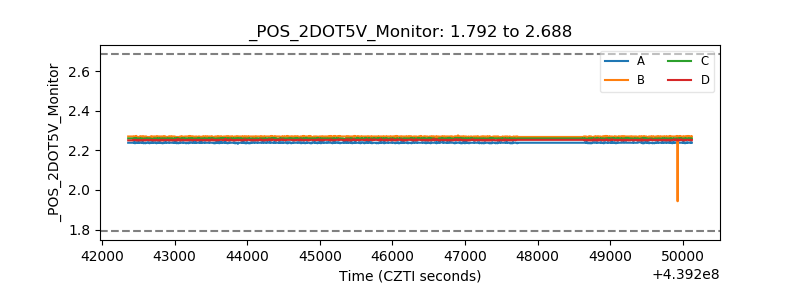 |
| +5 Volts monitor | 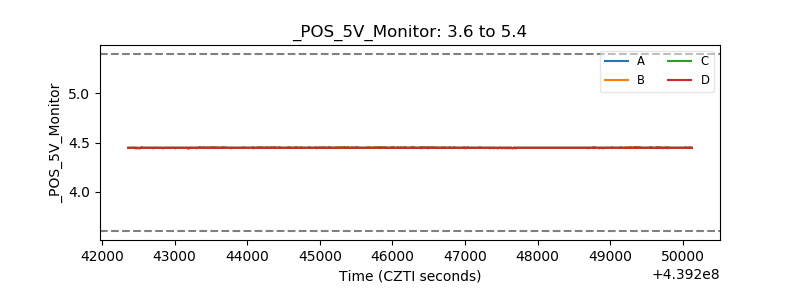 |
| _ROLL_ROT | 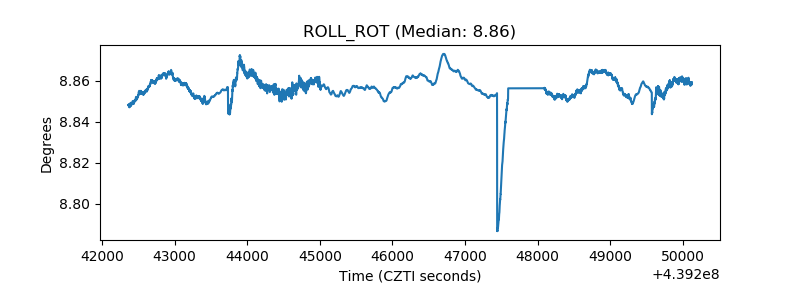 |
| _Roll_DEC | 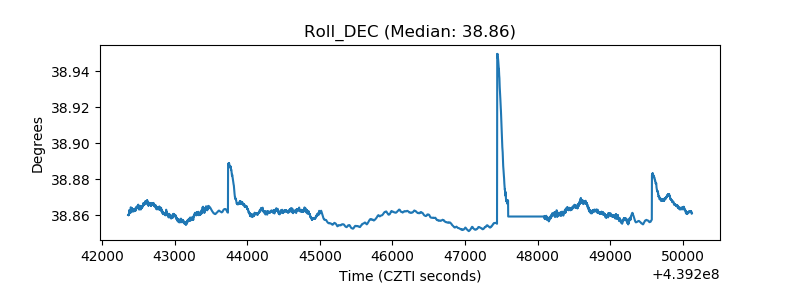 |
| _Roll_RA | 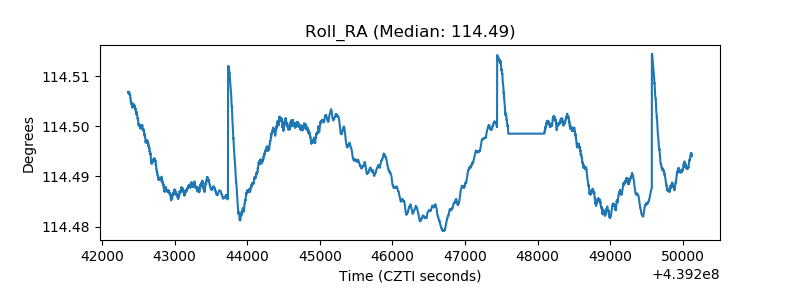 |
| Veto Counter | 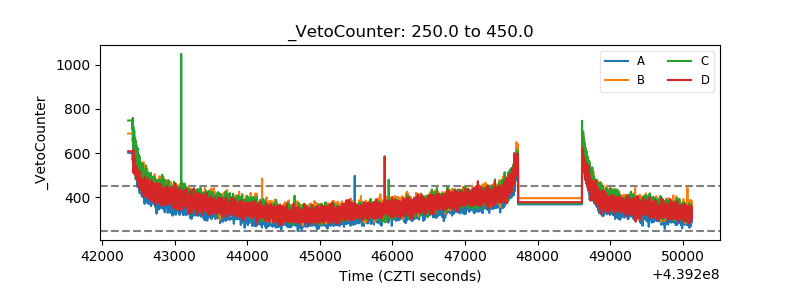 |