| Param | Original file | Final file |
|---|---|---|
| Filename | modeM0/AS1A13_074T01_9000005974_44232cztM0_level2.fits | modeM0/AS1A13_074T01_9000005974_44232cztM0_level2_quad_clean.evt |
| Size (bytes) | 769,533,120 | 119,520,000 |
| Size | 733.9 MB | 114.0 MB |
| Events in quadrant A | 12,035,705 | 615,206 |
| Events in quadrant B | 4,444,127 | 881,793 |
| Events in quadrant C | 4,038,780 | 839,487 |
| Events in quadrant D | 7,340,942 | 719,851 |
| Mode M9 | |||
|---|---|---|---|
| Quadrant | BADHDUFLAG | Total packets | Discarded packets |
| A | 0 | 1 | 0 |
| B | 0 | 2 | 0 |
| C | 0 | 2 | 0 |
| D | 0 | 2 | 0 |
| Mode SS | |||
|---|---|---|---|
| Quadrant | BADHDUFLAG | Total packets | Discarded packets |
| A | 0 | 162 | 0 |
| B | 0 | 162 | 0 |
| C | 0 | 162 | 0 |
| D | 0 | 162 | 0 |
| Mode M0 | |||
|---|---|---|---|
| Quadrant | BADHDUFLAG | Total packets | Discarded packets |
| A | 0 | 41418 | 1 |
| B | 0 | 18602 | 1 |
| C | 0 | 17988 | 1 |
| D | 0 | 27472 | 2 |
| Quadrant | Total seconds | Saturated seconds | Saturation percentage |
|---|---|---|---|
| A | 8086 | 2686 | 33.217907% |
| B | 8086 | 129 | 1.595350% |
| C | 8086 | 81 | 1.001731% |
| D | 8085 | 734 | 9.078541% |
Noise dominated data is calculated using 1-second bins in cleaned event files. If a bin has >2000 counts, and if more than 50% of those come from <1% of pixels, then it is considered to be noise-dominated and hence unusable.
| Quadrant | # 1 sec bins | Bins with >0 counts | Bins with >2000 counts | High rate bins dominated by noise | Noise dominated (total time) | Noise dominated (detector-on time) | Marked lightcurve |
|---|---|---|---|---|---|---|---|
| A | 8087 | 8087 | 2234 | 2234 | 27.62% | 27.62% | 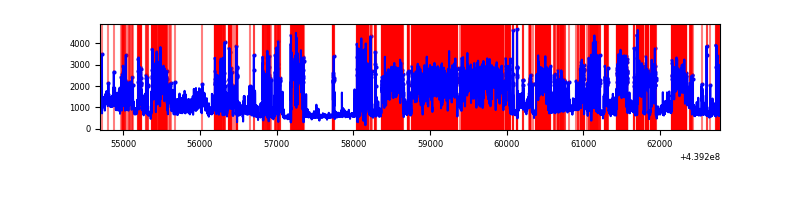 |
| B | 8087 | 8087 | 43 | 43 | 0.53% | 0.53% | 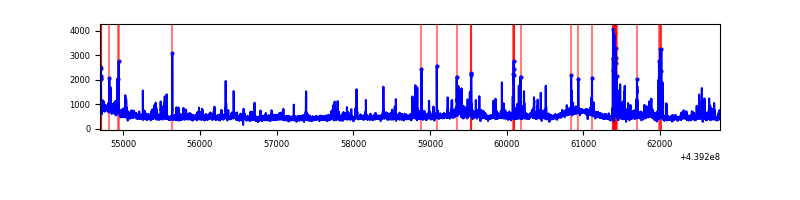 |
| C | 8087 | 8087 | 43 | 43 | 0.53% | 0.53% | 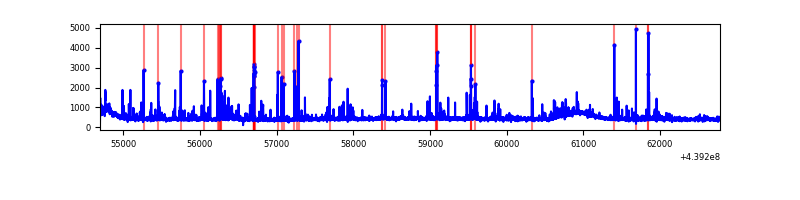 |
| D | 8086 | 8086 | 716 | 716 | 8.85% | 8.85% | 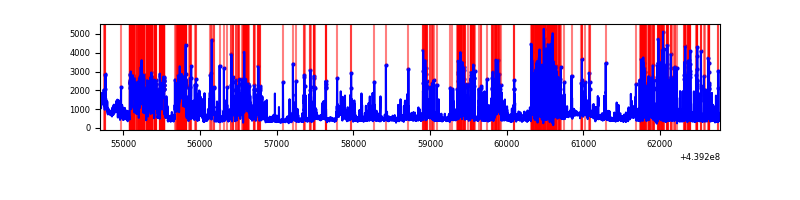 |
Top three noisy pixels from each quadrant. If the there are fewer than three noisy pixels in the level2.evt file, extra rows are filled as -1
| Pixel properties | Quadrant properties | ||||||
|---|---|---|---|---|---|---|---|
| Quadrant | DetID | PixID | Counts | Sigma | Mean | Median | Sigma |
| A | 15 | 223 | 6821787 | 40629.87 | 810 | 793 | 167.9 |
| A | 10 | 83 | 1540543 | 9171.66 | 810 | 793 | 167.9 |
| A | 7 | 16 | 401659 | 2387.79 | 810 | 793 | 167.9 |
| B | 5 | 172 | 172892 | 955.56 | 906 | 878 | 180.0 |
| B | 5 | 255 | 153049 | 845.33 | 906 | 878 | 180.0 |
| B | 0 | 155 | 100796 | 555.06 | 906 | 878 | 180.0 |
| C | 14 | 254 | 327773 | 1543.8 | 893 | 898 | 211.7 |
| C | 4 | 254 | 184697 | 868.07 | 893 | 898 | 211.7 |
| C | 3 | 233 | 17333 | 77.62 | 893 | 898 | 211.7 |
| D | 1 | 52 | 2226403 | 10064.69 | 864 | 837 | 221.1 |
| D | 13 | 249 | 701187 | 3167.2 | 864 | 837 | 221.1 |
| D | 14 | 35 | 435880 | 1967.4 | 864 | 837 | 221.1 |
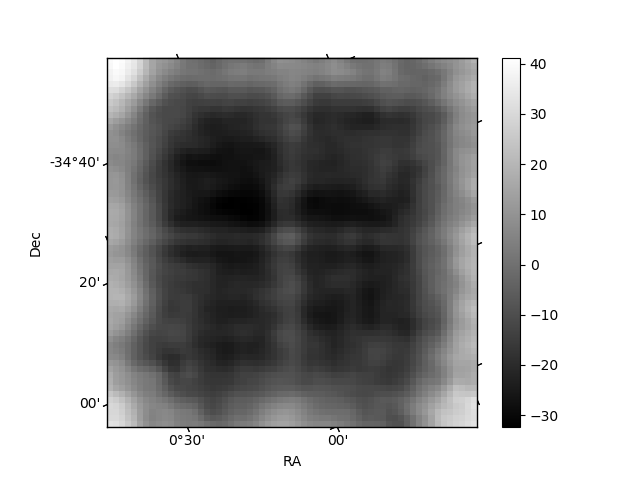
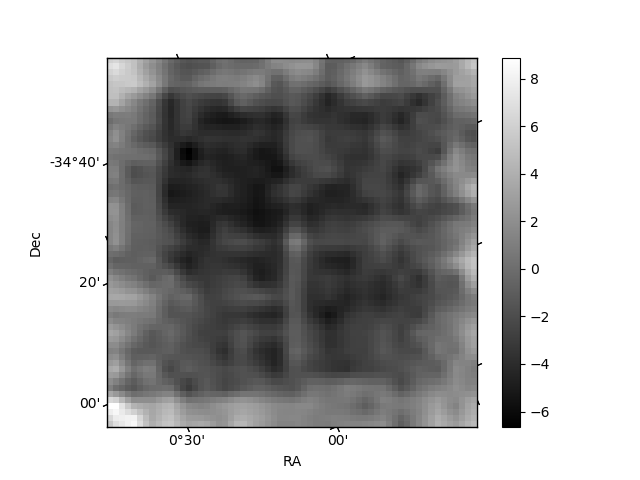
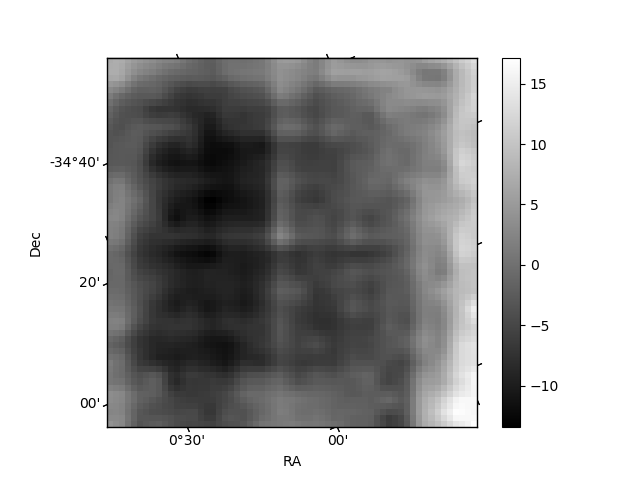
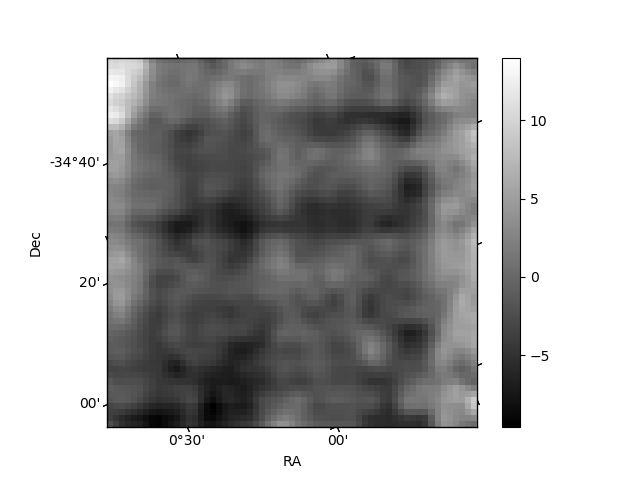
Histogram calculated using DETX and DETY for each event in the final _common_clean file
| Quadrant A | 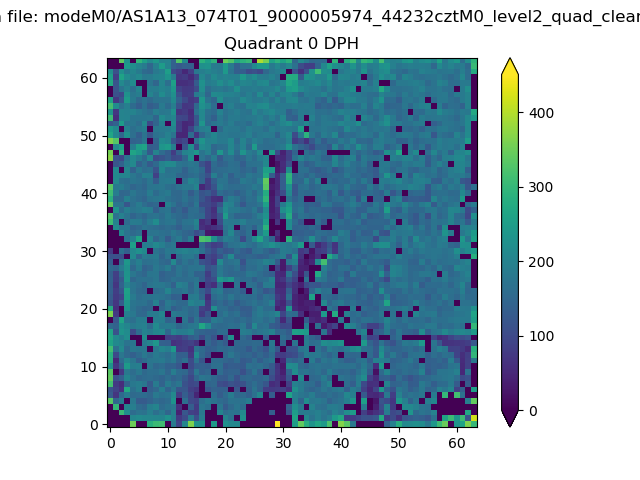 |
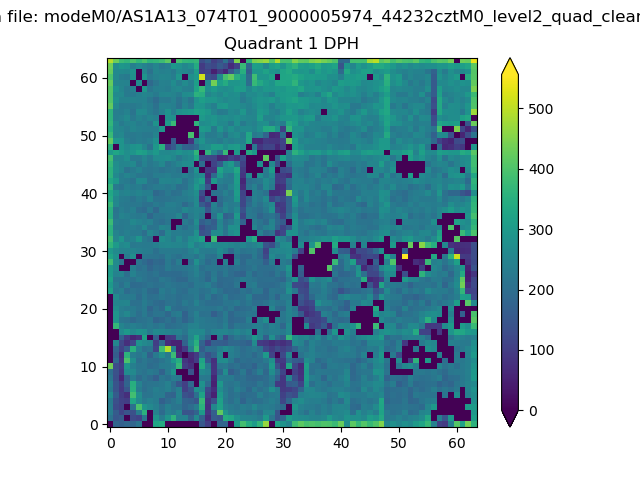 |
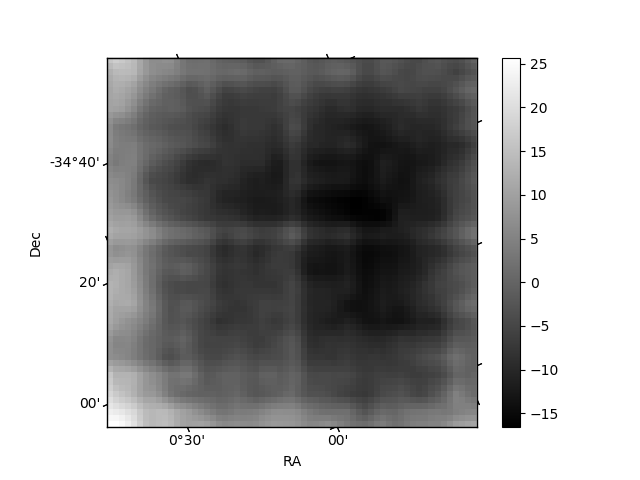
Quadrant B |
|---|---|---|---|
| Quadrant D | 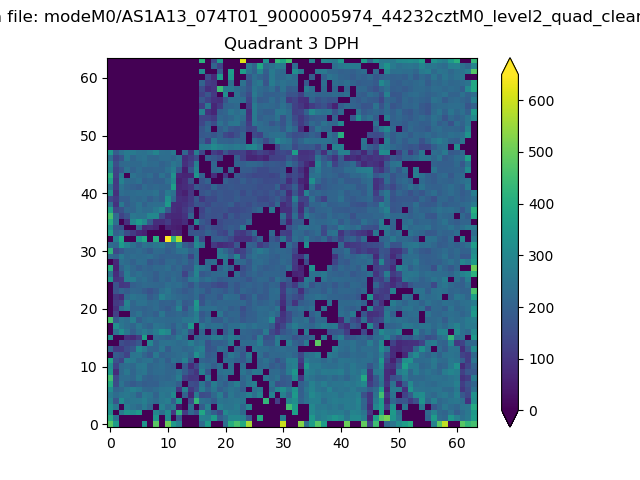 |
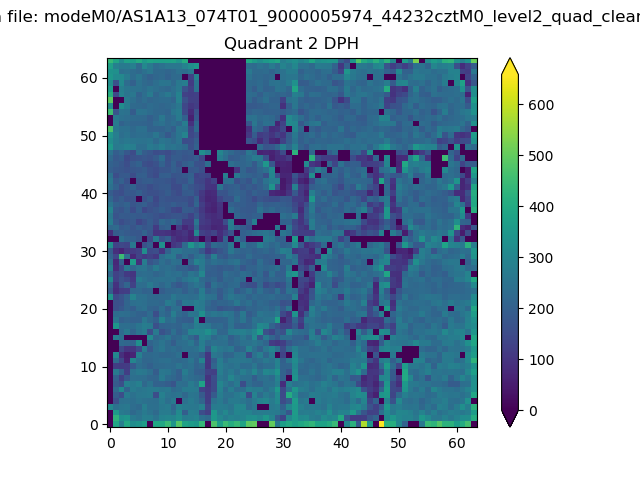 |
Quadrant C |
| Plot type | Count rate plots | Images |
|---|---|---|
| Comparison with Poisson distribution Blue bars denote a histogram of data divided into 1 sec bins. Red curve is a Poisson curve with rate = median count rate of data. |
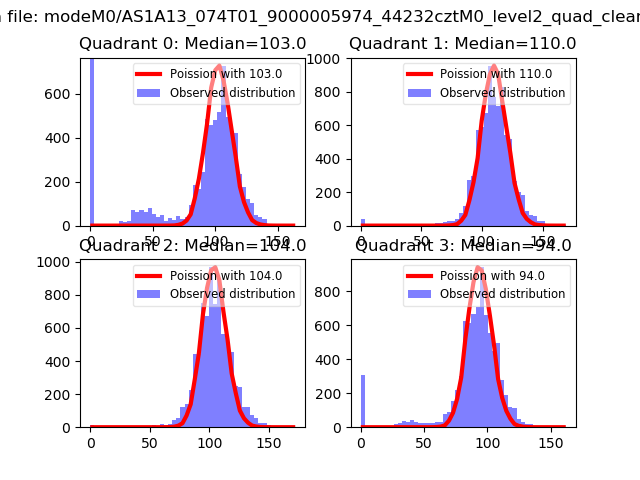 |
 |
| Quadrant-wise count rates Data is divided into 100 sec bins |
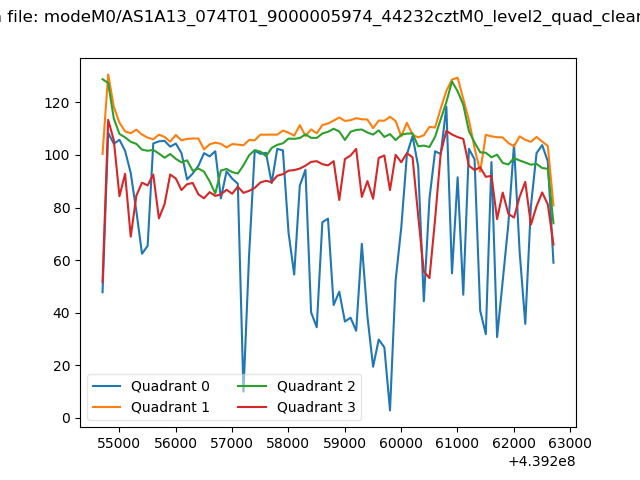 |
|
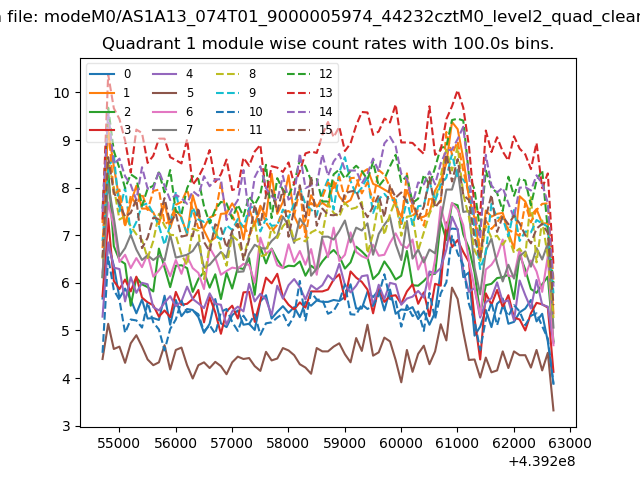
| Module-wise count rates for Quadrant A Data is divided into 100 sec bins |
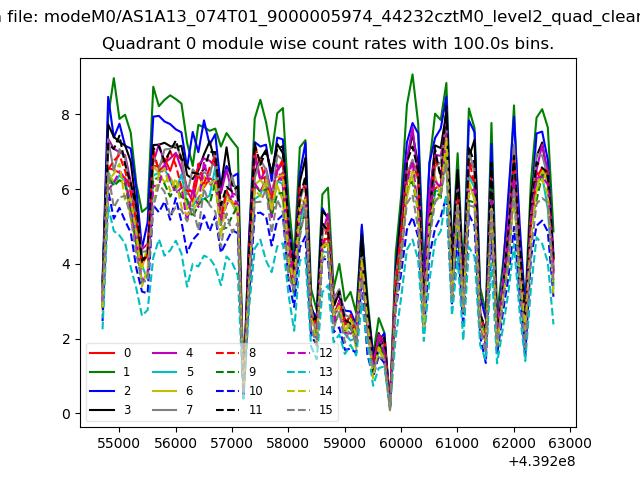 |
 |
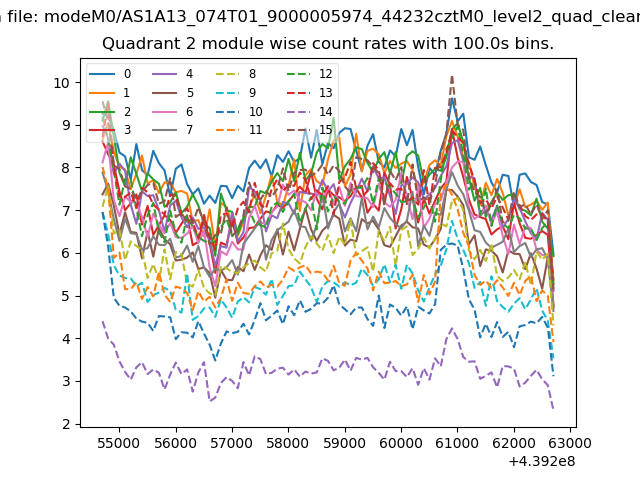
| Module-wise count rates for Quadrant B Data is divided into 100 sec bins |
 |
 |
| Module-wise count rates for Quadrant C Data is divided into 100 sec bins |
 |
 |
| Module-wise count rates for Quadrant D Data is divided into 100 sec bins |
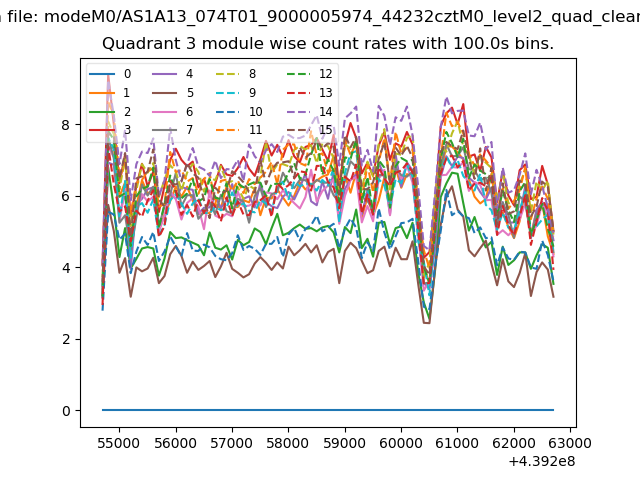 |
 |
| Parameter | Plot |
|---|---|
| CZT HV Monitor | 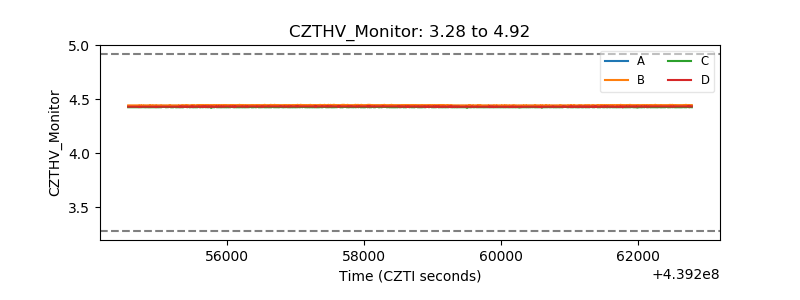 |
| D_VDD | 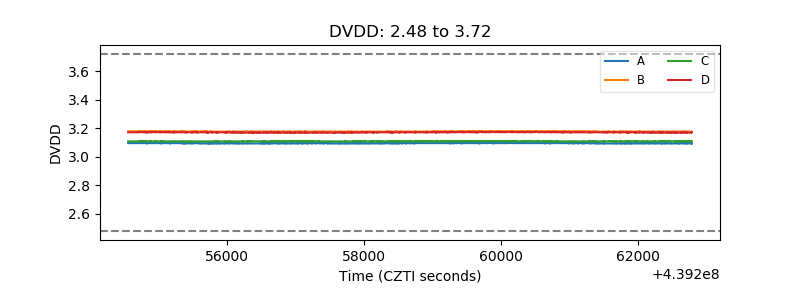 |
| Temperature 1 | 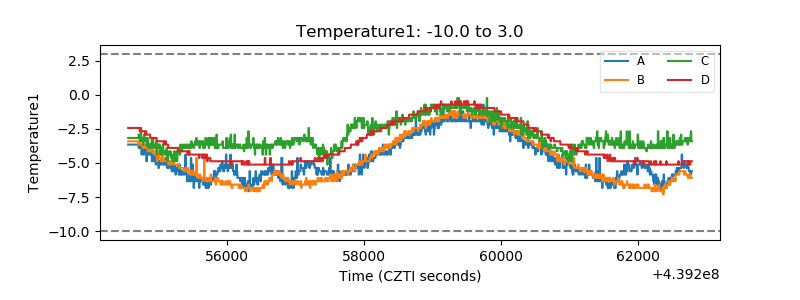 |
| Veto HV Monitor |  |
| Veto LLD | 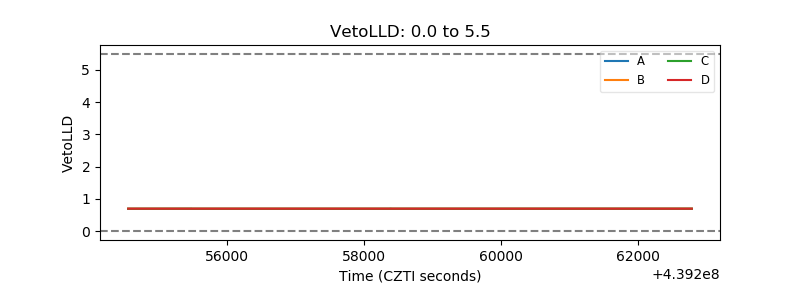 |
| Alpha Counter | 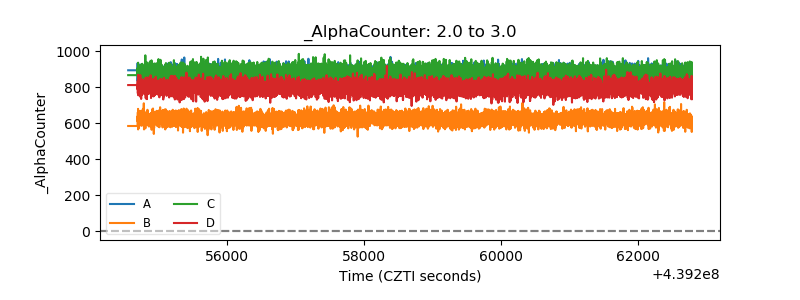 |
| _CPM_Rate | 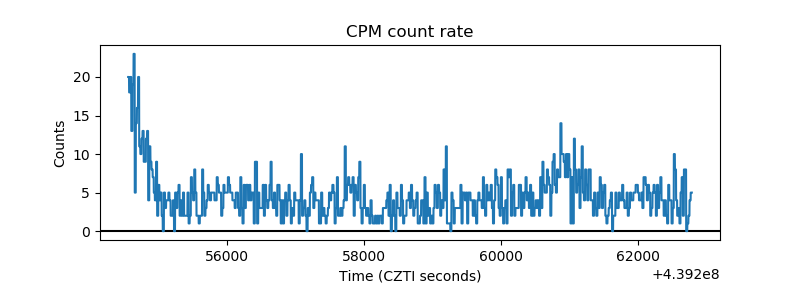 |
| CZT Counter | 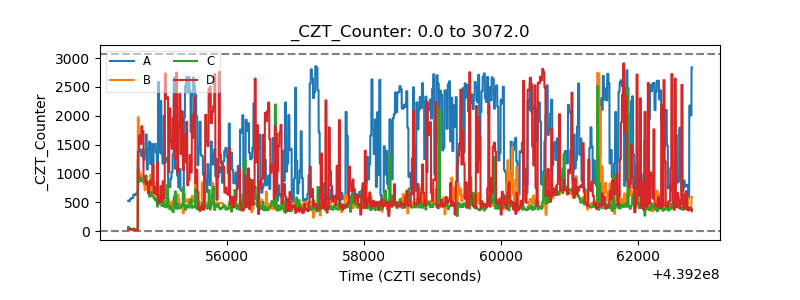 |
| +2.5 Volts monitor | 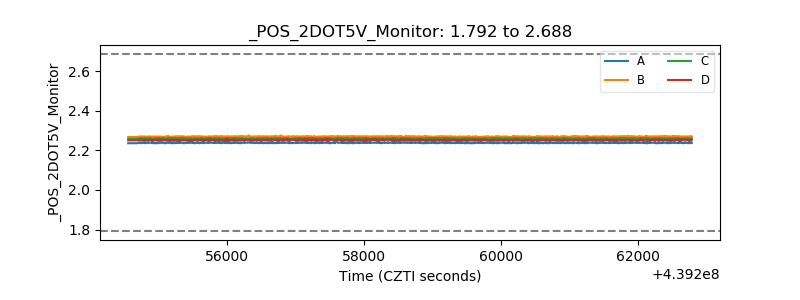 |
| +5 Volts monitor | 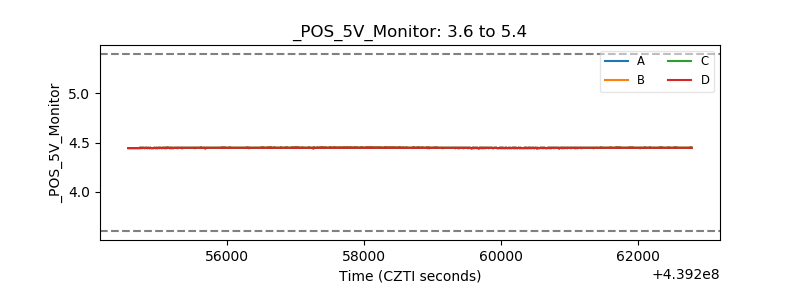 |
| _ROLL_ROT | 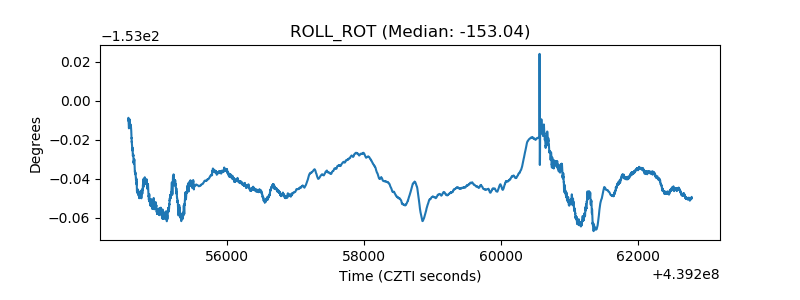 |
| _Roll_DEC | 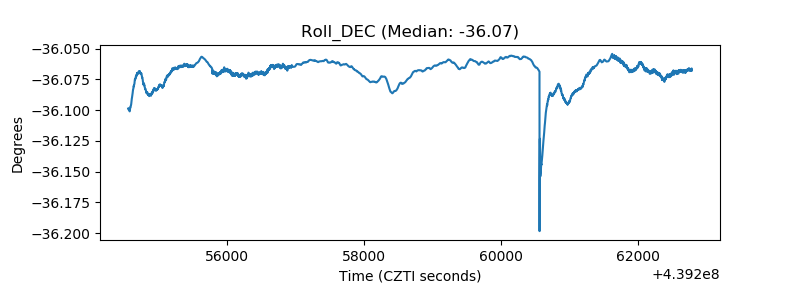 |
| _Roll_RA | 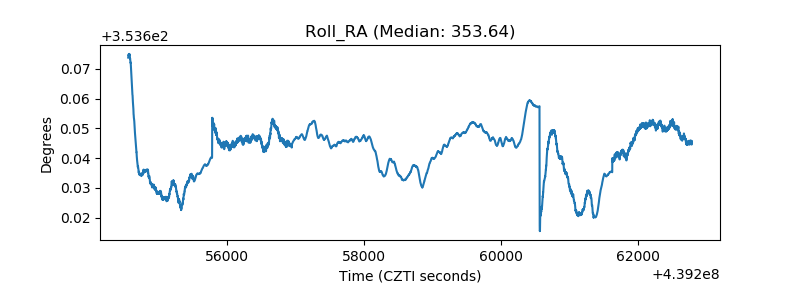 |
| Veto Counter | 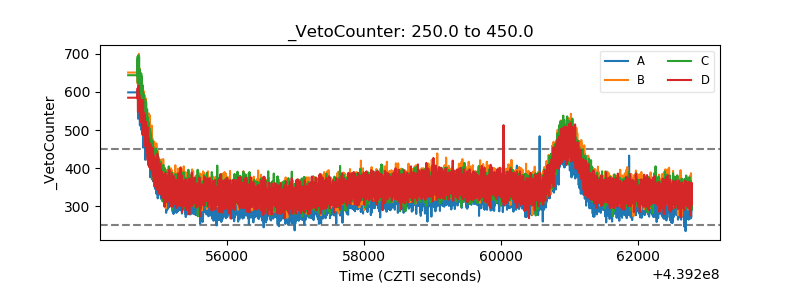 |