| Param | Original file | Final file |
|---|---|---|
| Filename | modeM0/AS1A13_074T01_9000005974_44233cztM0_level2.fits | modeM0/AS1A13_074T01_9000005974_44233cztM0_level2_quad_clean.evt |
| Size (bytes) | 572,780,160 | 108,590,400 |
| Size | 546.2 MB | 103.6 MB |
| Events in quadrant A | 7,495,432 | 677,302 |
| Events in quadrant B | 3,953,274 | 781,164 |
| Events in quadrant C | 4,327,719 | 668,934 |
| Events in quadrant D | 4,865,212 | 657,566 |
| Mode SS | |||
|---|---|---|---|
| Quadrant | BADHDUFLAG | Total packets | Discarded packets |
| A | 0 | 144 | 0 |
| B | 0 | 144 | 0 |
| C | 0 | 144 | 0 |
| D | 0 | 144 | 0 |
| Mode M0 | |||
|---|---|---|---|
| Quadrant | BADHDUFLAG | Total packets | Discarded packets |
| A | 0 | 27808 | 0 |
| B | 0 | 16621 | 0 |
| C | 0 | 18199 | 0 |
| D | 0 | 19513 | 0 |
| Quadrant | Total seconds | Saturated seconds | Saturation percentage |
|---|---|---|---|
| A | 7223 | 996 | 13.789284% |
| B | 7223 | 77 | 1.066039% |
| C | 7224 | 734 | 10.160576% |
| D | 7223 | 363 | 5.025613% |
Noise dominated data is calculated using 1-second bins in cleaned event files. If a bin has >2000 counts, and if more than 50% of those come from <1% of pixels, then it is considered to be noise-dominated and hence unusable.
| Quadrant | # 1 sec bins | Bins with >0 counts | Bins with >2000 counts | High rate bins dominated by noise | Noise dominated (total time) | Noise dominated (detector-on time) | Marked lightcurve |
|---|---|---|---|---|---|---|---|
| A | 7223 | 7223 | 843 | 843 | 11.67% | 11.67% | 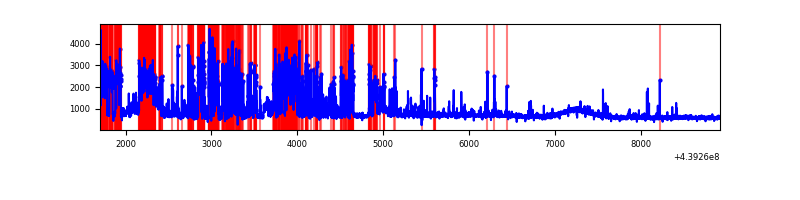 |
| B | 7223 | 7223 | 34 | 34 | 0.47% | 0.47% | 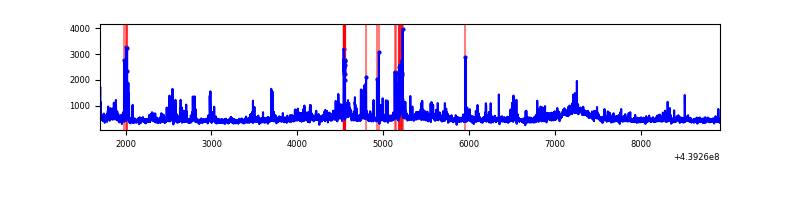 |
| C | 7224 | 7224 | 344 | 344 | 4.76% | 4.76% | 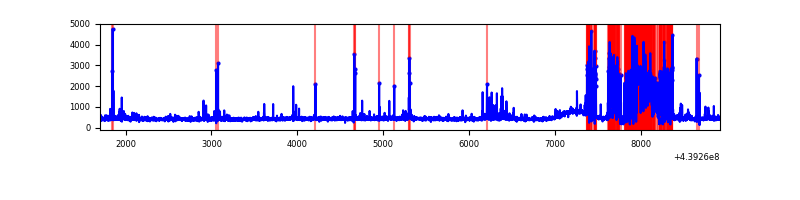 |
| D | 7223 | 7223 | 301 | 301 | 4.17% | 4.17% | 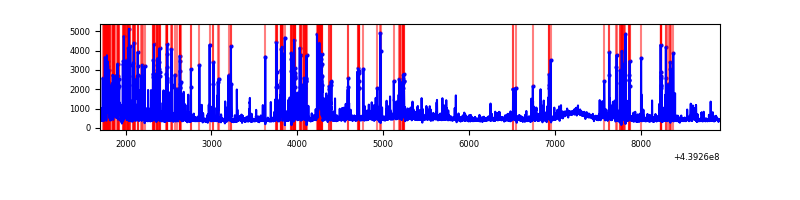 |
Top three noisy pixels from each quadrant. If the there are fewer than three noisy pixels in the level2.evt file, extra rows are filled as -1
| Pixel properties | Quadrant properties | ||||||
|---|---|---|---|---|---|---|---|
| Quadrant | DetID | PixID | Counts | Sigma | Mean | Median | Sigma |
| A | 15 | 223 | 3031558 | 18996.16 | 765 | 749 | 159.5 |
| A | 10 | 83 | 1422839 | 8913.21 | 765 | 749 | 159.5 |
| A | 7 | 3 | 40966 | 252.07 | 765 | 749 | 159.5 |
| B | 0 | 219 | 174917 | 1087.56 | 798 | 773 | 160.1 |
| B | 5 | 255 | 161963 | 1006.66 | 798 | 773 | 160.1 |
| B | 0 | 155 | 129932 | 806.62 | 798 | 773 | 160.1 |
| C | 14 | 254 | 1420442 | 8308.87 | 721 | 726 | 170.9 |
| C | 4 | 254 | 46808 | 269.69 | 721 | 726 | 170.9 |
| C | 3 | 233 | 28875 | 164.74 | 721 | 726 | 170.9 |
| D | 13 | 249 | 1000688 | 5054.74 | 769 | 742 | 197.8 |
| D | 1 | 52 | 345631 | 1743.42 | 769 | 742 | 197.8 |
| D | 14 | 210 | 115029 | 577.72 | 769 | 742 | 197.8 |
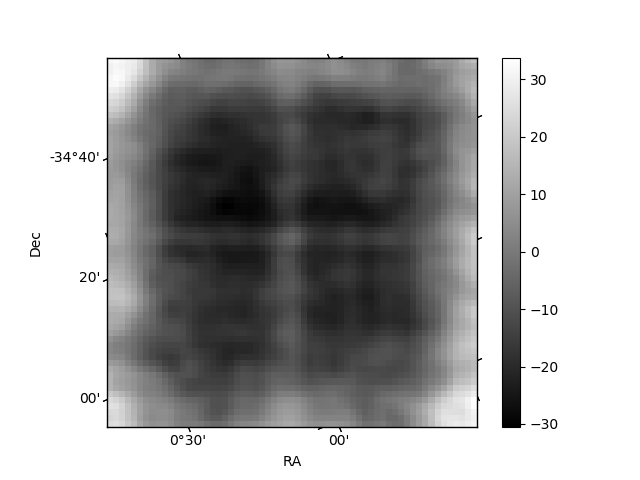
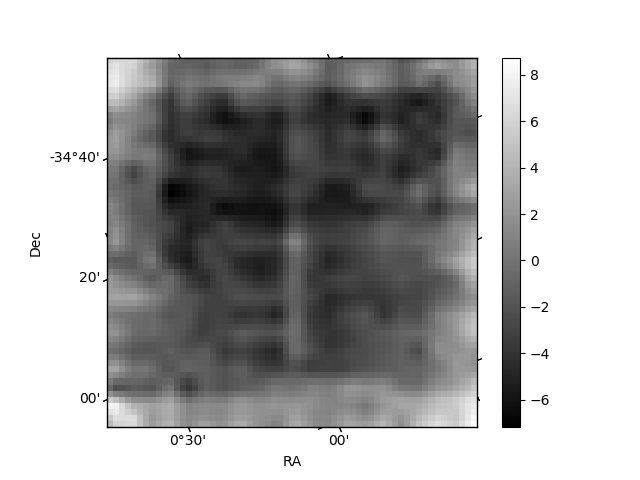
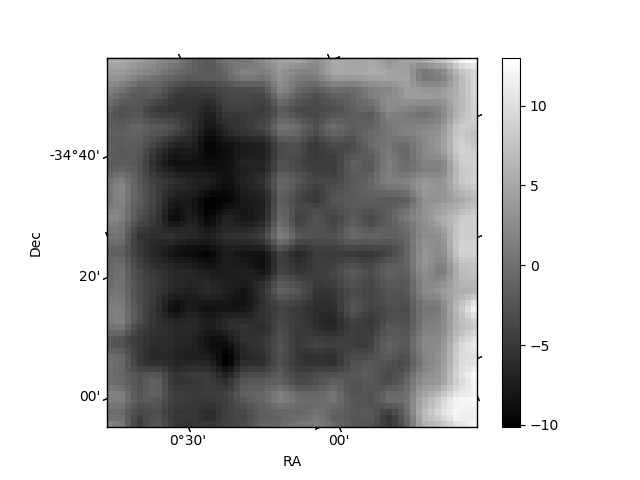
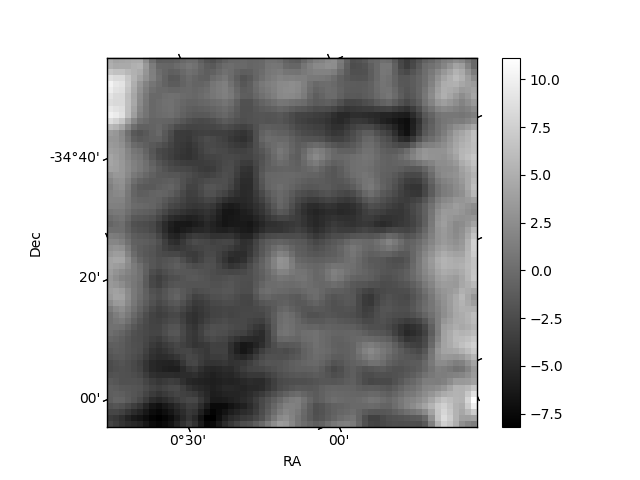
Histogram calculated using DETX and DETY for each event in the final _common_clean file
| Quadrant A | 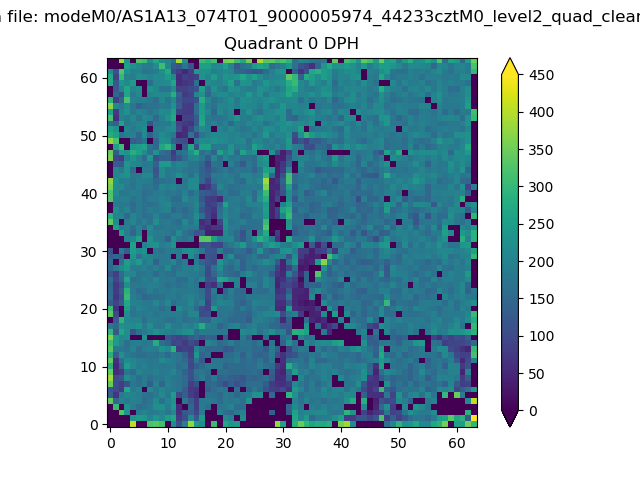 |
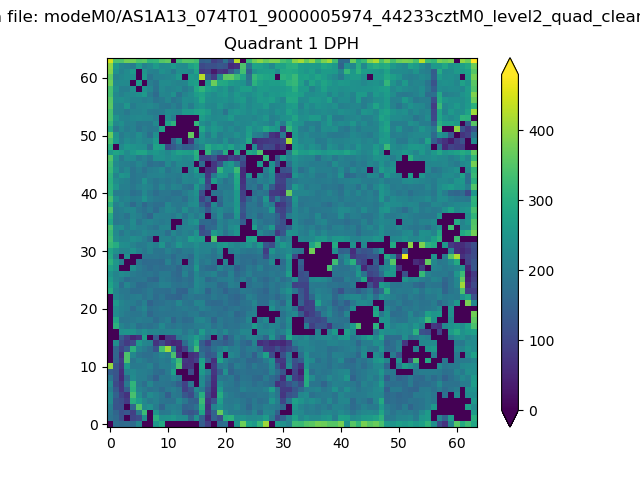 |
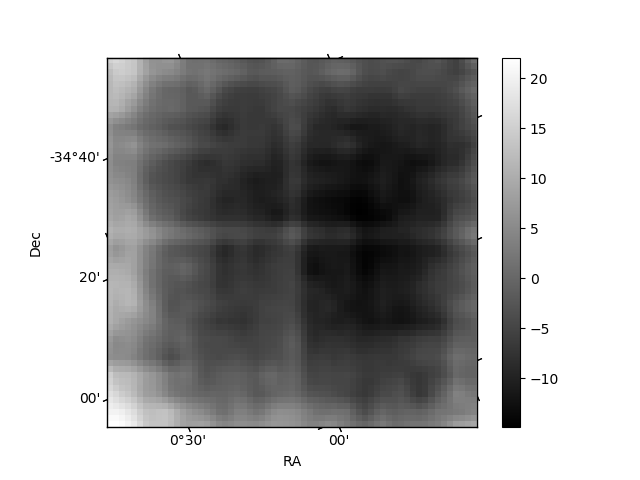
Quadrant B |
|---|---|---|---|
| Quadrant D | 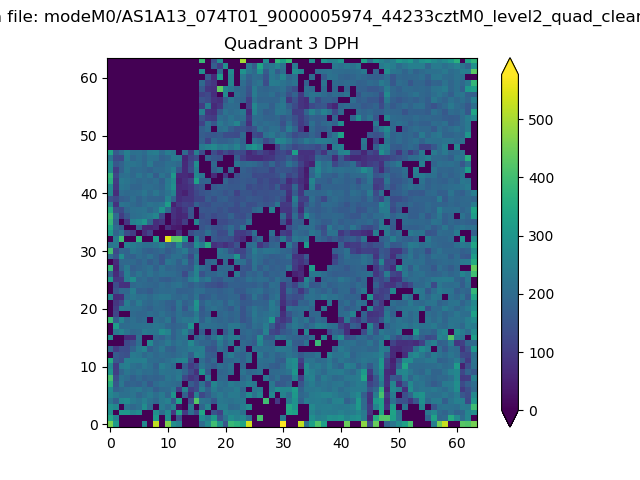 |
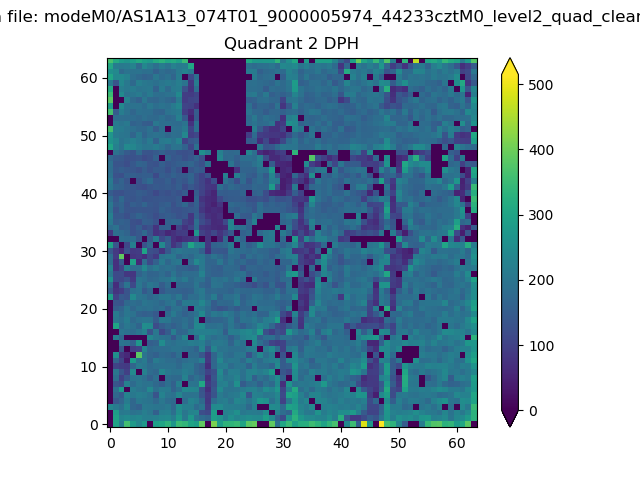 |
Quadrant C |
| Plot type | Count rate plots | Images |
|---|---|---|
| Comparison with Poisson distribution Blue bars denote a histogram of data divided into 1 sec bins. Red curve is a Poisson curve with rate = median count rate of data. |
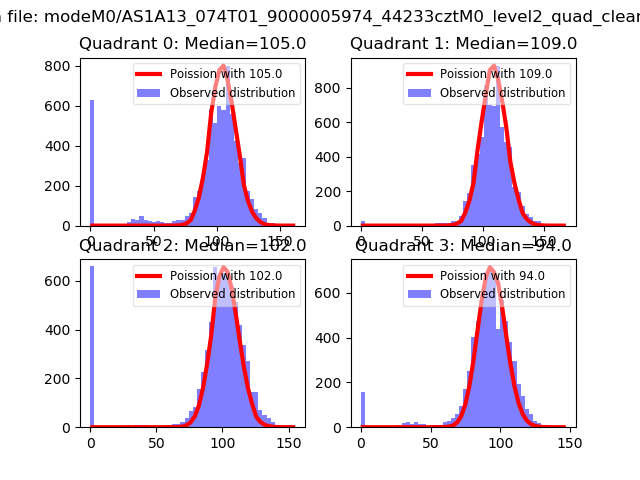 |
 |
| Quadrant-wise count rates Data is divided into 100 sec bins |
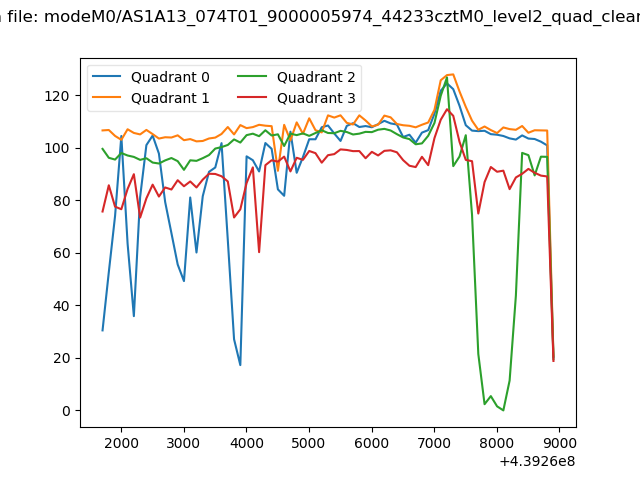 |
|
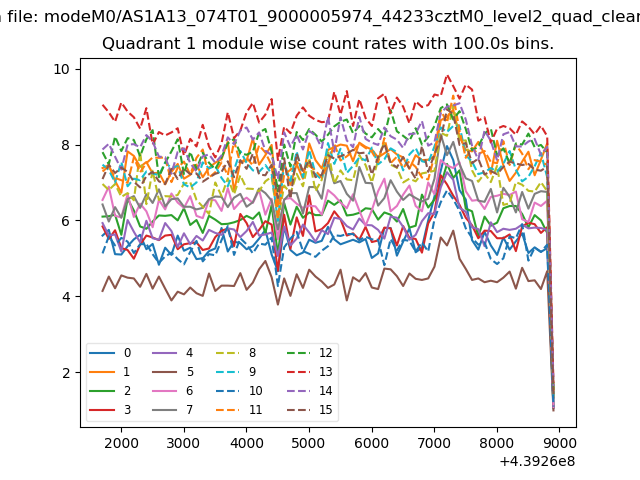
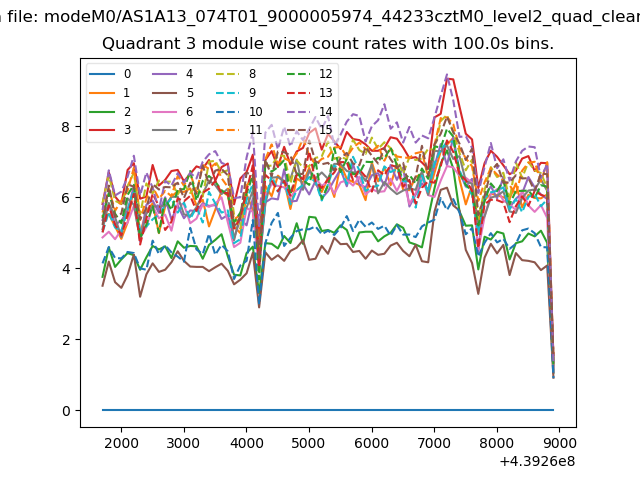
| Module-wise count rates for Quadrant A Data is divided into 100 sec bins |
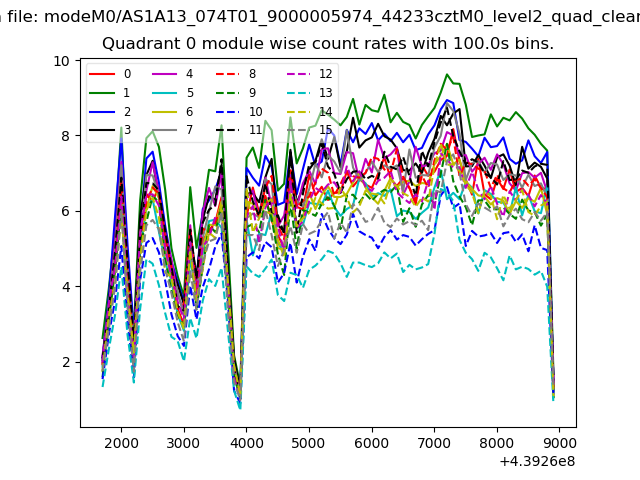 |
 |
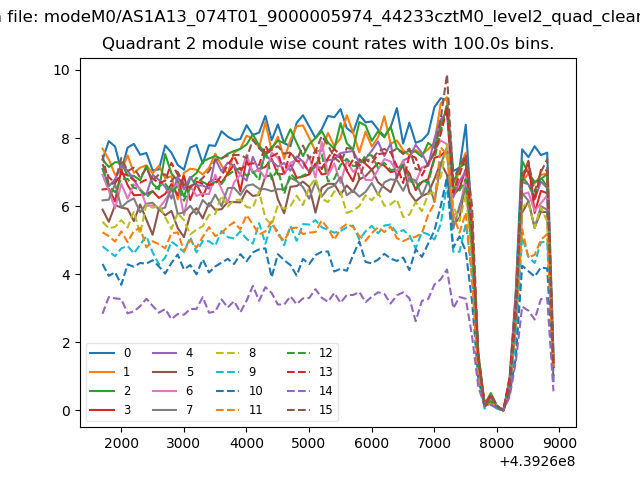
| Module-wise count rates for Quadrant B Data is divided into 100 sec bins |
 |
 |
| Module-wise count rates for Quadrant C Data is divided into 100 sec bins |
 |
 |
| Module-wise count rates for Quadrant D Data is divided into 100 sec bins |
 |
 |
| Parameter | Plot |
|---|---|
| CZT HV Monitor |  |
| D_VDD | 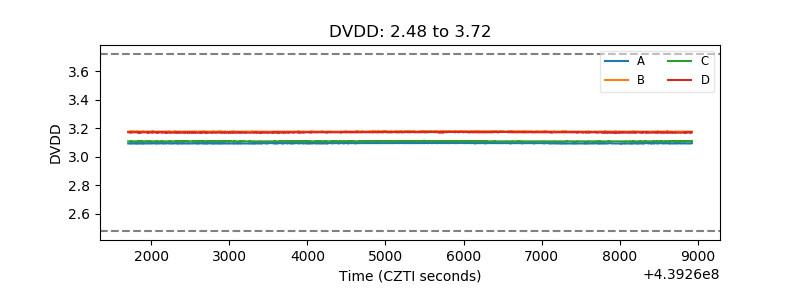 |
| Temperature 1 | 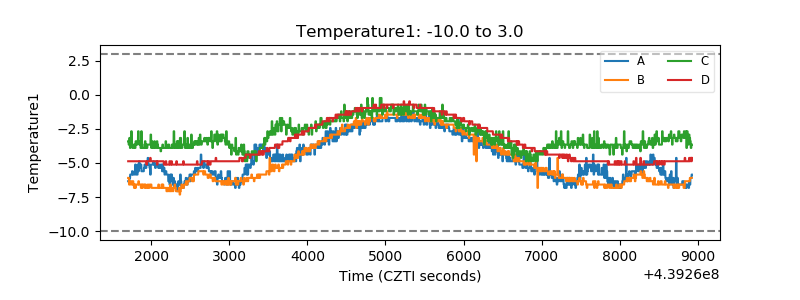 |
| Veto HV Monitor | 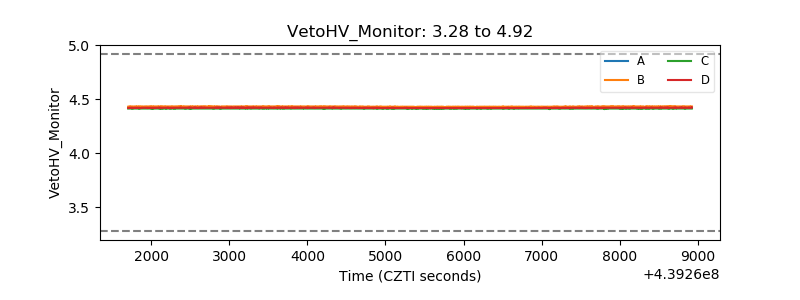 |
| Veto LLD | 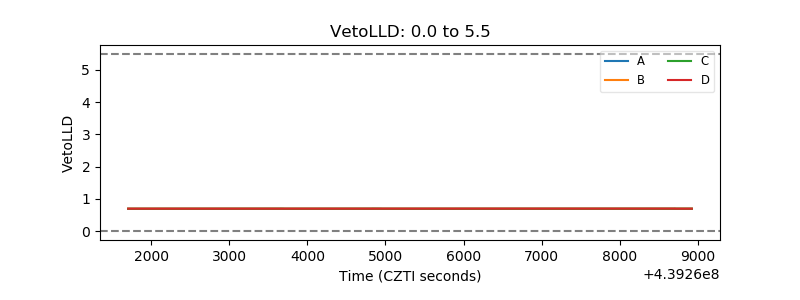 |
| Alpha Counter | 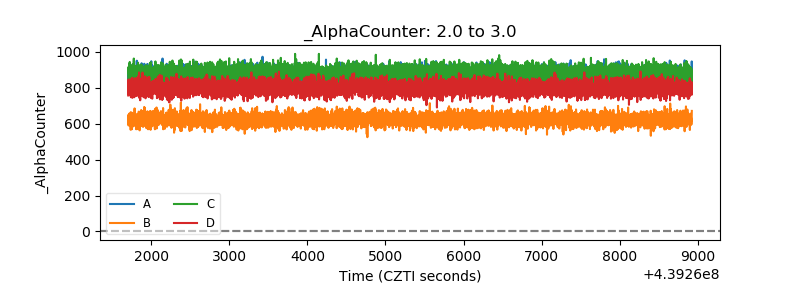 |
| _CPM_Rate |  |
| CZT Counter | 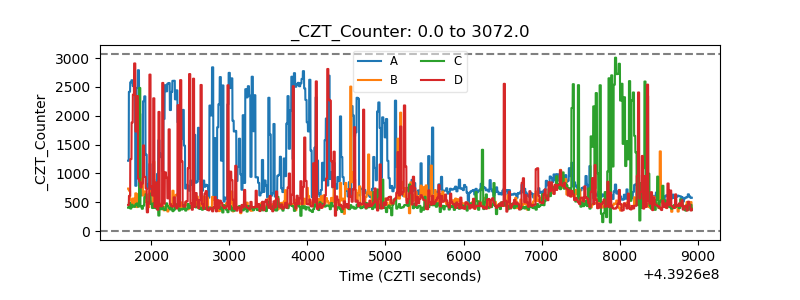 |
| +2.5 Volts monitor | 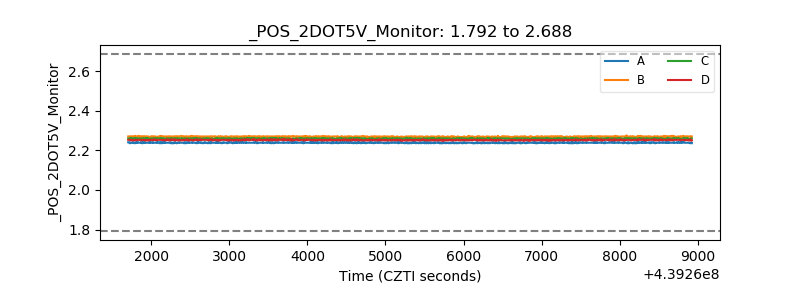 |
| +5 Volts monitor | 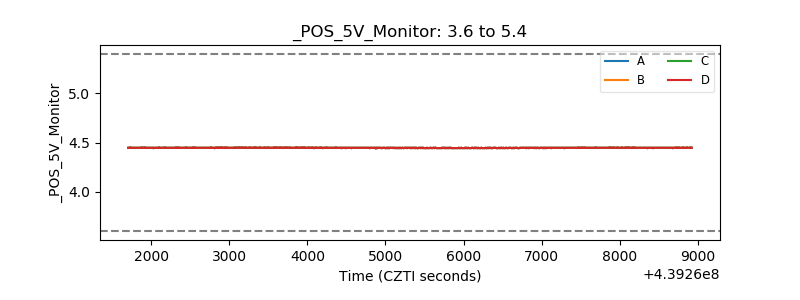 |
| _ROLL_ROT | 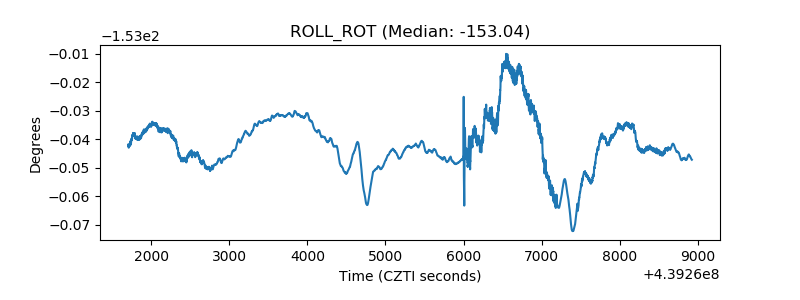 |
| _Roll_DEC | 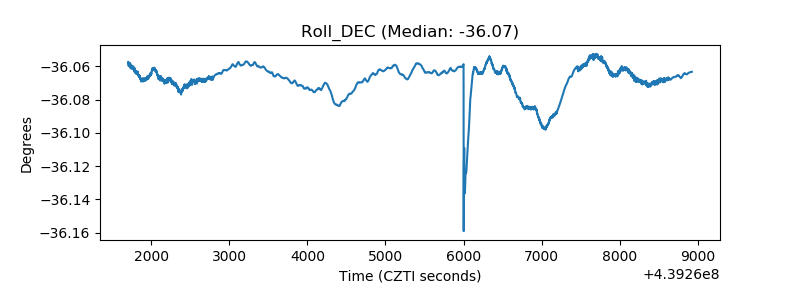 |
| _Roll_RA | 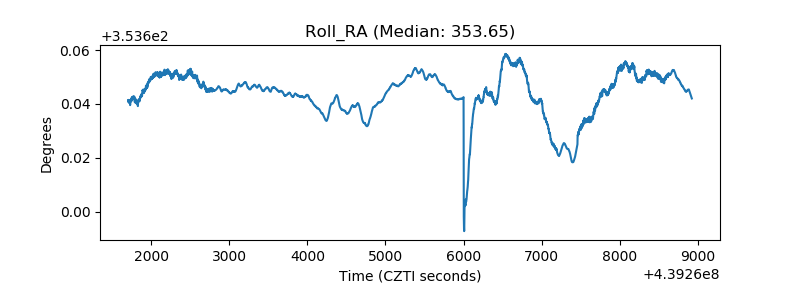 |
| Veto Counter | 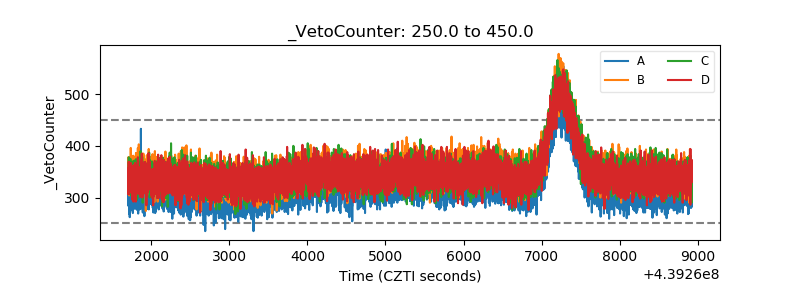 |