| Param | Original file | Final file |
|---|---|---|
| Filename | modeM0/AS1A13_074T01_9000005974_44236cztM0_level2.fits | modeM0/AS1A13_074T01_9000005974_44236cztM0_level2_quad_clean.evt |
| Size (bytes) | 1,168,493,760 | 250,888,320 |
| Size | 1.1 GB | 239.3 MB |
| Events in quadrant A | 11,974,690 | 1,689,417 |
| Events in quadrant B | 9,483,582 | 1,724,829 |
| Events in quadrant C | 9,291,307 | 1,600,958 |
| Events in quadrant D | 11,221,564 | 1,437,801 |
| Mode M9 | |||
|---|---|---|---|
| Quadrant | BADHDUFLAG | Total packets | Discarded packets |
| A | 0 | 6 | 0 |
| B | 0 | 6 | 0 |
| C | 0 | 6 | 0 |
| D | 0 | 6 | 0 |
| Mode SS | |||
|---|---|---|---|
| Quadrant | BADHDUFLAG | Total packets | Discarded packets |
| A | 0 | 334 | 0 |
| B | 0 | 334 | 0 |
| C | 0 | 334 | 0 |
| D | 0 | 334 | 0 |
| Mode M0 | |||
|---|---|---|---|
| Quadrant | BADHDUFLAG | Total packets | Discarded packets |
| A | 0 | 49563 | 9 |
| B | 0 | 39214 | 2 |
| C | 0 | 39643 | 2 |
| D | 0 | 45119 | 22 |
| Quadrant | Total seconds | Saturated seconds | Saturation percentage |
|---|---|---|---|
| A | 16572 | 468 | 2.824041% |
| B | 16575 | 616 | 3.716440% |
| C | 16575 | 1026 | 6.190045% |
| D | 16571 | 1195 | 7.211393% |
Noise dominated data is calculated using 1-second bins in cleaned event files. If a bin has >2000 counts, and if more than 50% of those come from <1% of pixels, then it is considered to be noise-dominated and hence unusable.
| Quadrant | # 1 sec bins | Bins with >0 counts | Bins with >2000 counts | High rate bins dominated by noise | Noise dominated (total time) | Noise dominated (detector-on time) | Marked lightcurve |
|---|---|---|---|---|---|---|---|
| A | 17040 | 16577 | 82 | 82 | 0.48% | 0.49% | 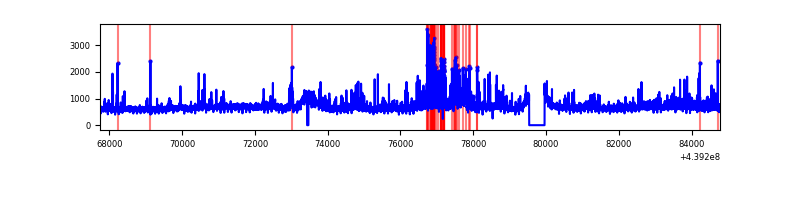 |
| B | 17040 | 16577 | 160 | 160 | 0.94% | 0.97% | 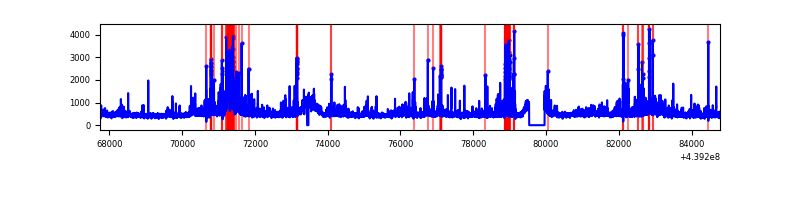 |
| C | 17040 | 16577 | 357 | 357 | 2.10% | 2.15% | 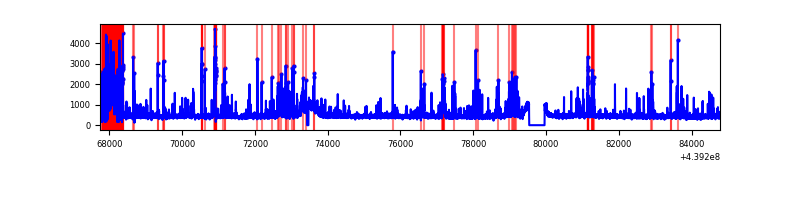 |
| D | 17040 | 16575 | 759 | 759 | 4.45% | 4.58% | 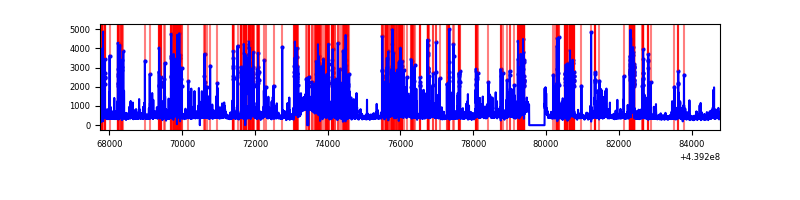 |
Top three noisy pixels from each quadrant. If the there are fewer than three noisy pixels in the level2.evt file, extra rows are filled as -1
| Pixel properties | Quadrant properties | ||||||
|---|---|---|---|---|---|---|---|
| Quadrant | DetID | PixID | Counts | Sigma | Mean | Median | Sigma |
| A | 10 | 83 | 3548378 | 9221.82 | 1842 | 1800 | 384.6 |
| A | 15 | 223 | 1067788 | 2771.78 | 1842 | 1800 | 384.6 |
| A | 7 | 3 | 88635 | 225.79 | 1842 | 1800 | 384.6 |
| B | 0 | 219 | 366661 | 1018.12 | 1826 | 1767 | 358.4 |
| B | 0 | 200 | 280026 | 776.39 | 1826 | 1767 | 358.4 |
| B | 0 | 155 | 246090 | 681.7 | 1826 | 1767 | 358.4 |
| C | 14 | 254 | 1697656 | 4116.01 | 1745 | 1755 | 412.0 |
| C | 3 | 233 | 300287 | 724.55 | 1745 | 1755 | 412.0 |
| C | 4 | 254 | 288049 | 694.84 | 1745 | 1755 | 412.0 |
| D | 13 | 249 | 2530658 | 5613.79 | 1760 | 1702 | 450.5 |
| D | 1 | 52 | 312094 | 689.01 | 1760 | 1702 | 450.5 |
| D | 13 | 171 | 262921 | 579.86 | 1760 | 1702 | 450.5 |
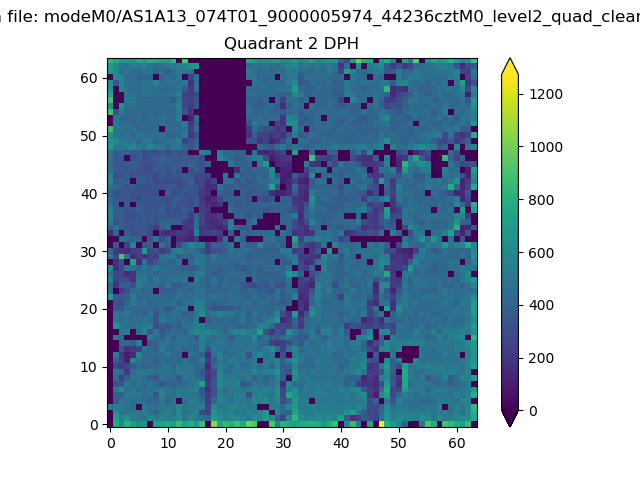
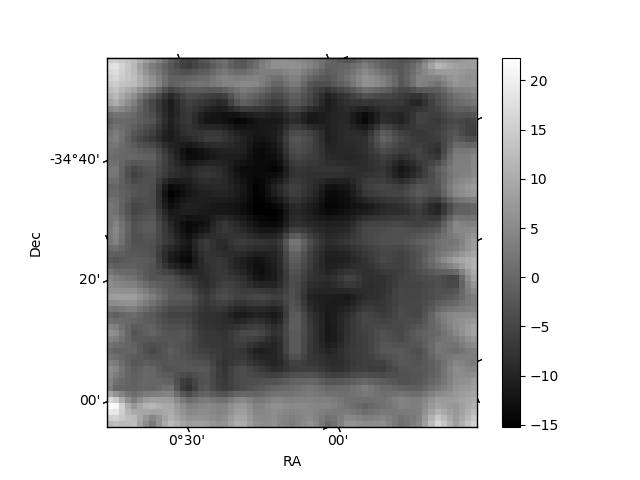
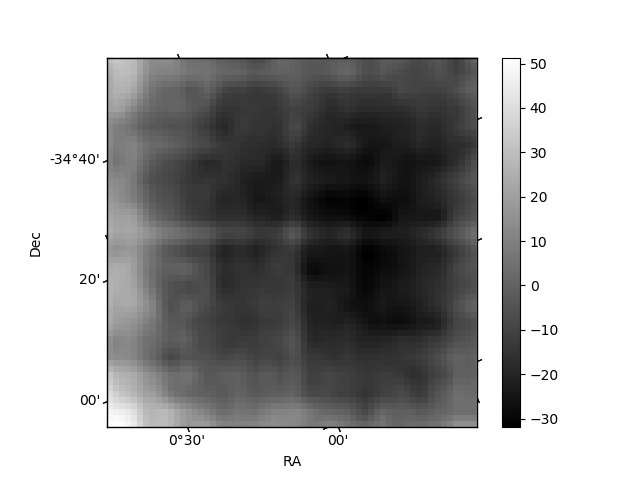
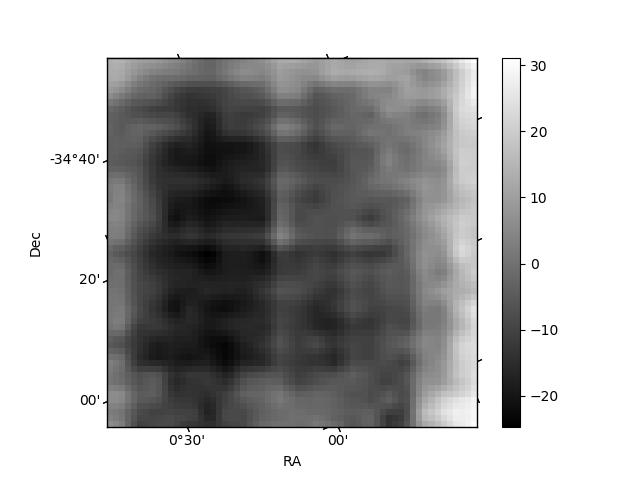
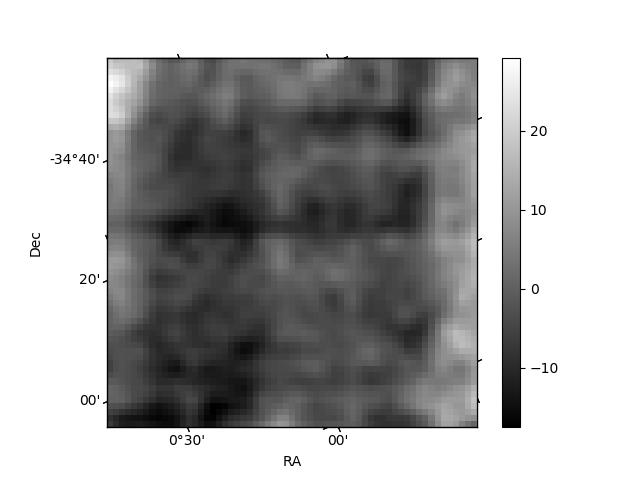
Histogram calculated using DETX and DETY for each event in the final _common_clean file
| Quadrant A | 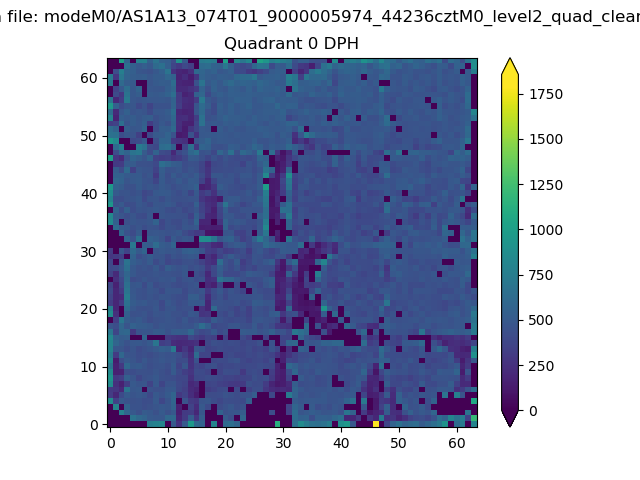 |
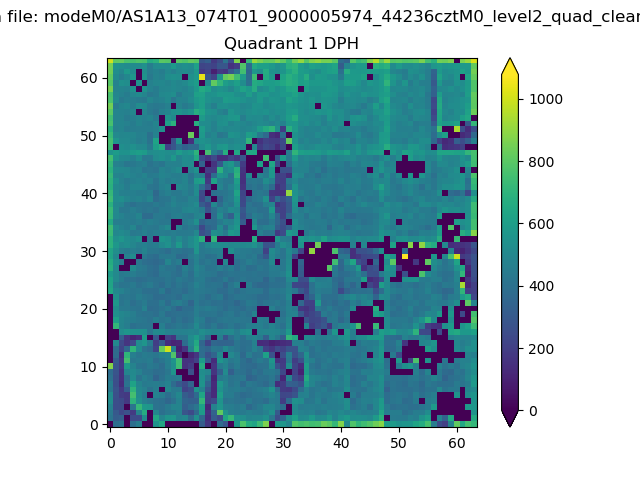 |
Quadrant B |
|---|---|---|---|
| Quadrant D | 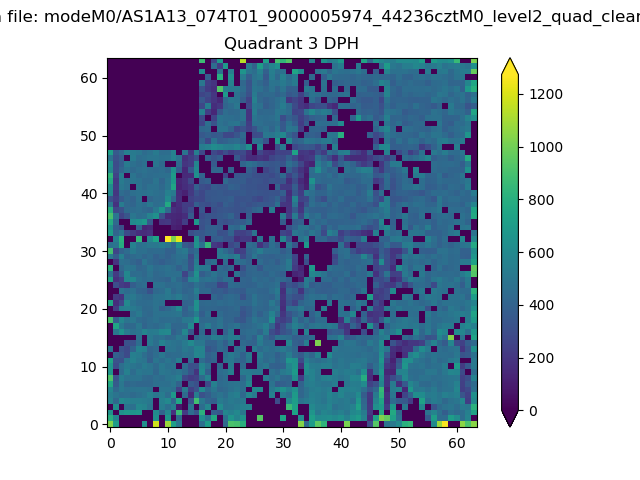 |
 |
Quadrant C |
| Plot type | Count rate plots | Images |
|---|---|---|
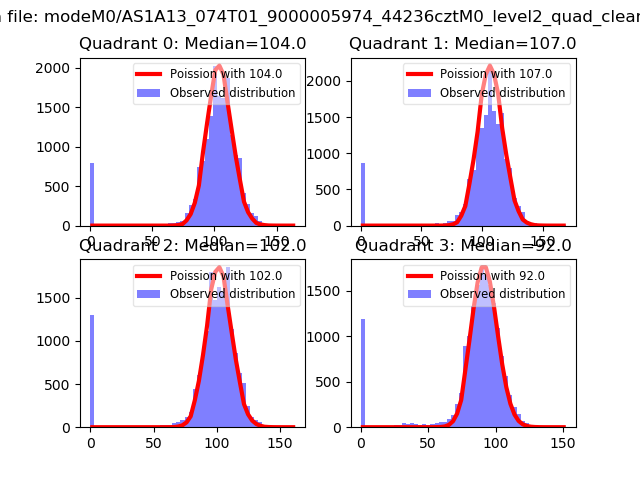
| Comparison with Poisson distribution Blue bars denote a histogram of data divided into 1 sec bins. Red curve is a Poisson curve with rate = median count rate of data. |
 |
 |
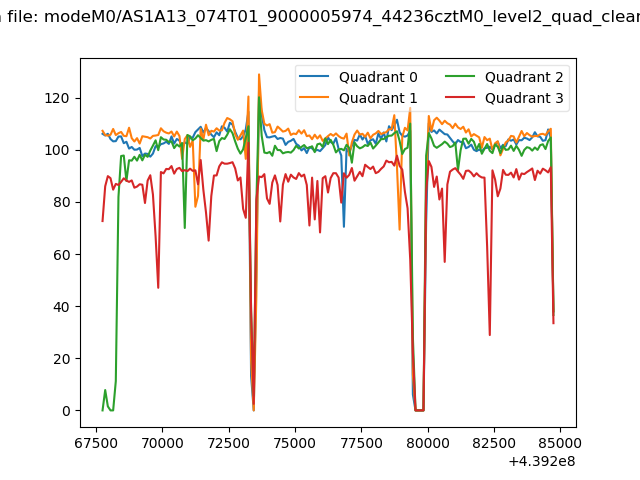
| Quadrant-wise count rates Data is divided into 100 sec bins |
 |
|
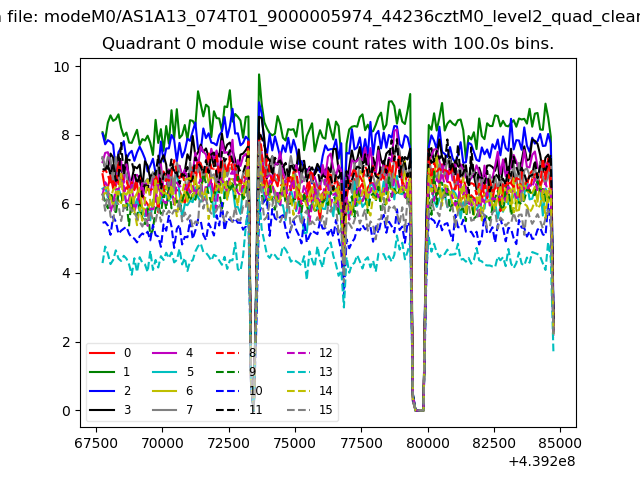
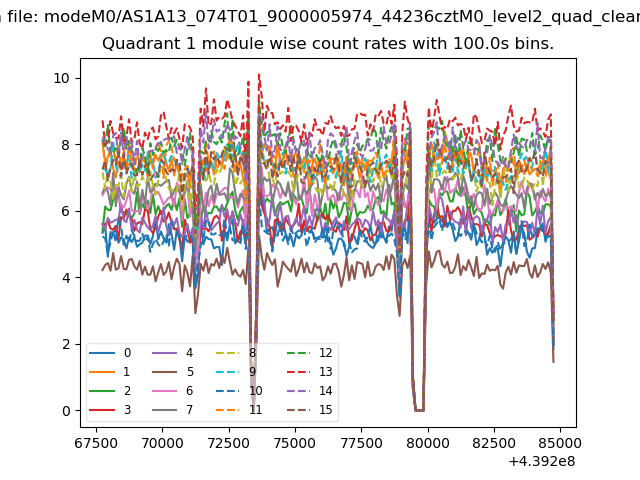
| Module-wise count rates for Quadrant A Data is divided into 100 sec bins |
 |
 |
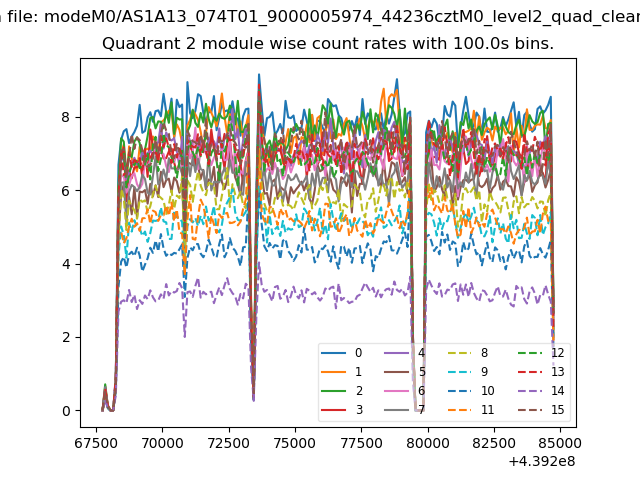
| Module-wise count rates for Quadrant B Data is divided into 100 sec bins |
 |
 |
| Module-wise count rates for Quadrant C Data is divided into 100 sec bins |
 |
 |
| Module-wise count rates for Quadrant D Data is divided into 100 sec bins |
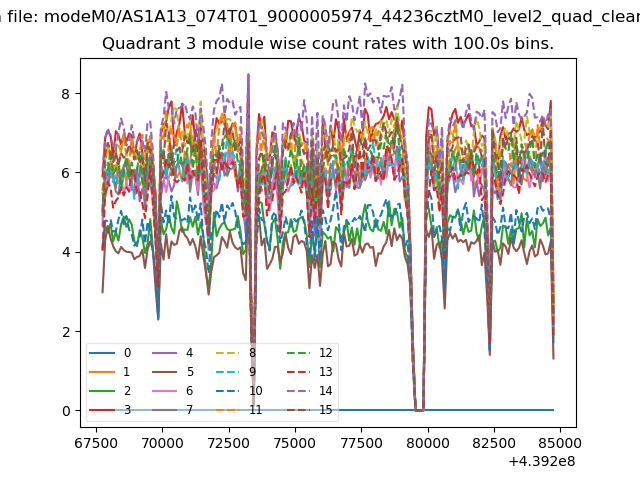 |
 |
| Parameter | Plot |
|---|---|
| CZT HV Monitor | 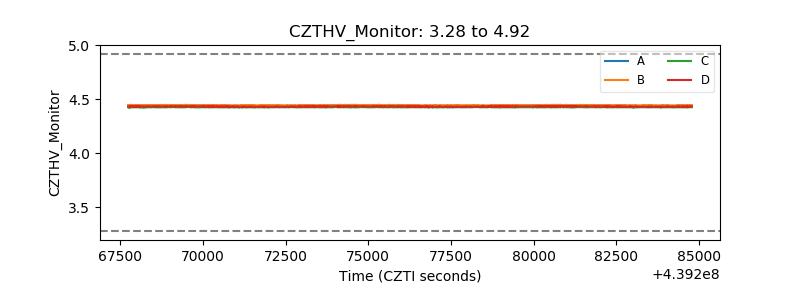 |
| D_VDD | 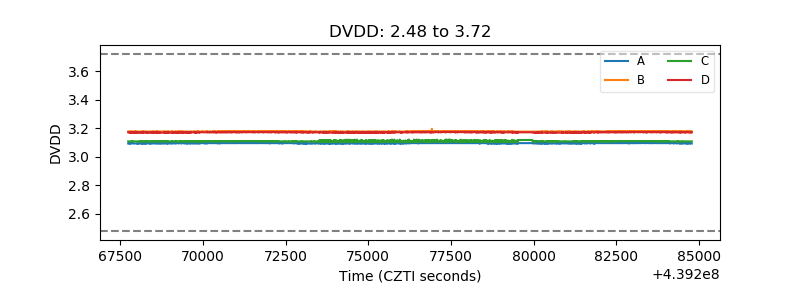 |
| Temperature 1 | 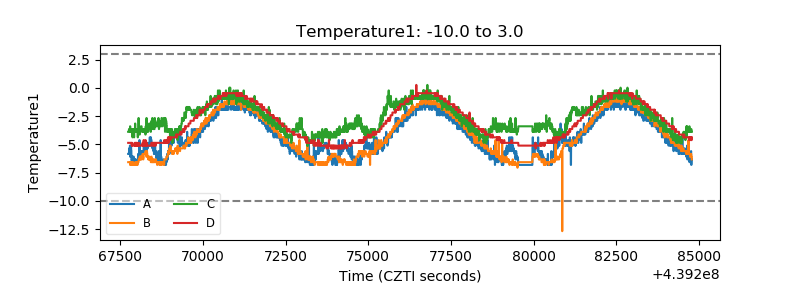 |
| Veto HV Monitor | 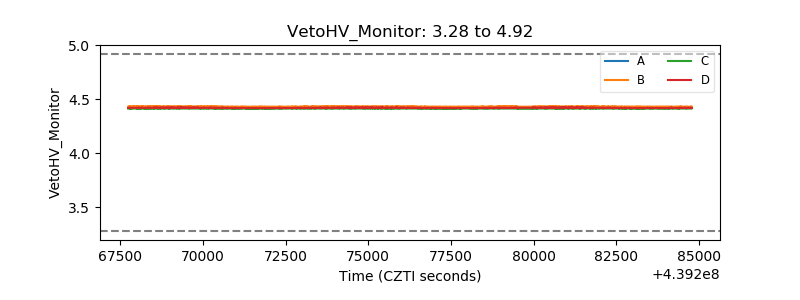 |
| Veto LLD | 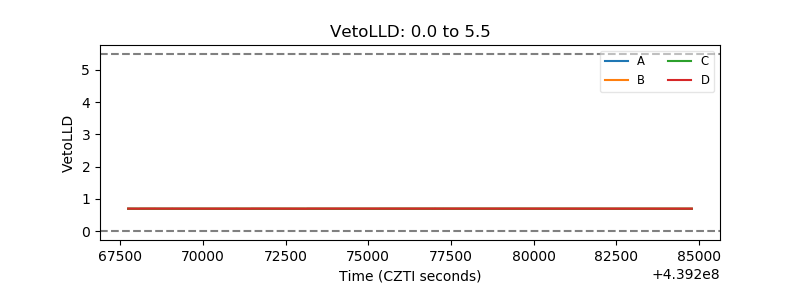 |
| Alpha Counter | 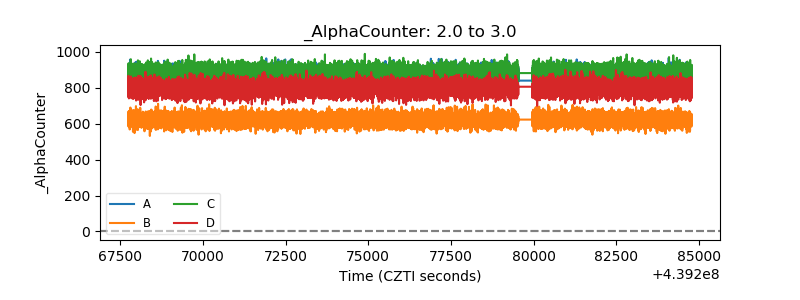 |
| _CPM_Rate | 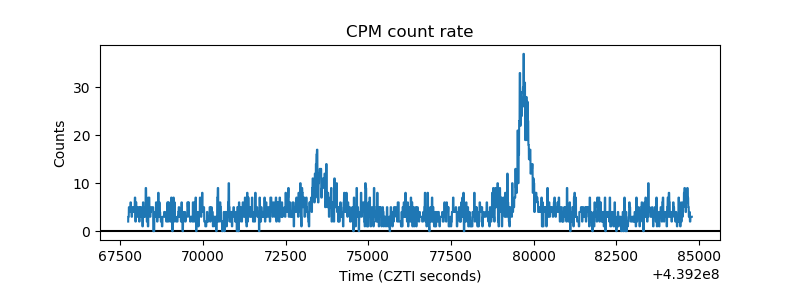 |
| CZT Counter | 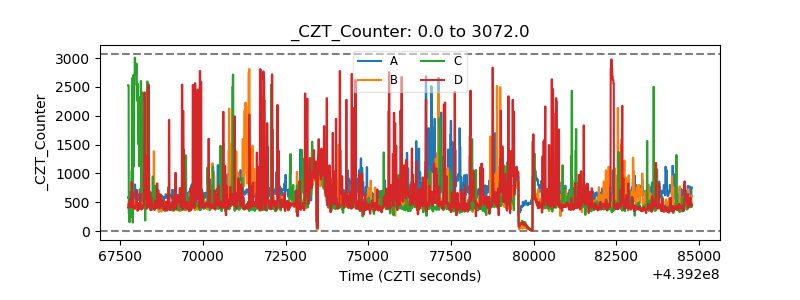 |
| +2.5 Volts monitor | 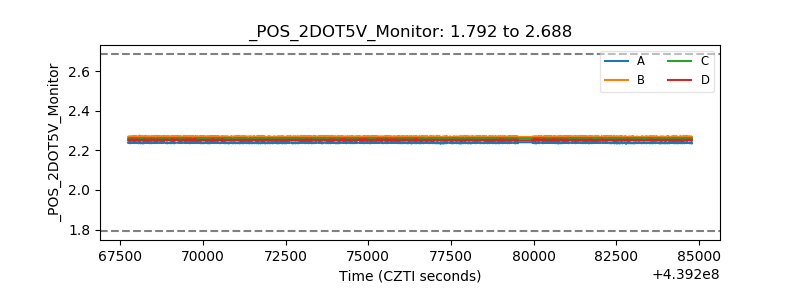 |
| +5 Volts monitor | 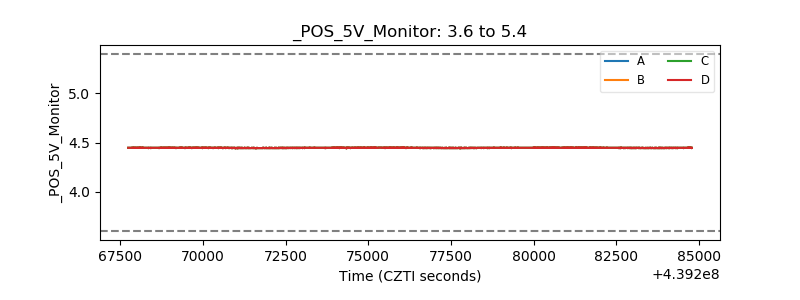 |
| _ROLL_ROT | 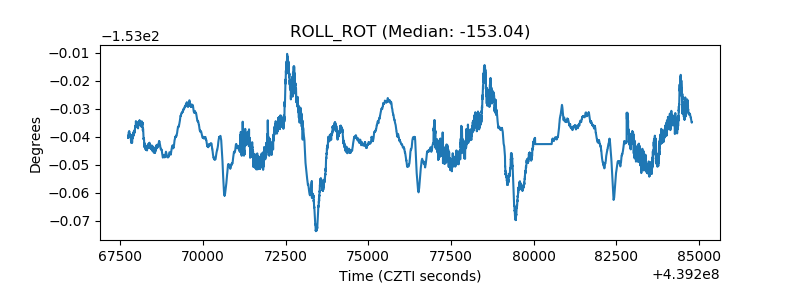 |
| _Roll_DEC | 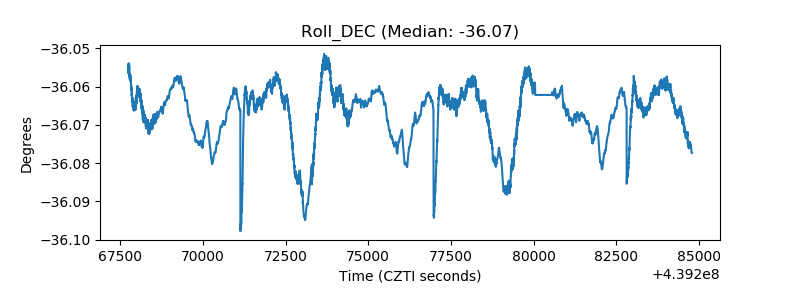 |
| _Roll_RA | 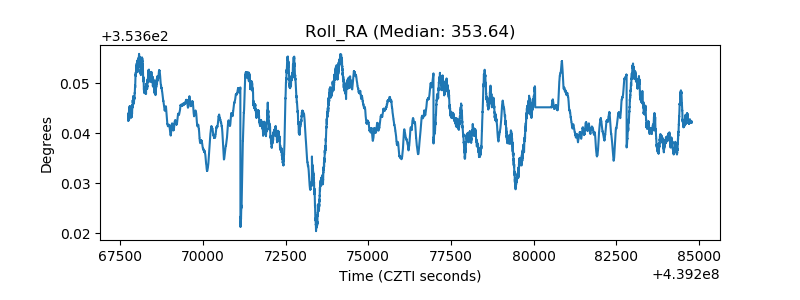 |
| Veto Counter | 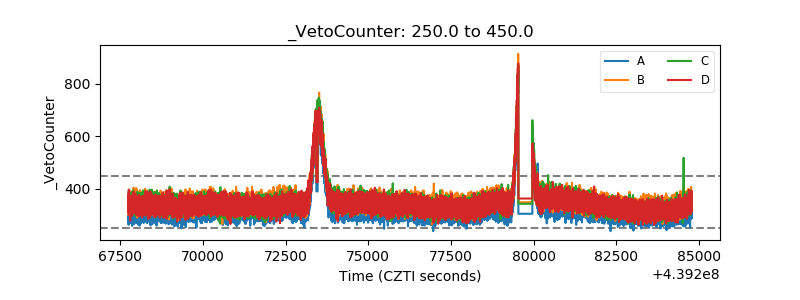 |