| Param | Original file | Final file |
|---|---|---|
| Filename | modeM0/AS1A13_074T03_9000005976_44236cztM0_level2.fits | modeM0/AS1A13_074T03_9000005976_44236cztM0_level2_quad_clean.evt |
| Size (bytes) | 119,894,400 | 27,383,040 |
| Size | 114.3 MB | 26.1 MB |
| Events in quadrant A | 1,422,964 | 176,508 |
| Events in quadrant B | 967,901 | 183,934 |
| Events in quadrant C | 909,686 | 179,956 |
| Events in quadrant D | 1,001,791 | 163,976 |
| Mode M0 | |||
|---|---|---|---|
| Quadrant | BADHDUFLAG | Total packets | Discarded packets |
| A | 0 | 5612 | 1 |
| B | 0 | 3982 | 1 |
| C | 0 | 3808 | 1 |
| D | 0 | 4129 | 1 |
| Mode SS | |||
|---|---|---|---|
| Quadrant | BADHDUFLAG | Total packets | Discarded packets |
| A | 0 | 34 | 0 |
| B | 0 | 34 | 0 |
| C | 0 | 34 | 0 |
| D | 0 | 34 | 0 |
| Mode M9 | |||
|---|---|---|---|
| Quadrant | BADHDUFLAG | Total packets | Discarded packets |
| A | 0 | 7 | 0 |
| B | 0 | 7 | 0 |
| C | 0 | 7 | 0 |
| D | 0 | 7 | 0 |
| Quadrant | Total seconds | Saturated seconds | Saturation percentage |
|---|---|---|---|
| A | 1711 | 126 | 7.364115% |
| B | 1710 | 108 | 6.315789% |
| C | 1710 | 70 | 4.093567% |
| D | 1710 | 86 | 5.029240% |
Noise dominated data is calculated using 1-second bins in cleaned event files. If a bin has >2000 counts, and if more than 50% of those come from <1% of pixels, then it is considered to be noise-dominated and hence unusable.
| Quadrant | # 1 sec bins | Bins with >0 counts | Bins with >2000 counts | High rate bins dominated by noise | Noise dominated (total time) | Noise dominated (detector-on time) | Marked lightcurve |
|---|---|---|---|---|---|---|---|
| A | 2361 | 1712 | 10 | 10 | 0.42% | 0.58% | 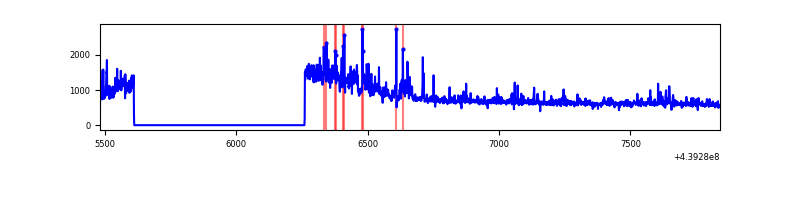 |
| B | 2360 | 1711 | 19 | 19 | 0.81% | 1.11% | 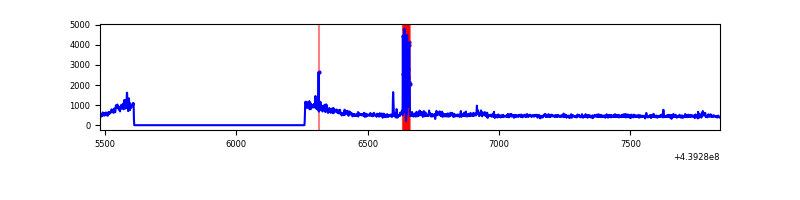 |
| C | 2360 | 1711 | 2 | 2 | 0.08% | 0.12% | 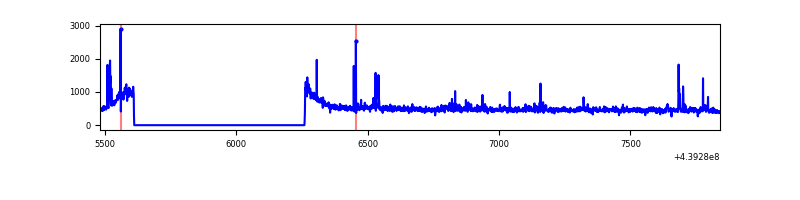 |
| D | 2360 | 1711 | 18 | 18 | 0.76% | 1.05% | 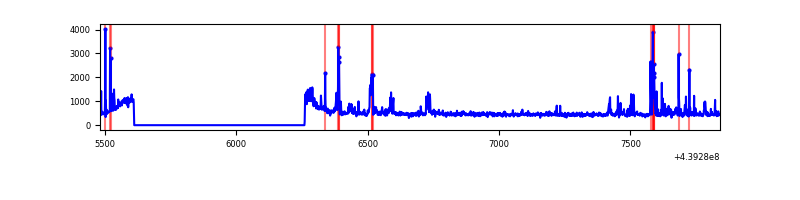 |
Top three noisy pixels from each quadrant. If the there are fewer than three noisy pixels in the level2.evt file, extra rows are filled as -1
| Pixel properties | Quadrant properties | ||||||
|---|---|---|---|---|---|---|---|
| Quadrant | DetID | PixID | Counts | Sigma | Mean | Median | Sigma |
| A | 10 | 83 | 411544 | 8804.03 | 211 | 205 | 46.7 |
| A | 15 | 223 | 175114 | 3743.64 | 211 | 205 | 46.7 |
| A | 7 | 3 | 12549 | 264.2 | 211 | 205 | 46.7 |
| B | 5 | 235 | 65215 | 1462.16 | 210 | 203 | 44.5 |
| B | 5 | 255 | 17239 | 383.15 | 210 | 203 | 44.5 |
| B | 0 | 155 | 15177 | 336.77 | 210 | 203 | 44.5 |
| C | 14 | 254 | 39447 | 733.46 | 217 | 217 | 53.5 |
| C | 2 | 14 | 16631 | 306.88 | 217 | 217 | 53.5 |
| C | 3 | 233 | 2443 | 41.62 | 217 | 217 | 53.5 |
| D | 13 | 249 | 129789 | 2301.42 | 215 | 208 | 56.3 |
| D | 2 | 249 | 19831 | 348.51 | 215 | 208 | 56.3 |
| D | 1 | 52 | 16874 | 296.0 | 215 | 208 | 56.3 |
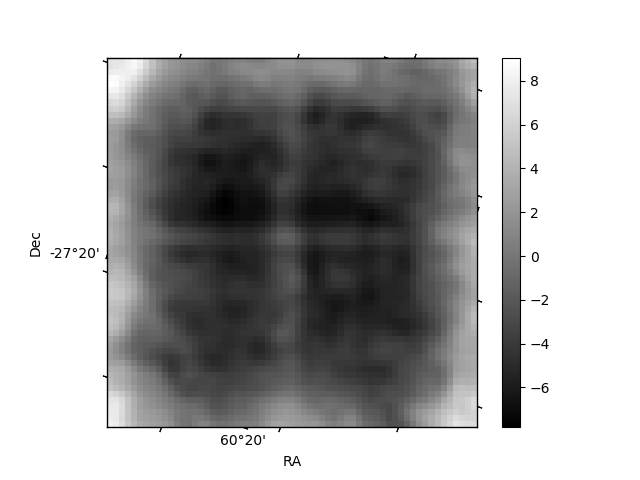
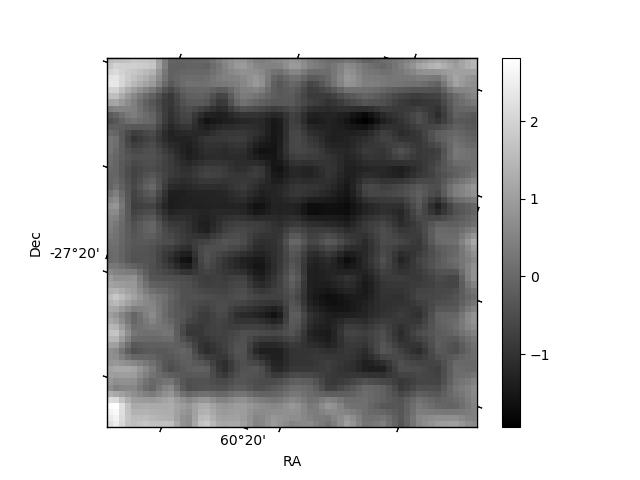
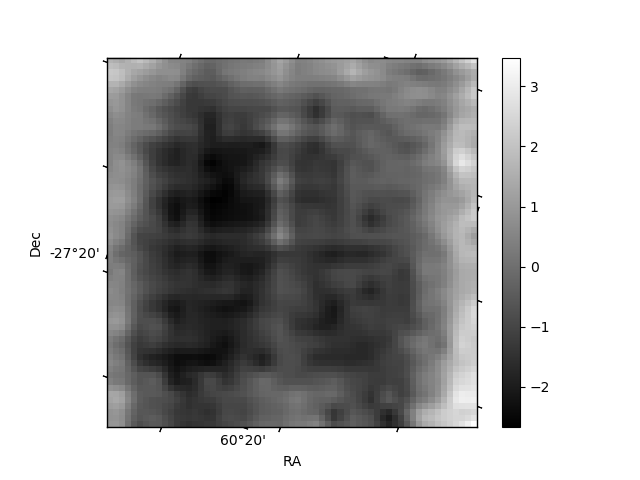
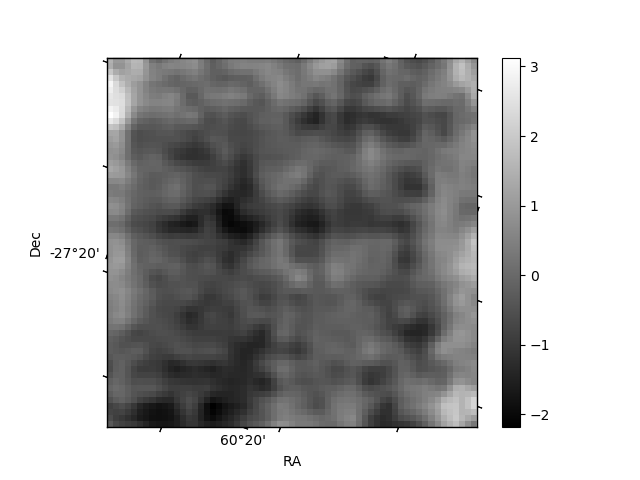
Histogram calculated using DETX and DETY for each event in the final _common_clean file
| Quadrant A | 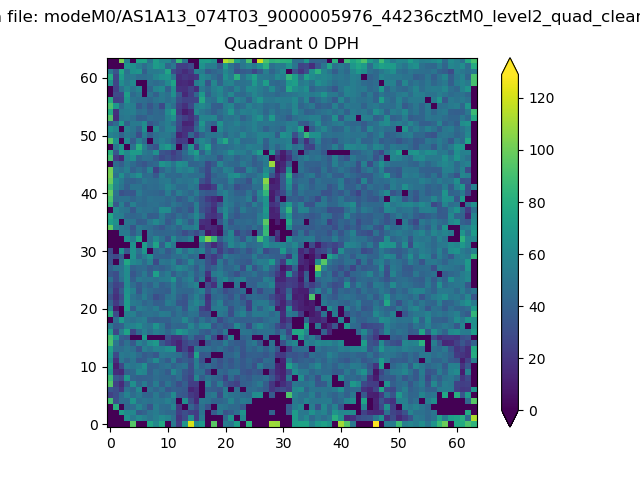 |
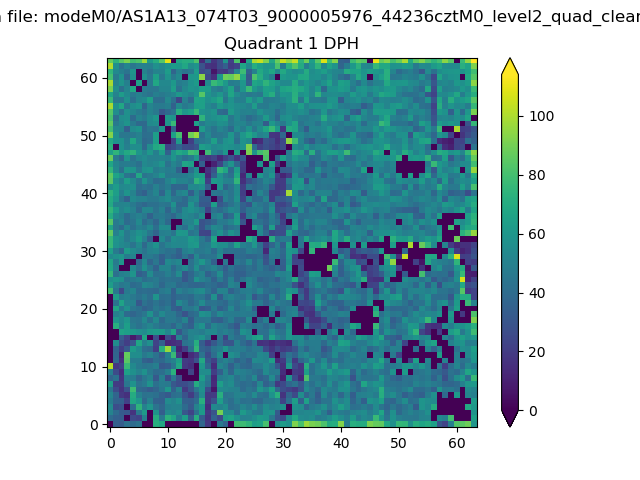 |
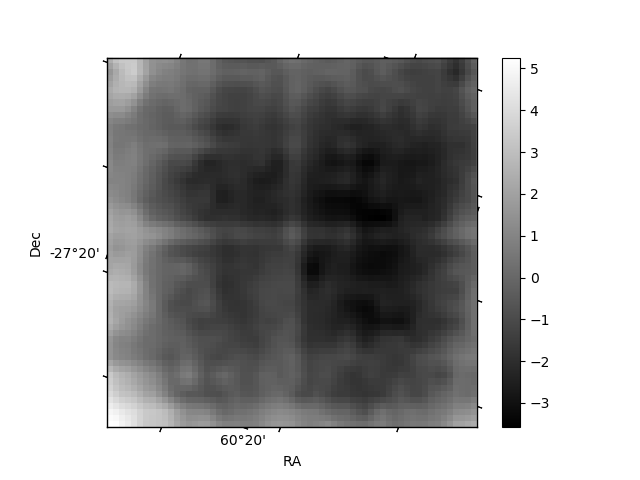
Quadrant B |
|---|---|---|---|
| Quadrant D | 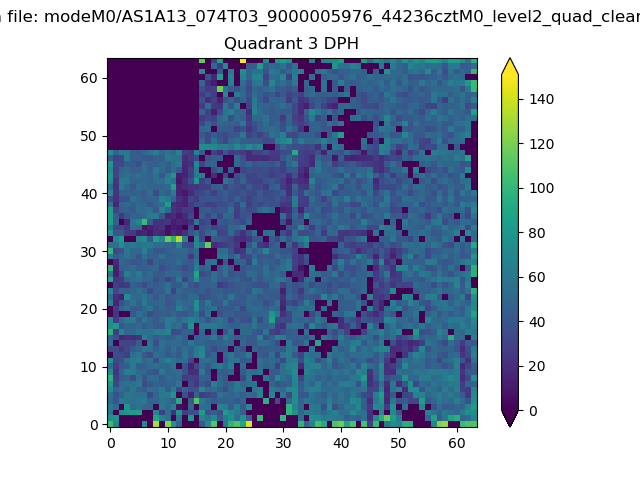 |
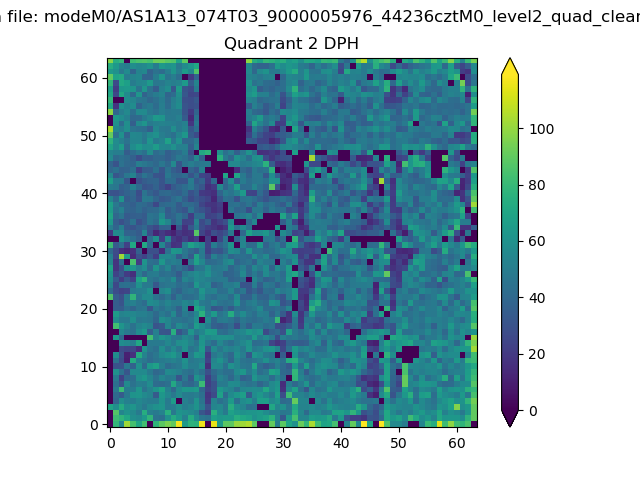 |
Quadrant C |
| Plot type | Count rate plots | Images |
|---|---|---|
| Comparison with Poisson distribution Blue bars denote a histogram of data divided into 1 sec bins. Red curve is a Poisson curve with rate = median count rate of data. |
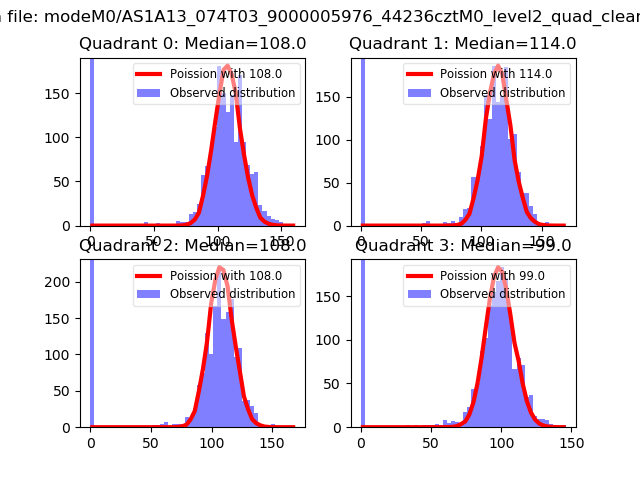 |
 |
| Quadrant-wise count rates Data is divided into 100 sec bins |
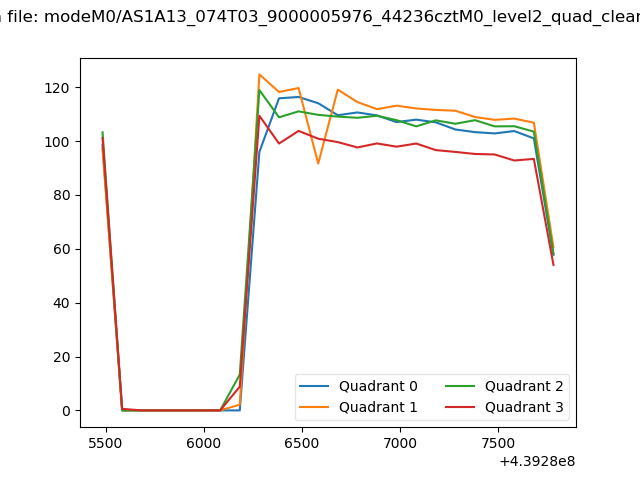 |
|
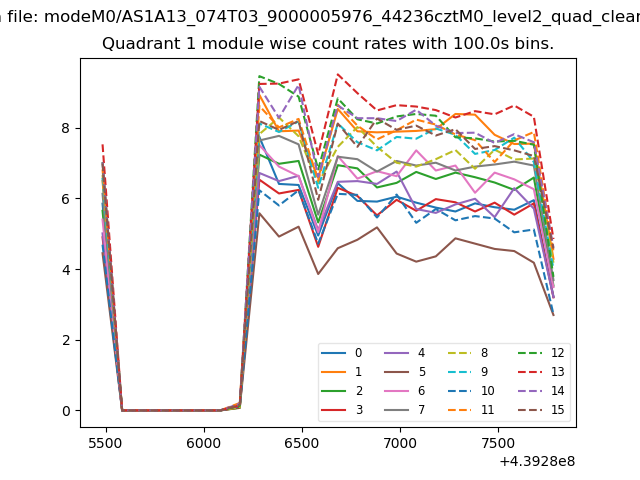
| Module-wise count rates for Quadrant A Data is divided into 100 sec bins |
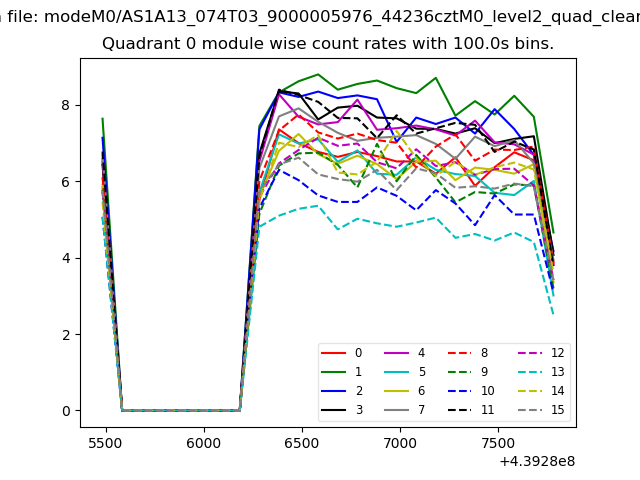 |
 |
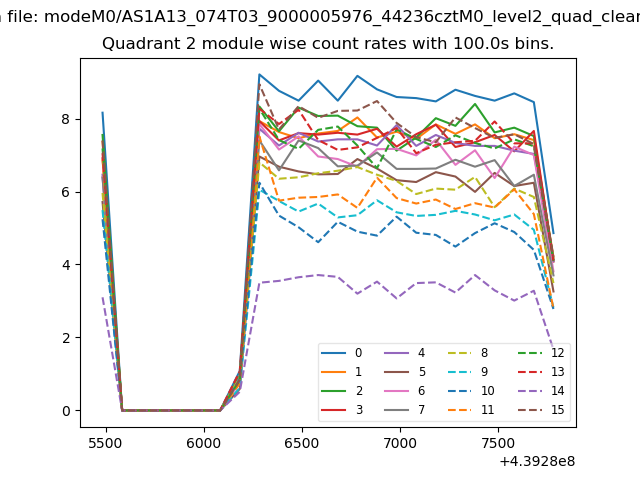
| Module-wise count rates for Quadrant B Data is divided into 100 sec bins |
 |
 |
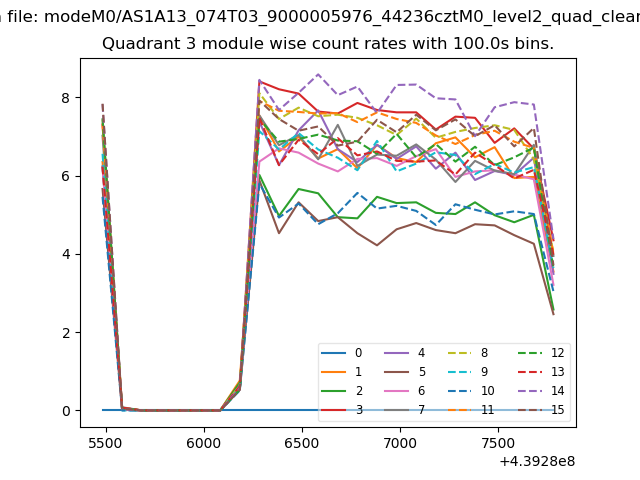
| Module-wise count rates for Quadrant C Data is divided into 100 sec bins |
 |
 |
| Module-wise count rates for Quadrant D Data is divided into 100 sec bins |
 |
 |
| Parameter | Plot |
|---|---|
| CZT HV Monitor | 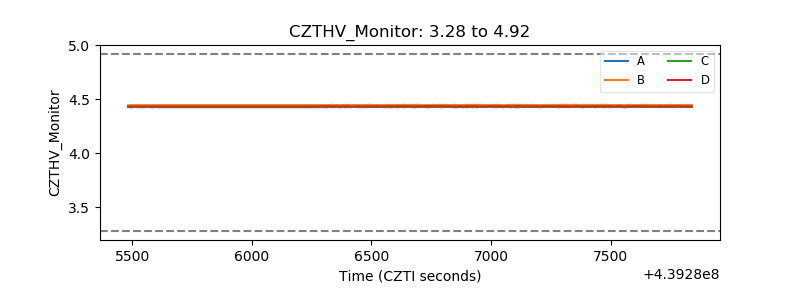 |
| D_VDD | 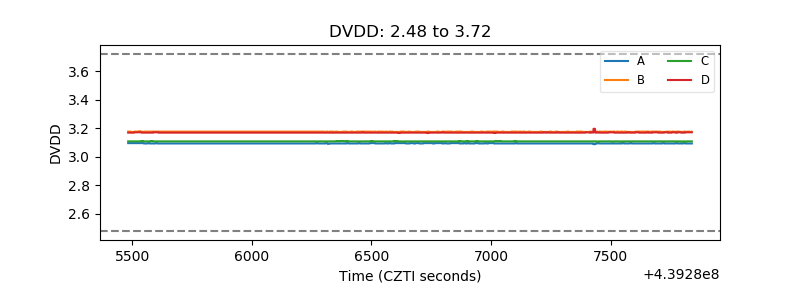 |
| Temperature 1 | 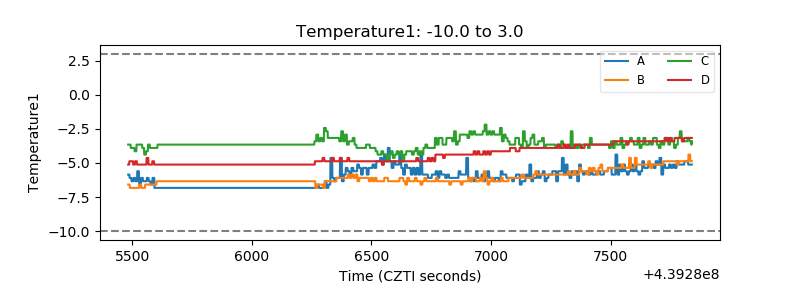 |
| Veto HV Monitor | 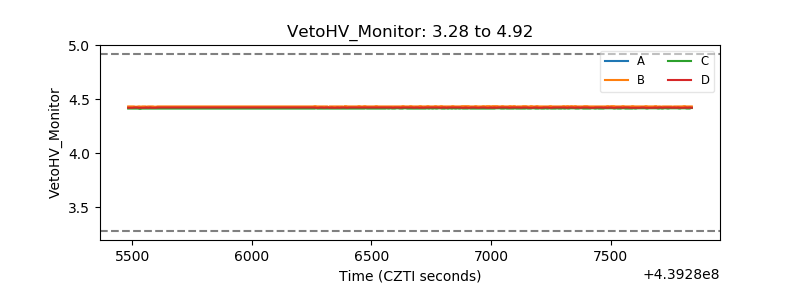 |
| Veto LLD | 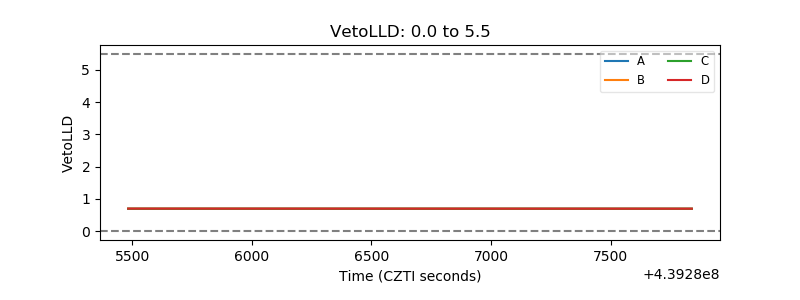 |
| Alpha Counter | 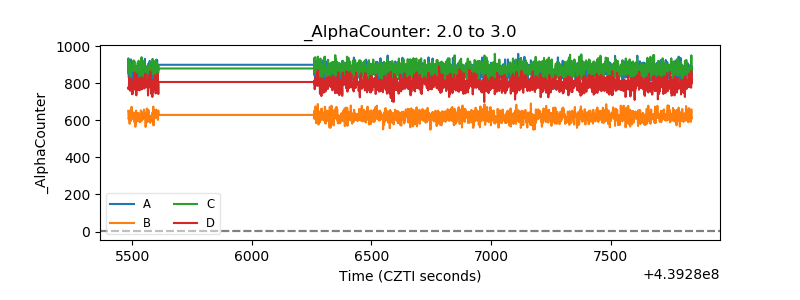 |
| _CPM_Rate |  |
| CZT Counter | 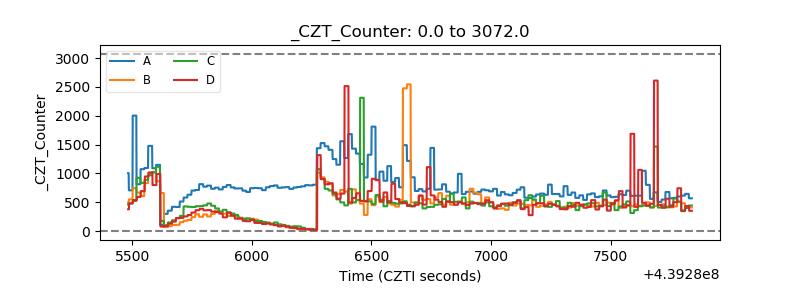 |
| +2.5 Volts monitor | 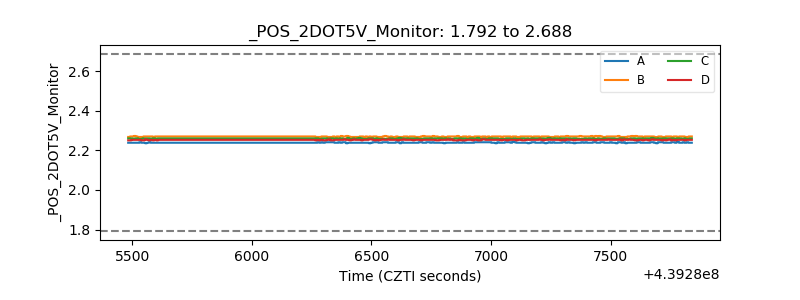 |
| +5 Volts monitor | 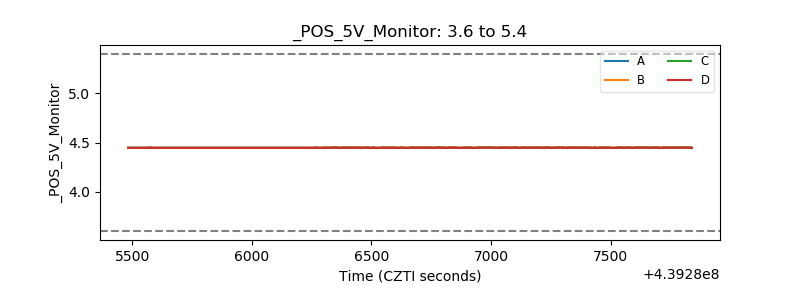 |
| _ROLL_ROT | 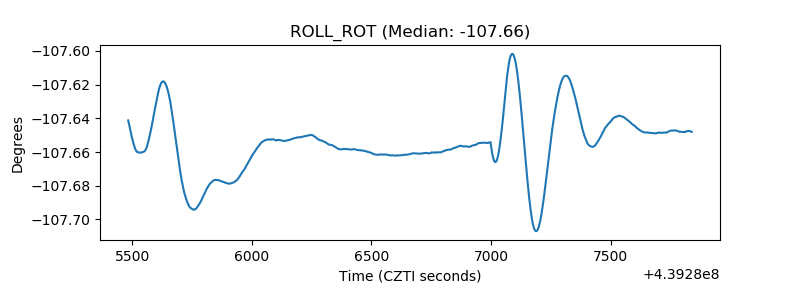 |
| _Roll_DEC | 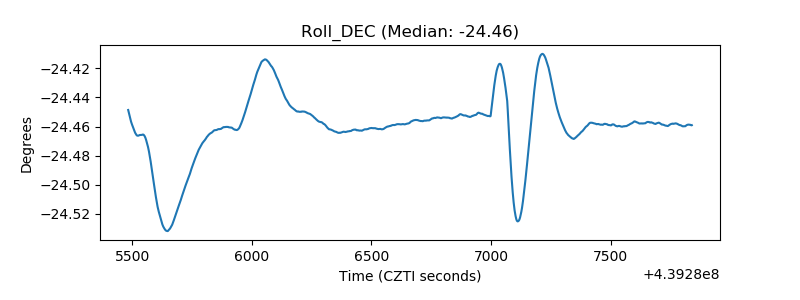 |
| _Roll_RA | 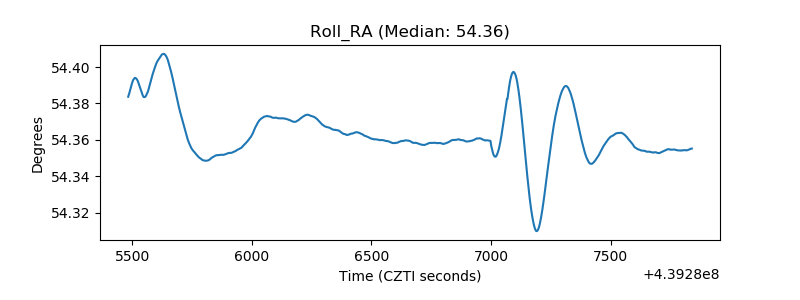 |
| Veto Counter | 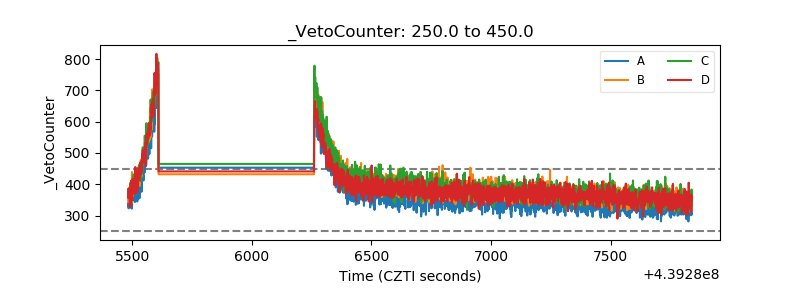 |