| Param | Original file | Final file |
|---|---|---|
| Filename | modeM0/AS1A13_074T03_9000005976_44237cztM0_level2.fits | modeM0/AS1A13_074T03_9000005976_44237cztM0_level2_quad_clean.evt |
| Size (bytes) | 444,936,960 | 111,519,360 |
| Size | 424.3 MB | 106.4 MB |
| Events in quadrant A | 5,382,396 | 731,483 |
| Events in quadrant B | 3,534,514 | 761,488 |
| Events in quadrant C | 3,249,162 | 734,137 |
| Events in quadrant D | 3,764,433 | 666,608 |
| Mode M0 | |||
|---|---|---|---|
| Quadrant | BADHDUFLAG | Total packets | Discarded packets |
| A | 0 | 21270 | 2 |
| B | 0 | 15030 | 2 |
| C | 0 | 14638 | 2 |
| D | 0 | 16188 | 2 |
| Mode SS | |||
|---|---|---|---|
| Quadrant | BADHDUFLAG | Total packets | Discarded packets |
| A | 0 | 138 | 0 |
| B | 0 | 138 | 0 |
| C | 0 | 138 | 0 |
| D | 0 | 138 | 0 |
| Mode M9 | |||
|---|---|---|---|
| Quadrant | BADHDUFLAG | Total packets | Discarded packets |
| A | 0 | 10 | 0 |
| B | 0 | 11 | 0 |
| C | 0 | 11 | 0 |
| D | 0 | 11 | 0 |
| Quadrant | Total seconds | Saturated seconds | Saturation percentage |
|---|---|---|---|
| A | 6944 | 231 | 3.326613% |
| B | 6944 | 134 | 1.929724% |
| C | 6944 | 87 | 1.252880% |
| D | 6944 | 206 | 2.966590% |
Noise dominated data is calculated using 1-second bins in cleaned event files. If a bin has >2000 counts, and if more than 50% of those come from <1% of pixels, then it is considered to be noise-dominated and hence unusable.
| Quadrant | # 1 sec bins | Bins with >0 counts | Bins with >2000 counts | High rate bins dominated by noise | Noise dominated (total time) | Noise dominated (detector-on time) | Marked lightcurve |
|---|---|---|---|---|---|---|---|
| A | 7794 | 6945 | 33 | 33 | 0.42% | 0.48% | 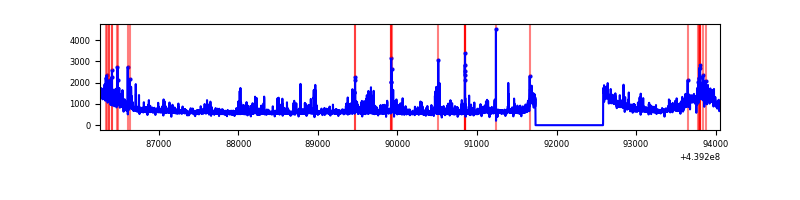 |
| B | 7794 | 6945 | 23 | 23 | 0.30% | 0.33% | 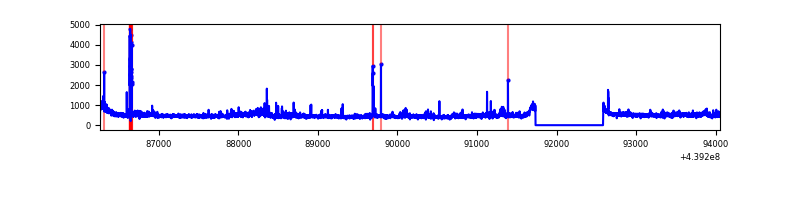 |
| C | 7794 | 6945 | 9 | 9 | 0.12% | 0.13% | 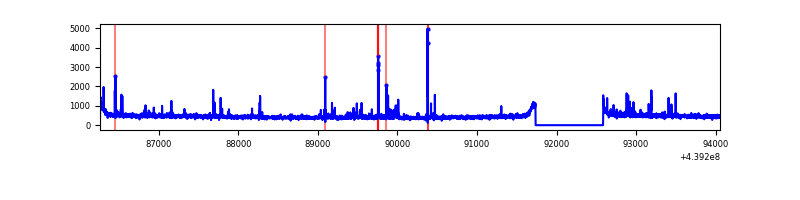 |
| D | 7794 | 6945 | 111 | 111 | 1.42% | 1.60% | 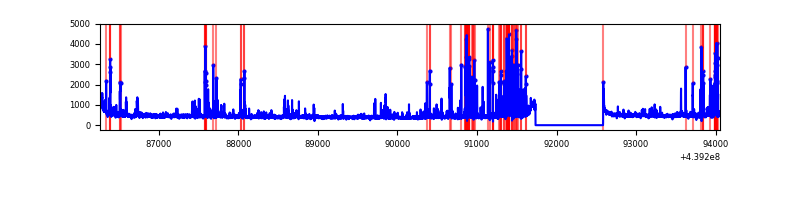 |
Top three noisy pixels from each quadrant. If the there are fewer than three noisy pixels in the level2.evt file, extra rows are filled as -1
| Pixel properties | Quadrant properties | ||||||
|---|---|---|---|---|---|---|---|
| Quadrant | DetID | PixID | Counts | Sigma | Mean | Median | Sigma |
| A | 10 | 83 | 1467927 | 8961.56 | 784 | 765 | 163.7 |
| A | 15 | 223 | 749755 | 4574.9 | 784 | 765 | 163.7 |
| A | 10 | 248 | 99418 | 602.58 | 784 | 765 | 163.7 |
| B | 0 | 155 | 89395 | 568.88 | 784 | 760 | 155.8 |
| B | 5 | 235 | 67941 | 431.18 | 784 | 760 | 155.8 |
| B | 0 | 219 | 52930 | 334.84 | 784 | 760 | 155.8 |
| C | 2 | 14 | 75238 | 400.31 | 784 | 784 | 186.0 |
| C | 14 | 254 | 73337 | 390.09 | 784 | 784 | 186.0 |
| C | 4 | 254 | 32369 | 169.82 | 784 | 784 | 186.0 |
| D | 13 | 249 | 596858 | 3030.95 | 775 | 752 | 196.7 |
| D | 1 | 52 | 88615 | 446.75 | 775 | 752 | 196.7 |
| D | 2 | 249 | 36237 | 180.43 | 775 | 752 | 196.7 |
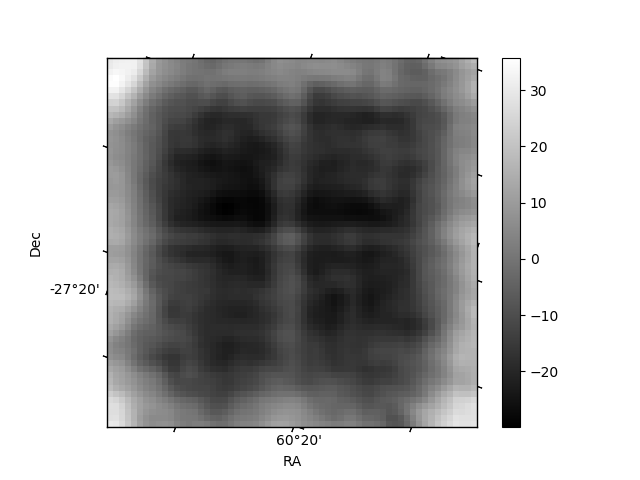
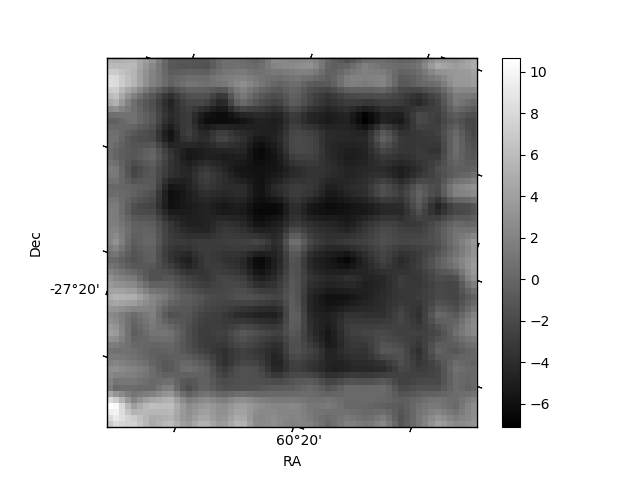
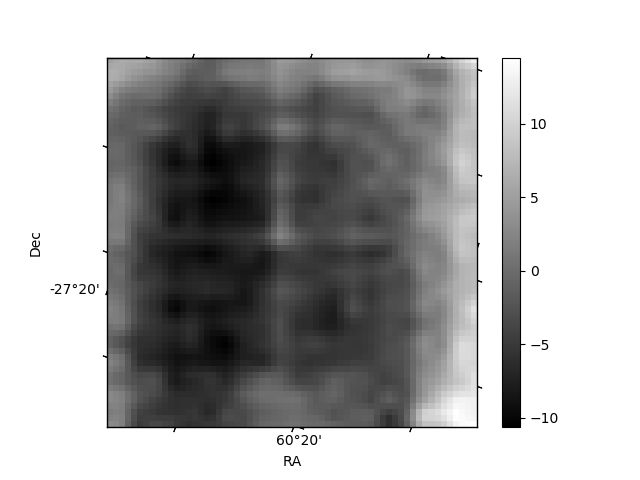
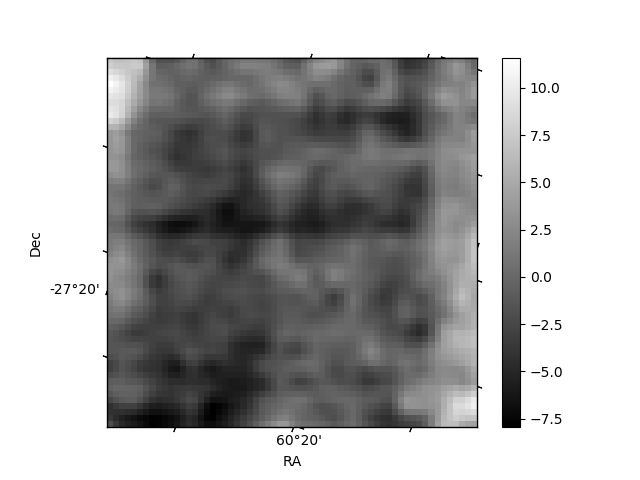
Histogram calculated using DETX and DETY for each event in the final _common_clean file
| Quadrant A | 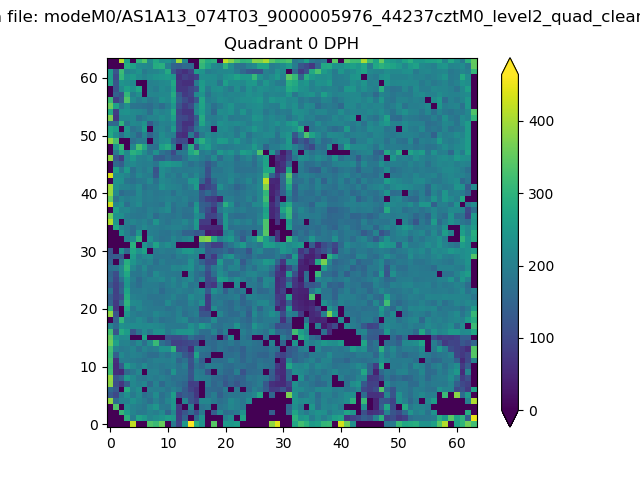 |
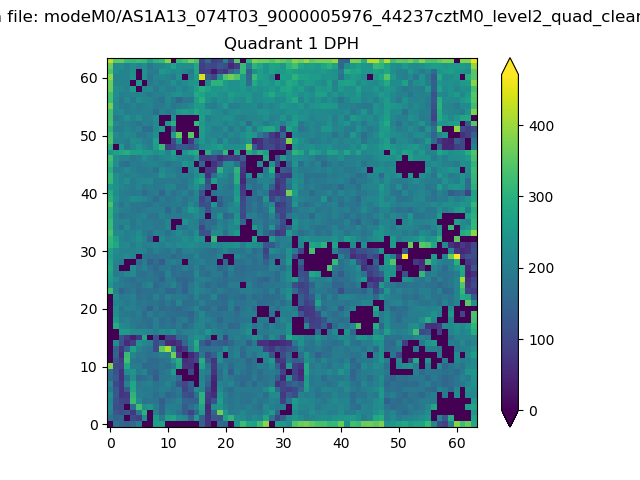 |
Quadrant B |
|---|---|---|---|
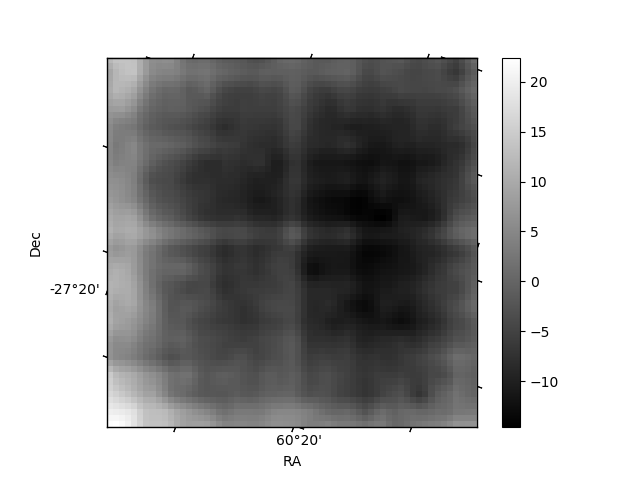
| Quadrant D | 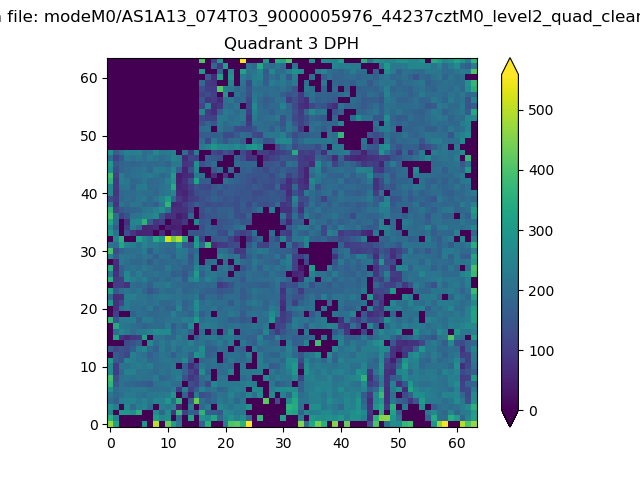 |
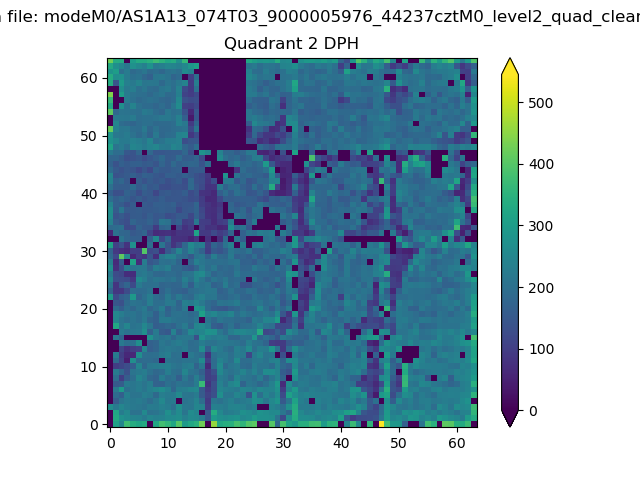 |
Quadrant C |
| Plot type | Count rate plots | Images |
|---|---|---|
| Comparison with Poisson distribution Blue bars denote a histogram of data divided into 1 sec bins. Red curve is a Poisson curve with rate = median count rate of data. |
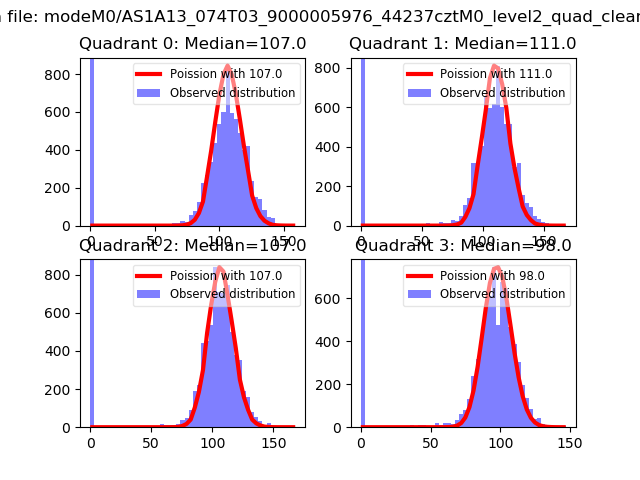 |
 |
| Quadrant-wise count rates Data is divided into 100 sec bins |
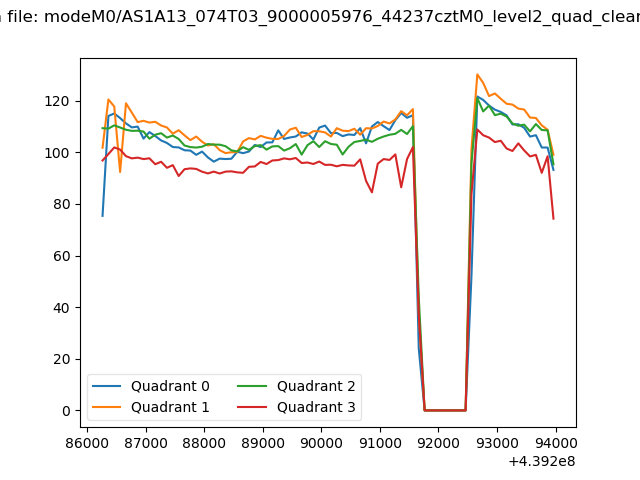 |
|
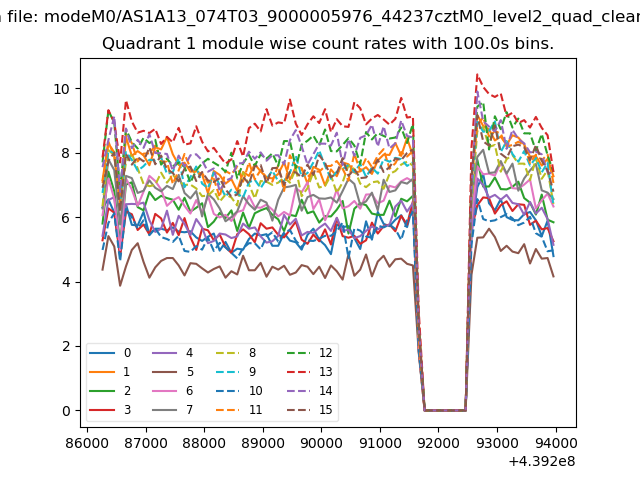
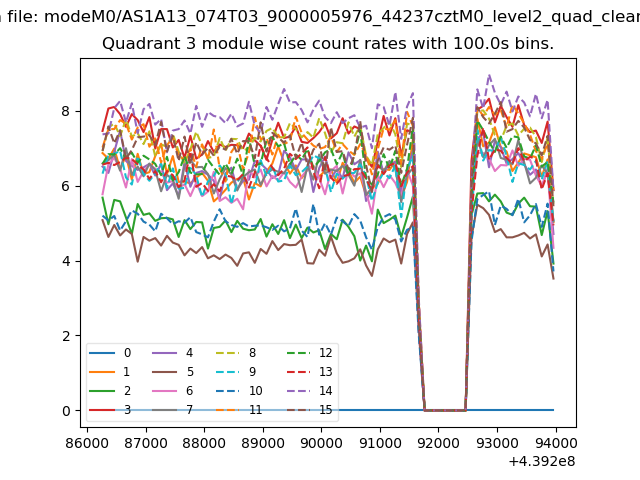
| Module-wise count rates for Quadrant A Data is divided into 100 sec bins |
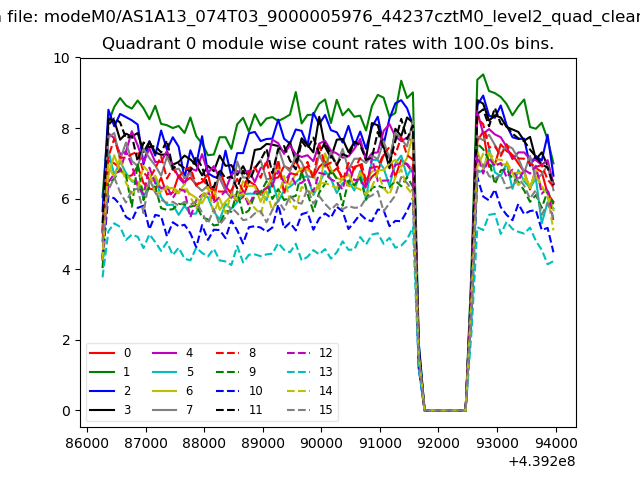 |
 |
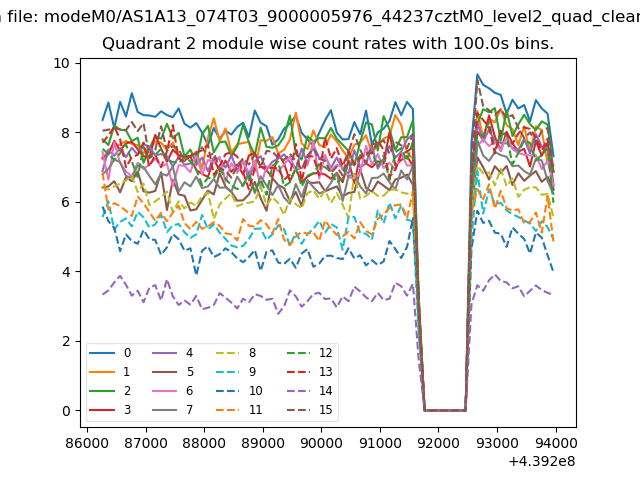
| Module-wise count rates for Quadrant B Data is divided into 100 sec bins |
 |
 |
| Module-wise count rates for Quadrant C Data is divided into 100 sec bins |
 |
 |
| Module-wise count rates for Quadrant D Data is divided into 100 sec bins |
 |
 |
| Parameter | Plot |
|---|---|
| CZT HV Monitor | 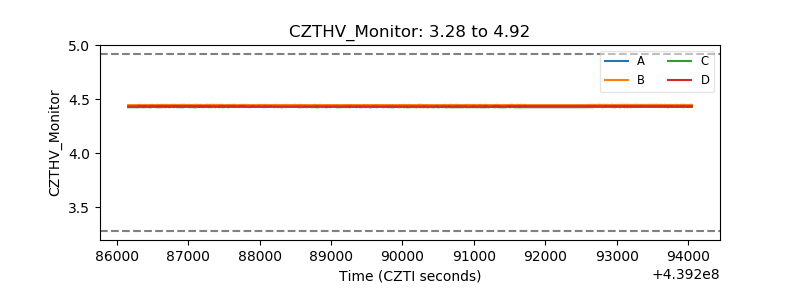 |
| D_VDD | 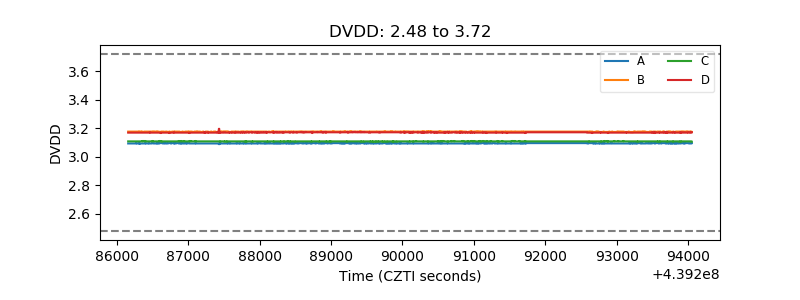 |
| Temperature 1 | 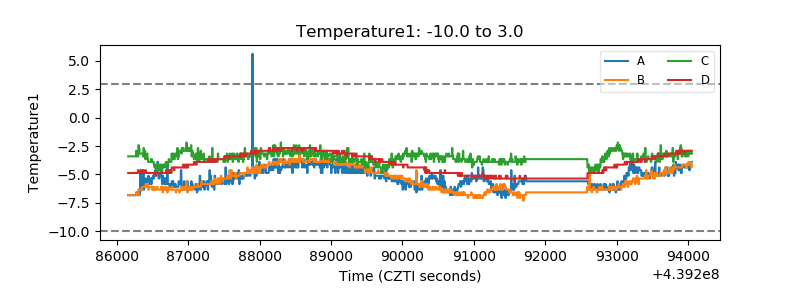 |
| Veto HV Monitor | 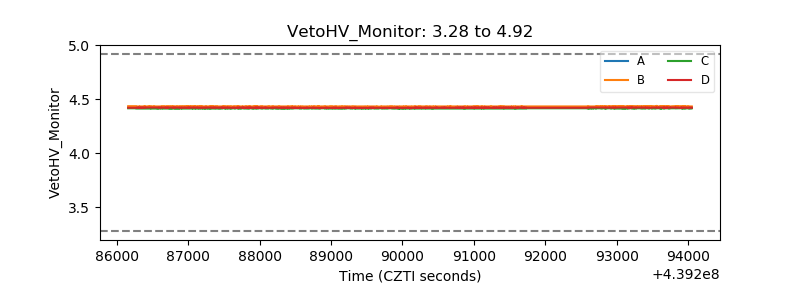 |
| Veto LLD | 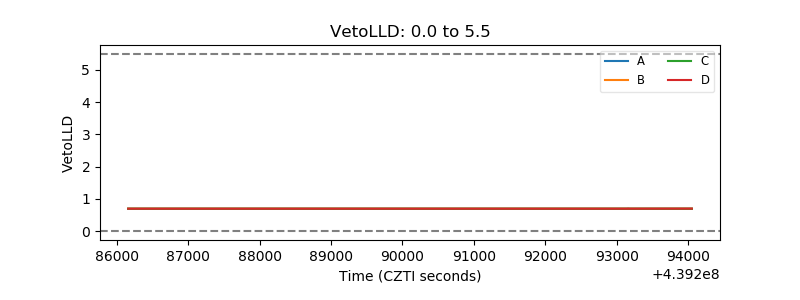 |
| Alpha Counter | 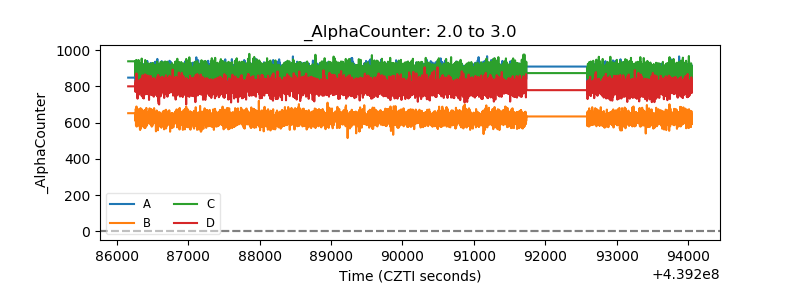 |
| _CPM_Rate | 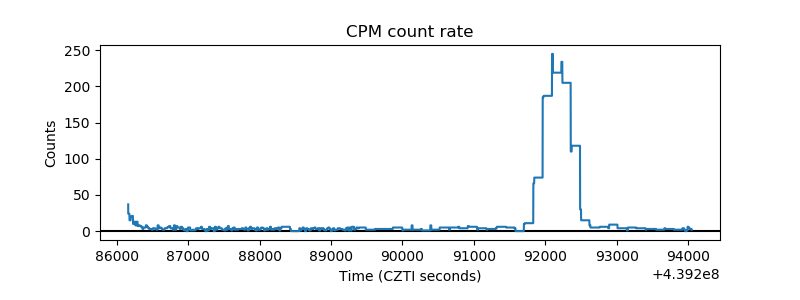 |
| CZT Counter | 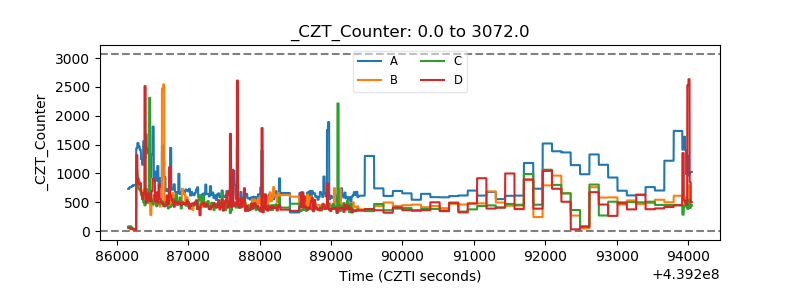 |
| +2.5 Volts monitor | 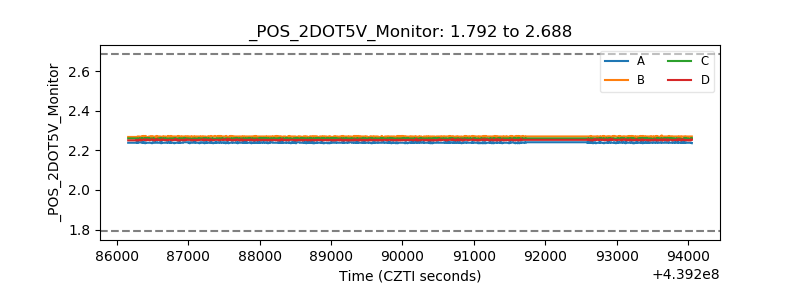 |
| +5 Volts monitor | 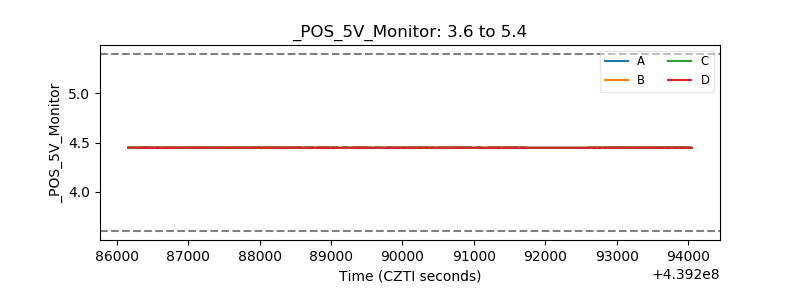 |
| _ROLL_ROT | 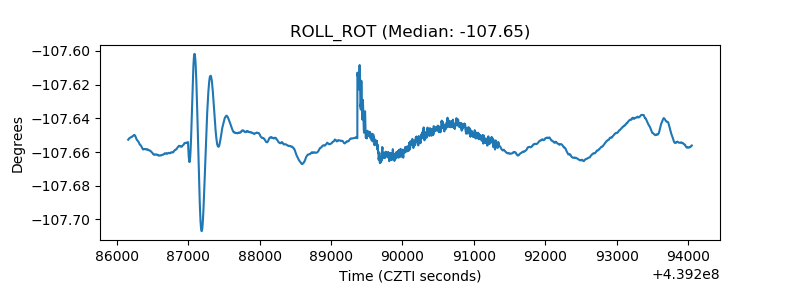 |
| _Roll_DEC | 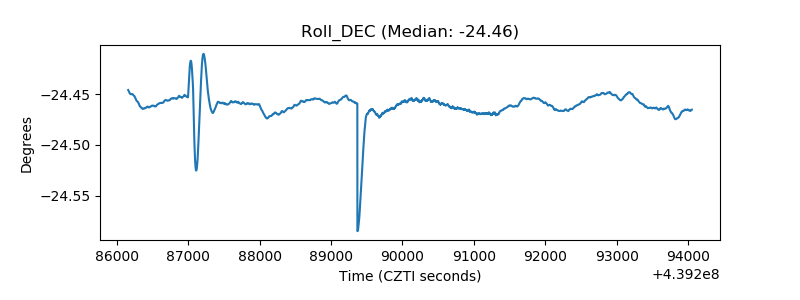 |
| _Roll_RA | 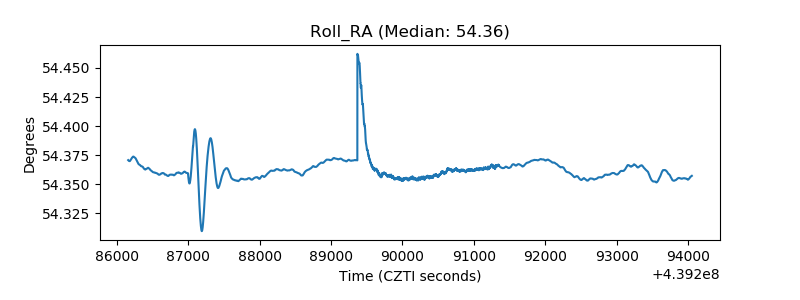 |
| Veto Counter | 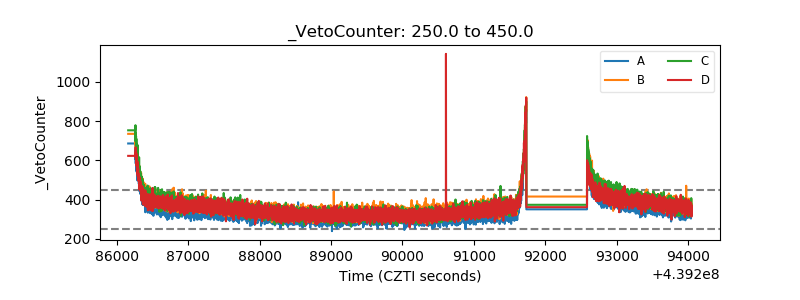 |